Drawing & annotating on charts
Interpreting charts and price patterns is made much simpler with the ability to draw trend lines and save annotations. All the drawings and annotations added to any security will be saved permanently. You can navigate away from the share, and come back later and the drawings will still be available.

Drawing Basics
Before we look at the range of tools available in the each section of the Draw menu, we should look at the shared basic behaviour of drawings.
The Toolbar
As soon as you click to add a drawing tool a black drawing toolbar will appear giving control over the generated drawings.
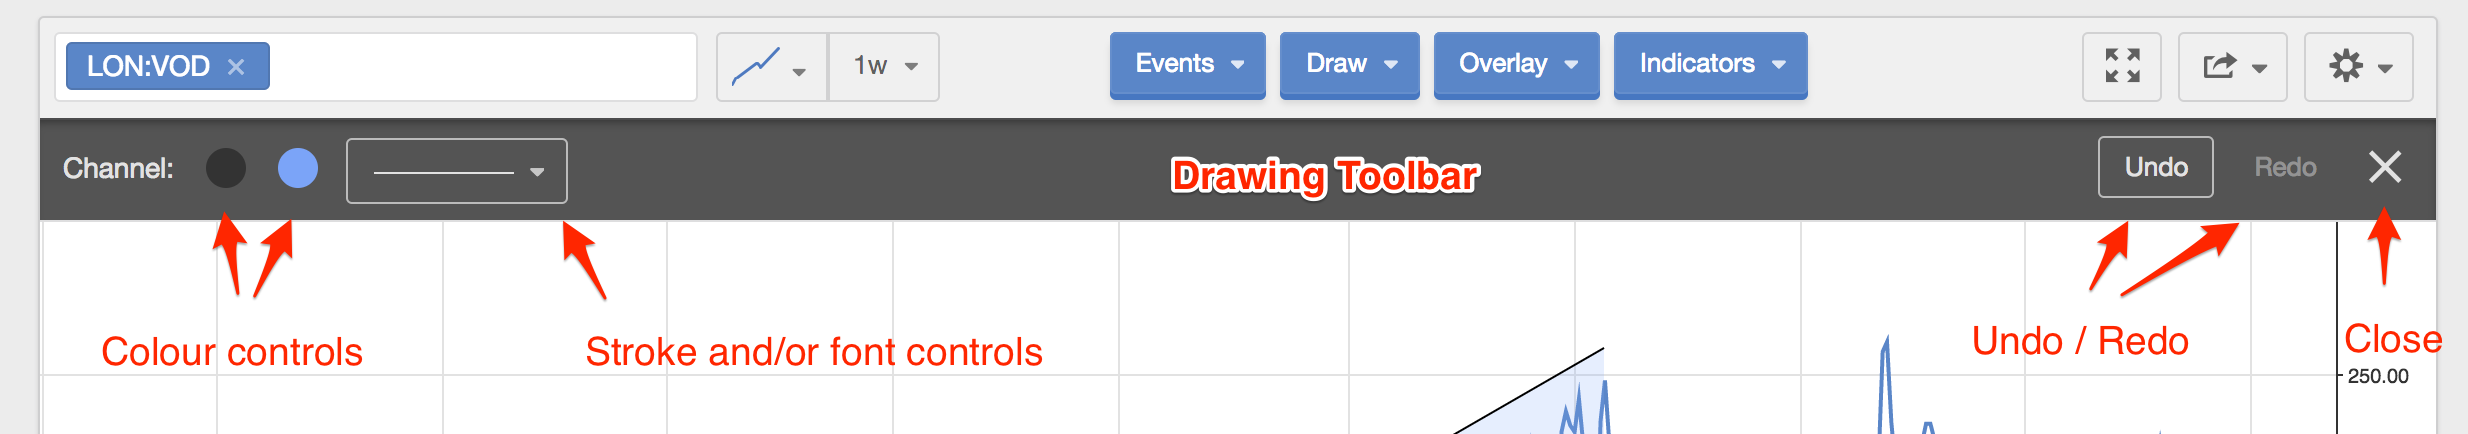
Colours, line stroke, font sizes and types can be controlled by using this simple editing panel. Undo and Redo edit buttons are also provided as well as an X icon to remove the toolbar and exit the drawing tools.
Removing & Editing Drawings
If you want to remove any drawing from the chart, you can hover over the drawing and right click it with your mouse. Alternatively a two finger touch gesture will do the same.
Many drawings (e.g. lines) can be edited by clicking and dragging the drawing controls that appear when hovering over the drawing.

Annotations
The first three options (Text, Callout and Arrow) in the Draw menu allow you to make simple annotations on a chart.
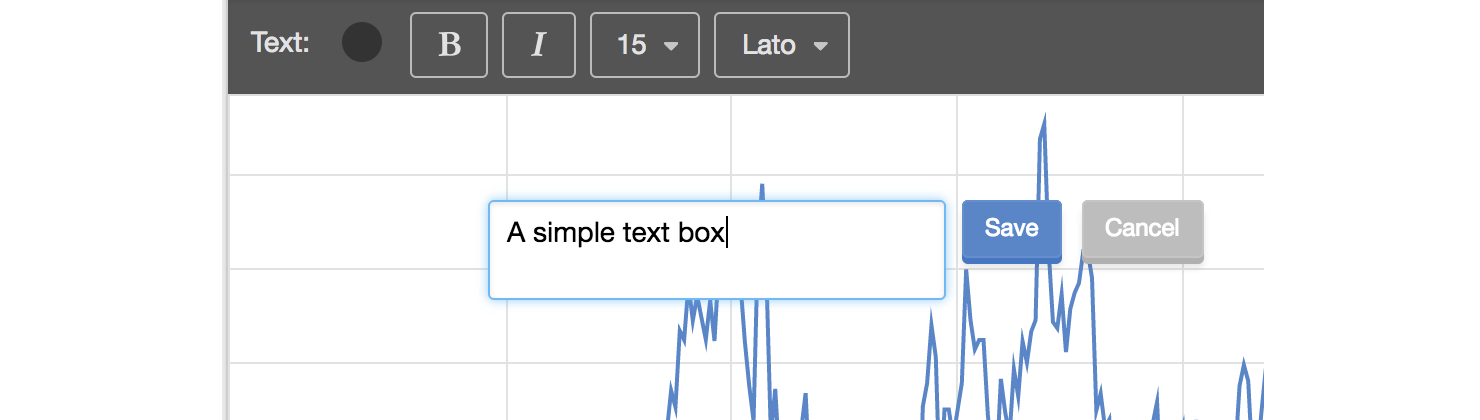
Text Boxes
A simple text option for adding notes to a chart. Click “Text” in the draw menu, type in some text, then save (or cancel). It’s important to set the colour, font and style of the text in the Drawing Toolbar before you add it as it cannot be edited once added.
Callouts
A simple callout box that encloses text within a pointed bubble. This allows you to point text at a specific price bar in any chart.

Arrows
If you want to point an arrow at a specific part of the chart this is your preferred option. Here’s how to use the arrow tool.
- Click Arrow on the Draw menu.
- Click once on the chart and move the cursor to create the arrow shape and size that you want. Click a second time to fix the shape and size.
- Next, move the cursor to change the orientation of the arrow. Click a second time to fix the orientation.
- Finally, click-and-drag the arrow into position by clicking the centre of the arrow.
- Undo any of these steps by clicking Undo, or double-click the arrow to delete it.

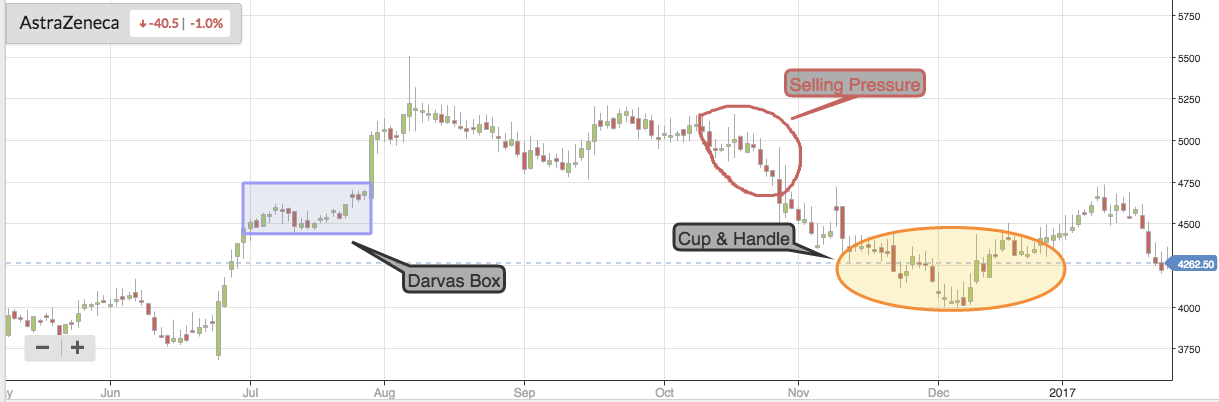
Shapes
The next section of the Draw menu gives you the option to draw Shapes on a chart, with tools including Freehand, Rectangle and Ellipse. With these tools you can draw multiple Shapes on a chart, which will automatically save until you choose to delete them.
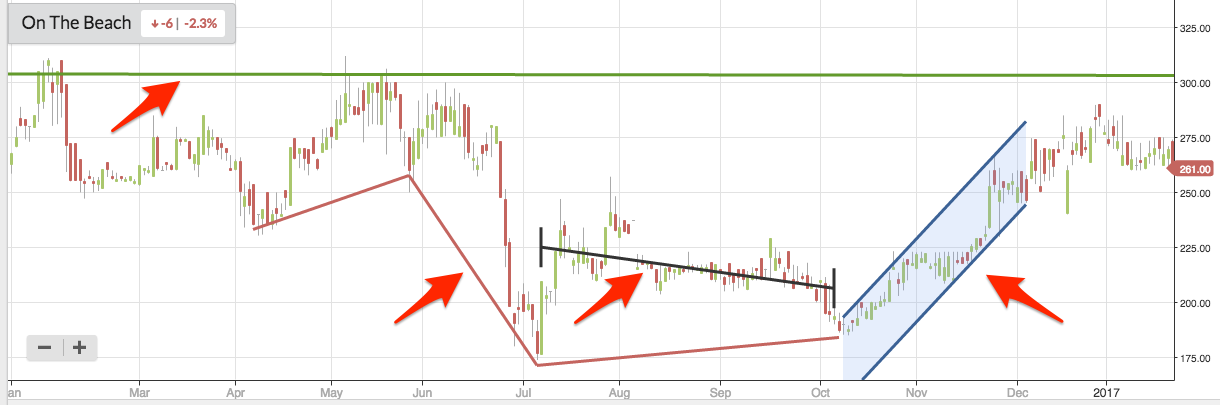
Lines
In the Lines section of the Draw menu, you’ll find a selection of line-drawing tools that you can apply to your charts. The tools include Single line, Continuous line, Regression trend and Channel. In each case, click once on the chart to begin your line, and click again where you want it to end.
Measurements
The last section on the Draw menu offers Measurements tools, including % Measurement and Fibonacci lines.

% Measurement allows you to draw a line between two points to quickly calculate percentage price movements. For example, on this chart for the company Staffline, you can see that a profit warning caused a sharp fall in price. Using the % Measurement tool, it possible to get a quick calculation of the price change, both in real terms and as a percentage - in this case -34%

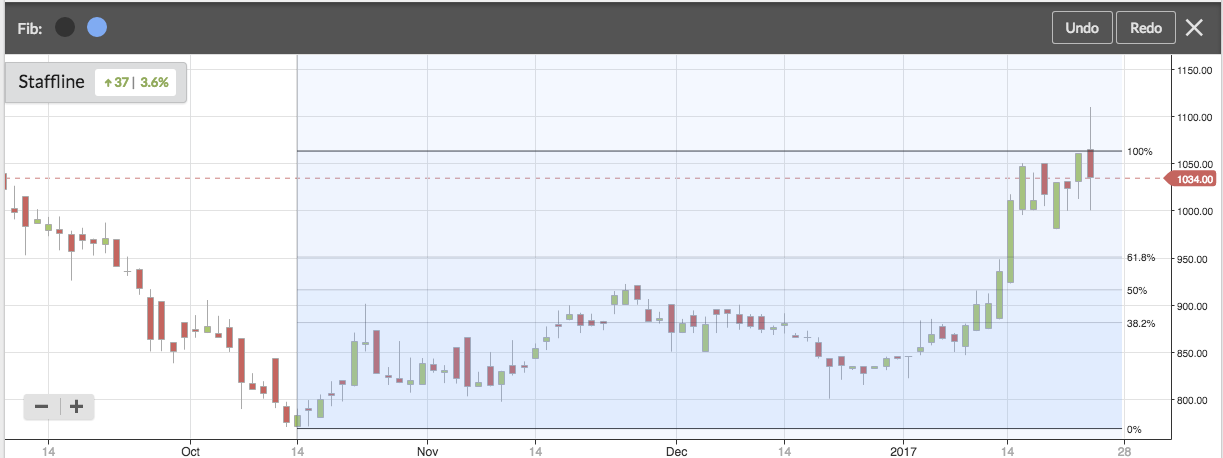
Finally, Fibonacci lines - or Fibonacci retracement - can be applied to a chart in order to identify possible levels of support and resistance in price trends.
The tool is used by taking two extreme price points (a high and a low) over a set period. Simply click at the lowest price and click again at the highest price. This will produce a Fibonacci area.
The retracement is deemed to start at the lowest price point - 0.0%. From there, lines are calculated and applied using the Fibonacci sequence - at 38.2%, 50% and 61.8%. At 100%, the reversal is deemed to have completed.