Ichimoku Clouds
Ichimoku Clouds are used to find areas of support, resistance, trends and momentum and can be used to identify trading signals.
Ichimoku Clouds consist of five trend lines:
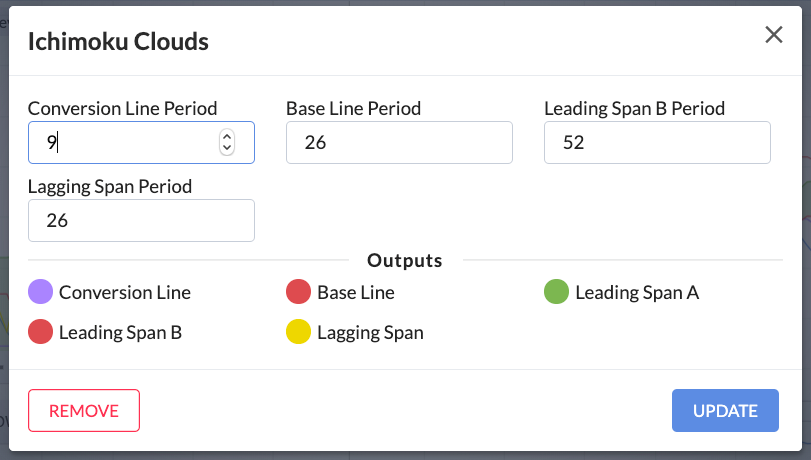
- The Conversion Line (or Tenkan-Sen): This is typically the midpoint (ie. average) of a 9-period High-Price and a 9-period Low-Price. The period can be days, weeks or even months.
- The Baseline (or Kijun-Sen): This is typically the midpoint of a 26-period High-Price and a 26-period Low-Price.
- The Leading (Senkou) Span A: This is the midpoint between the Conversion and Base lines. It is also plotted 26 periods ahead of the current period.
- The Leading (Senkou) Span B: This is the midpoint between the 52-period High and the 52-period Low. Like the Senkou Span A, it is plotted 26 periods into the future.
The space between Span A and Span B is a shaded area known as the Kumo Cloud. It is red when Span A is below Span B. It turns green when Span A rises above Span B.
- The Lagging (Chikou) Span is the Closing Price, plotted over the previous 26 periods.
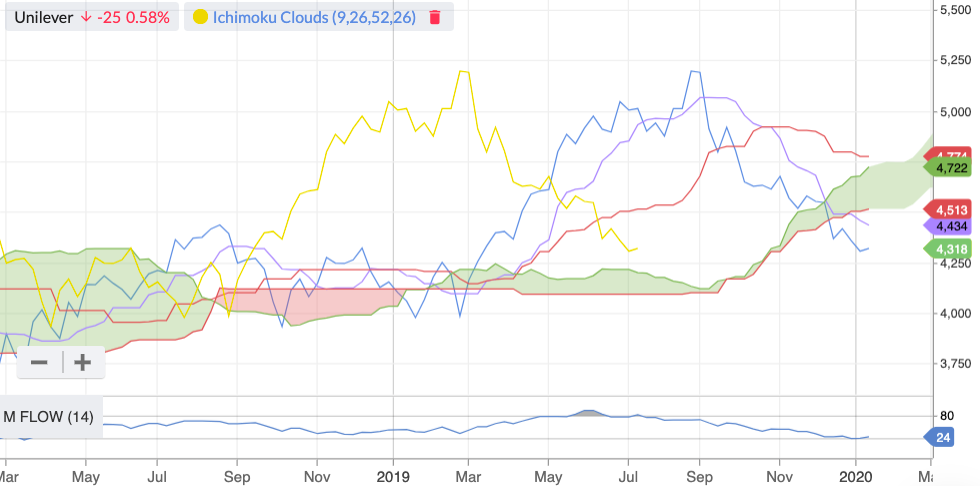
The overall trend is up when prices are above the cloud, down when prices are below the cloud and flat when they are in the cloud itself. In an uptrend, a green cloud indicates more strength. In a down trend, a red cloud indicates more weakness. Because the cloud is shifted forward 26 periods, it also gives an indication of support and resistance in the future.
The key settings for Ichimoku Clouds can be customised by launching the settings modal.