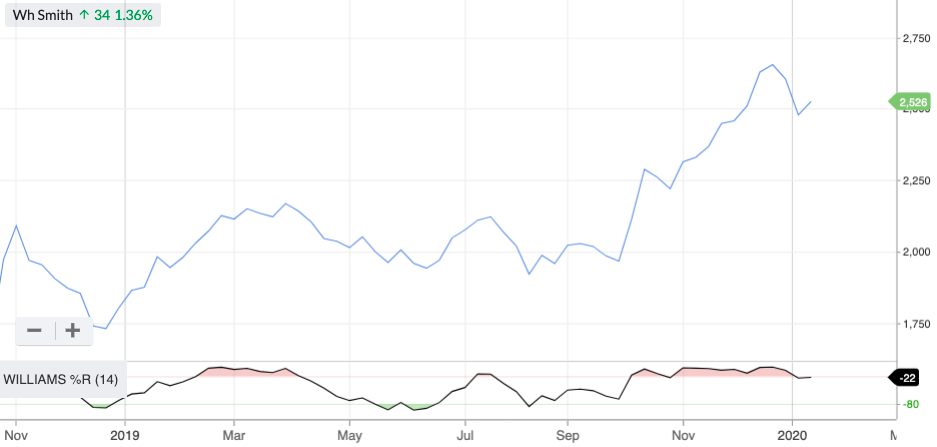
Williams %R

The Williams %R is a momentum indicator that compares a stock’s current price to its Highest High and Lowest Low price over a specified period of time (typically 14 days). It is calculated using the following formula:

Williams %R = (Period Highest High - Current Price) / (Period Highest High - Period Lowest Low) x -100

Larry Williams - who first developed this indicator - considered values below -80 as oversold and above -20 as overbought.

f025f989db0fb2176944007175aa241b04da62c41579013267.png


A subscription to Stockopedia will be one of the best investments you'll ever make...

Here's what you'll get:
A decade of research into what works in stock markets
Millions of pounds of platform investment
Countless hours of research time saved
Access to hundreds of educational articles and ebooks
Over 30 talented professionals working flat out for you
A team of the very best bloggers acting as mentors
Saving you thousands in advisory fees every year
Stockopedia is the perfect solution for the time-poor individual investor looking for results
Starting at just £295 per year

After your free trial, plans start at just £295 per year. With a one month money back guarantee, there's no risk.

© Stockopedia 2024, Refinitiv, Share Data Services.

*Past performance is no indicator of future performance. Performance returns are based on hypothetical scenarios and do not represent an actual investment.

This site cannot substitute for professional investment advice or independent factual verification. To use Stockopedia, you must accept our Terms of Use, Privacy and Disclaimer & FSG. All services are provided by Stockopedia Ltd, United Kingdom (company number 06367267). For Australian users: Stockopedia Ltd, ABN 39 757 874 670 is a Corporate Authorised Representative of Daylight Financial Group Pty Ltd ABN 77 633 984 773, AFSL 521404.