Estimate data types
We focus on the Consensus Estimate for Sales, Earnings and Dividends. Refinitiv consensus estimates provide the mean, median, standard deviation, high and low figures for the full range of broker forecasts. We always display the relevant mean figure on our Stock Reports and use it in all our calculations of forecast data.
Using the consensus helps to avoid focusing in on an individual estimate that may confirm our own biases, helping us to remain impartial.
Stockopedia Data
In the Screener, we provide a range of screenable forecast items (see our Glossary). However, we try to be selective in the Stock Report and focus on displaying the estimate items that are likely to have the most useful signals. This is because it is important to use analyst estimates carefully.
The broker estimates section of our Stock Report shows detailed earnings forecast data and whether analysts have been increasing or reducing their forecasts on a 1 month and 3 month basis. The numbers are colour coded to facilitate a quick review. Due to price anchoring, it tends to be a positive signal if forecasts have been repeatedly upgraded, and clearly a negative one in the opposite scenario.
Broker Forecasts
This section of the Stock report shows detailed earnings forecast data and whether analysts have been increasing or reducing their forecasts on a 1 month and 3 month basis. The numbers are colour coded for quick review.
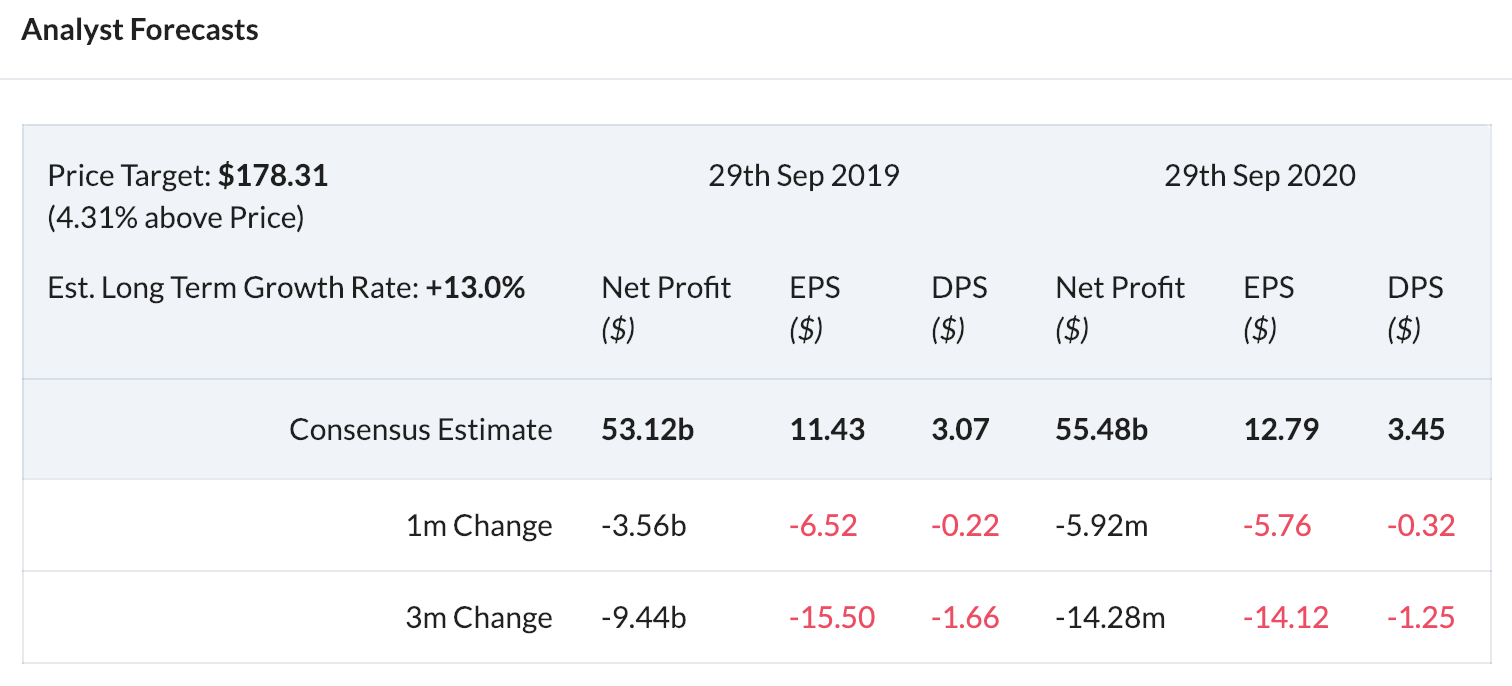
- Price Target - This shows the consensus price target given by covering brokers. The numbers are at the discretion of each broker and tend to be on a 1 year timeframe. They should be used with caution.
- Long term growth forecast - again this is a particularly inaccurate measure from brokers, but may help with understanding the consensus expectations.
Broker's Consensus Trend
Due to a behavioural bias called anchoring analysts tend to ratchet their forecasts in one direction or the other only slowly. As a result it tends to be a positive signal if forecasts have been consistently upgraded, and a negative one in persistently downgraded. The trend is your friend!
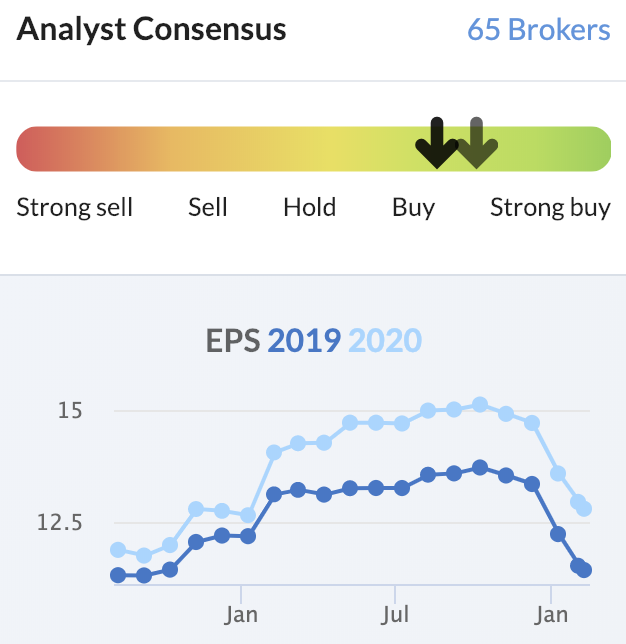
Consensus Recommendation
The horizontal bar displays the consensus recommendation from strong sell to strong buy, it also shows in grey where the consensus was 3 months ago so you can spot movements.
Recommendation data should be taken with a pinch of salt. Due to the fact that many broking firms also provide corporate finance services to their clients, it has been shown that brokers are reluctant to put out 'sell' recommendations. The majority of stocks analysed in the city are 'buys' or 'outperforms', and much research has indicated that stocks with a 'sell' rating actually outperform stocks with a 'buy' rating. This indicator is provided for reference only, but can sometimes be used as a useful contrarian signal. For a full indication of how poor broker recommendations can be please do read this article by our CEO Ed Croft “Can you beat the market using broker buy recommendations?"
Forecast Trend
The trend in forecasts is charted below the broker consensus. This shows how the current year forecast has changed over the last 18 months. Most investors soon learn that companies with a habit of beating forecasts tend to outperform the market. The reason is that due to a behavioural quirk called price anchoring, analysts tend to raise their forecasts too conservatively. This can lead to sequences of earnings upgrades and surprises which investors can take advantage of.

