A RiskRating for every stock
The RiskRatings are Stockopedia’s classification of the market volatility of every company’s share price. We have designed the RiskRatings to be both a useful predictive measure of future volatility, but also an easy to use measure for accessing the “low volatility anomaly” - the unusual fact in equities, that lower volatility securities tend to outperform high volatility securities over the long term.
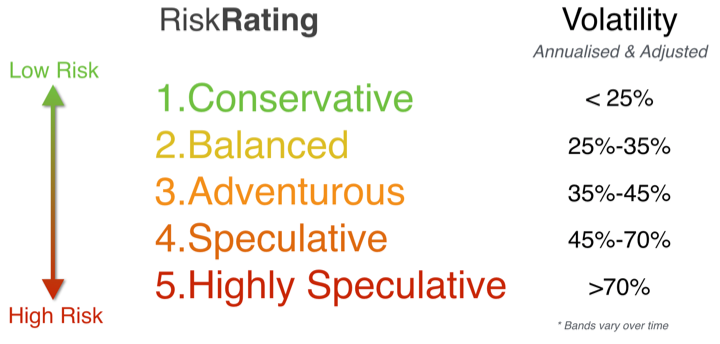
The five classifications (from least to most volatile) are Conservative, Balanced, Adventurous, Speculative and Highly Speculative. At any time 10% of the market will be classified as Conservative, 15% Balanced, 20% Adventurous, 25% Speculative and 30% Highly Speculative.
In general, larger, more predictable and more profitable companies (such as Microsoft or Unilever) tend to be classified as Conservative, while younger, news driven, early revenue companies (such as Snap Inc or Sirius Minerals) will be classified as Speculative.
Volatility is the most common measure of risk used in quantitative finance to assess risk adjusted returns. The use of volatility as “risk” is somewhat controversial, and criticised by many value investors. The common complaint is that "risk is not volatility, it is the likelihood of capital loss".
But modern portfolio theory, and most private investors, more broadly define Risk as the possibility of upside gain as well as downside loss. While value investors have struggled to quantify the likelihood of capital loss, Quantitative Investors have proven that price volatility is one of the best predictors of future upside and downside financial risk.
While the RiskRating is the essential rule of thumb for this purpose, we do recommend using the full suite of financial indicators available on Stockopedia to measure standard financial risks - including Bankruptcy Risk, Earnings Manipulation Risk and other Quality factors.
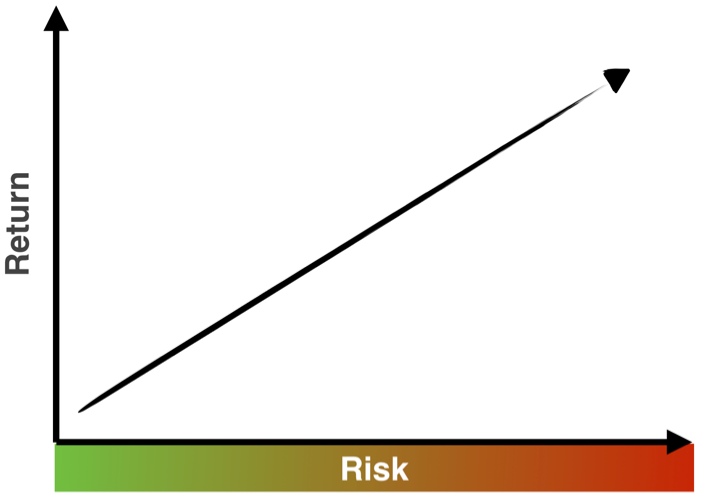
Risk and Return - theory vs practice
Most investors believe in the theory that risk and return are joined at the hip. The idea persists that to achieve higher returns you have to take on more risk.
While this may be true across different asset classes (e.g. high volatility stocks outperform low volatility cash) this theory appears to fall apart within stocks. Research studies by famous academics and practitioners including Haugen & Baker, Blitz & van Vliet and Frazzini & Pederson have proven that historically low volatility (and low beta) shares outperform high volatility shares over the long run (on a risk adjusted basis).
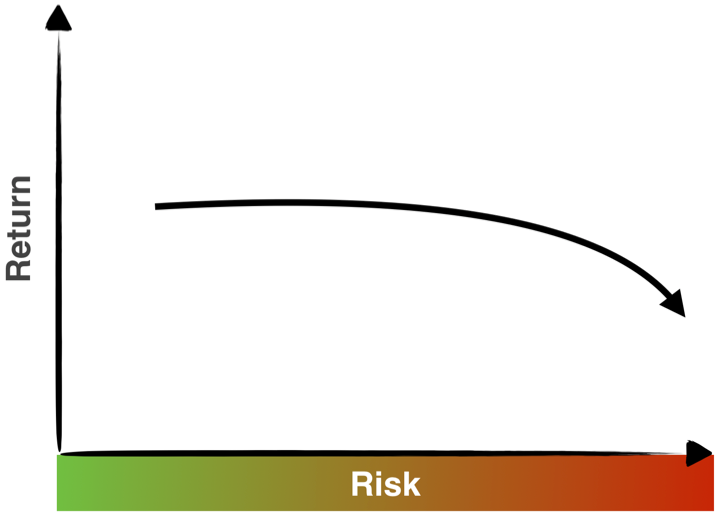
The reason for this ‘anomaly’ is due to a few primary factors. Firstly, investors are often averse to borrowing money to invest in low volatility equities; Secondly, the investment process at institutions is often biased towards risk-seeking by fund managers who seek to improve their bonuses in the short term; Thirdly, private investors often aim for Lottery type rewards from high risk investments. All these factors, and more, ensure that higher risk assets are often systematically over-priced, reducing their eventual returns and inverting the risk-return relationship.
Whatever the reason, the fact remains that so many private investors chase high risk / speculative shares at precisely the wrong moment. As we'll see, there are good times and areas of the market to invest in high risk shares, but over the long term, and in general, a conservative bias in the stock market does bring additional rewards.
For those inclined to investigate the academic research we recommend the research papers listed in the conclusion of this guide.
Understanding RiskRating Performance
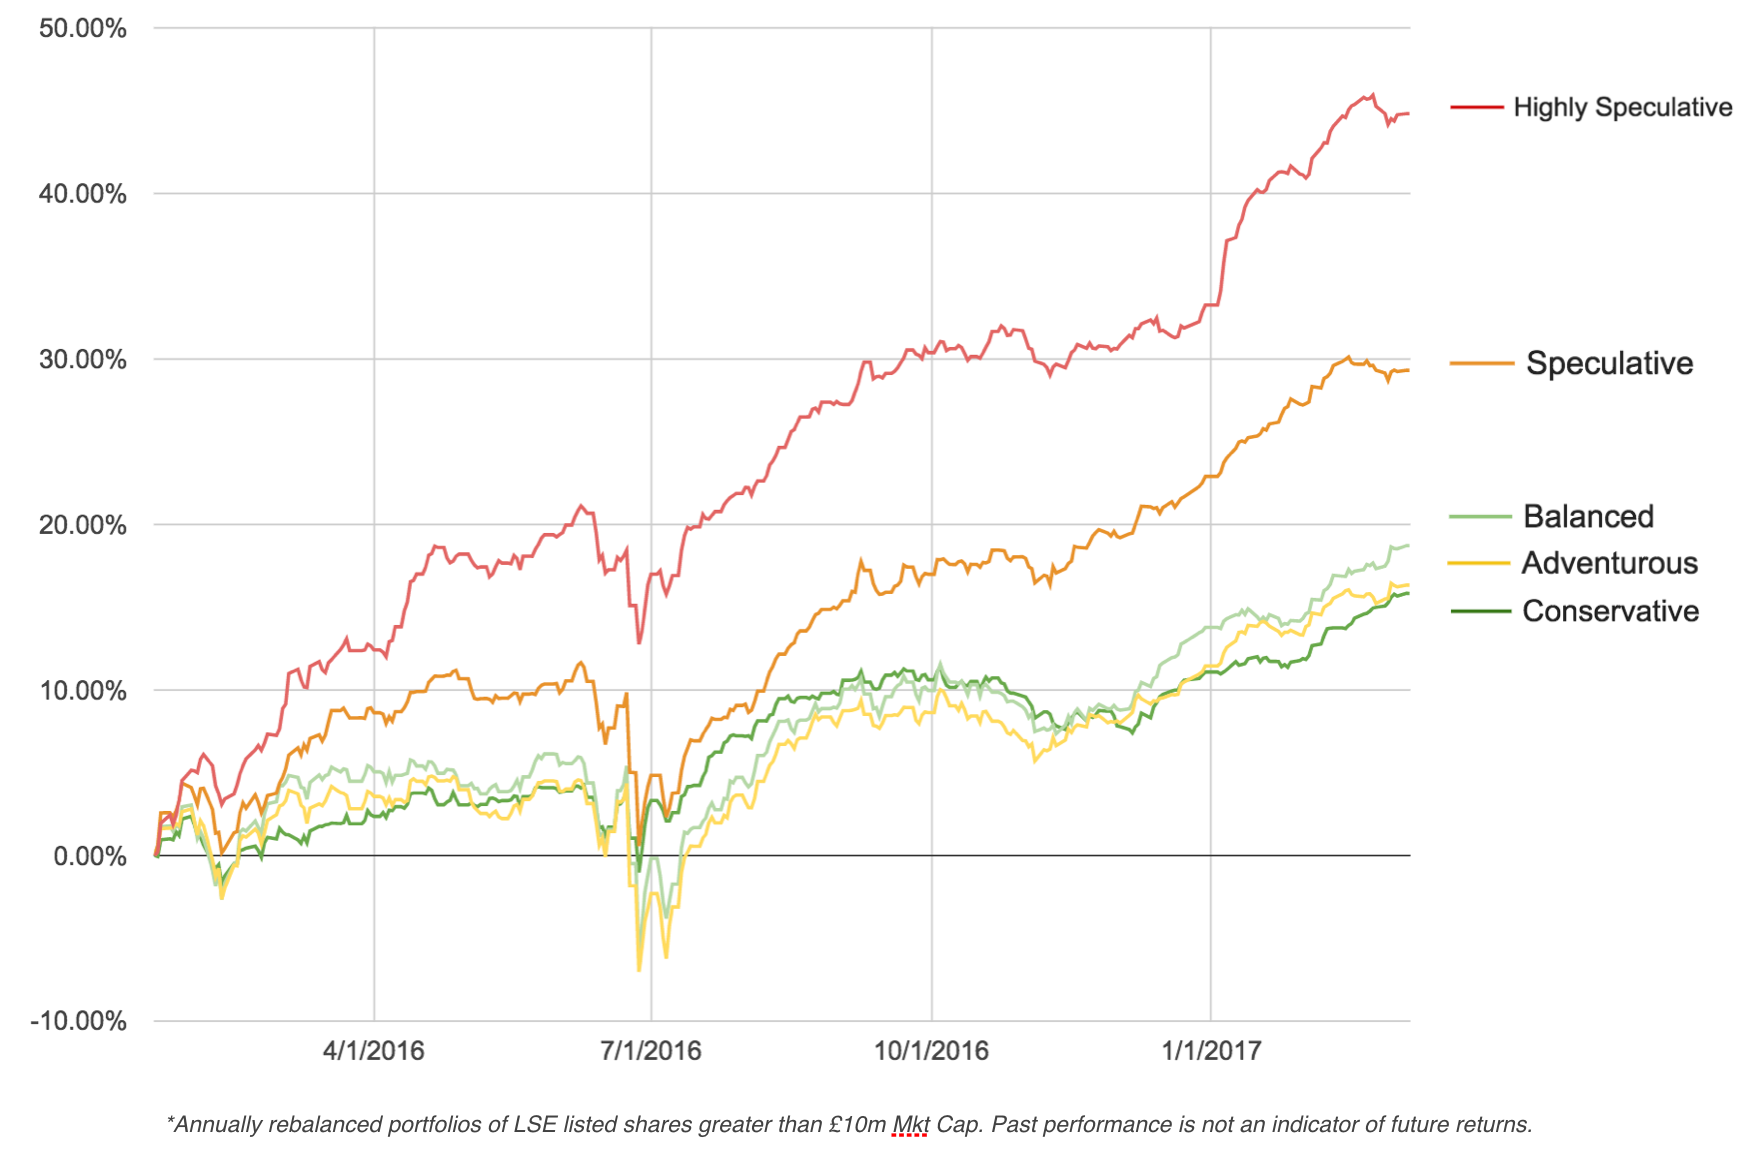
To prove the Low Volatility effect exists outside of the academic realm, we have conducted our own performance study using the RiskRatings across UK securities back to April 2013. We calculated RiskRatings on December 31st each year and constructed equally weighted portfolios of all shares with a greater than £10m market cap at the time. The portfolio performances were tracked for the year and then the portfolios were rebalanced with new RiskRatings.
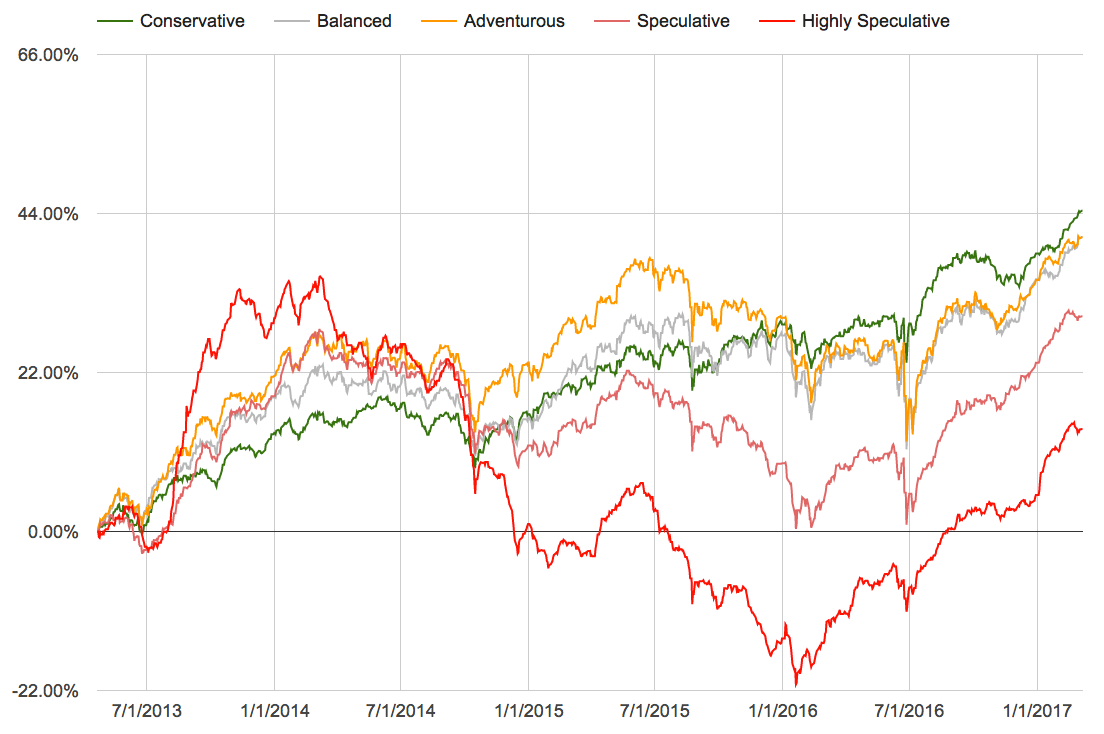
We can draw the following insights:
- the Conservative (lowest volatility) classification has tended to outperform the other segments over the longer term, falling less in negative markets, but rising more slowly in rising markets.
- the higher volatility segments (from Adventurous to Highly Speculative) outperform considerably during ‘risk on’ market periods, but fall faster and harder in downswings and ‘risk off’ periods.
- The Risk-Adjusted-Return (Sharpe Ratio) of each classification declines with increasing volatility.
These insights completely back up the findings from the academic research literature into the Low Volatility Anomaly.
A note of caution
Markets tend to swing between what are known as “Risk on” and “Risk off” periods. While Conservative/Balanced stocks may outperform over the longer term, portfolios of these stocks will likely considerably underperform speculative shares in bullish market periods.
Most investors looking at the above performance chart may say to themselves "Conservative stocks win out so I'll just buy conservative stocks". While this may be a great long term strategy, one has to consider how such an investor would be feeling if he'd bought a Conservative portfolio at the beginning of a 'risk-on' period (such as 2016 ) and held for 18 months... have a look at this chart:
When all your friends are making a fortune in speculative shares it can be very hard to stick to your guns in a conservative strategy. Our experience suggests that many will throw in the towel right at the time that speculative shares hit the top of the cycle. Drastic underperformance of these segments in risk off markets often leads to great financial pressure.
As markets are unpredictable, and temporary underperformance can feel unbearable to many, constructing an all-weather portfolio may minimise the risk of both long term and short term underperformance. The simplest way to do this is to build a portfolio diversified across the RiskRatings.
This may provide a portfolio with some conservative spine to steady the ship in downswings, and enough speculative thrust for meaningful participation in rallies. This could be thought of as an all weather Risk Barbell Portfolio.
Understanding RiskRating Distributions
Investors can use the RiskRatings as an at-a-glance measure of a stock’s volatility, but also as a useful portfolio construction and diversification measure for differing market environments. When thinking about the RiskRating of any stock, it’s worth understanding the distribution of RiskRatings across different market segments.
Firstly all the equities in the stock market are split by RiskRating as follows:
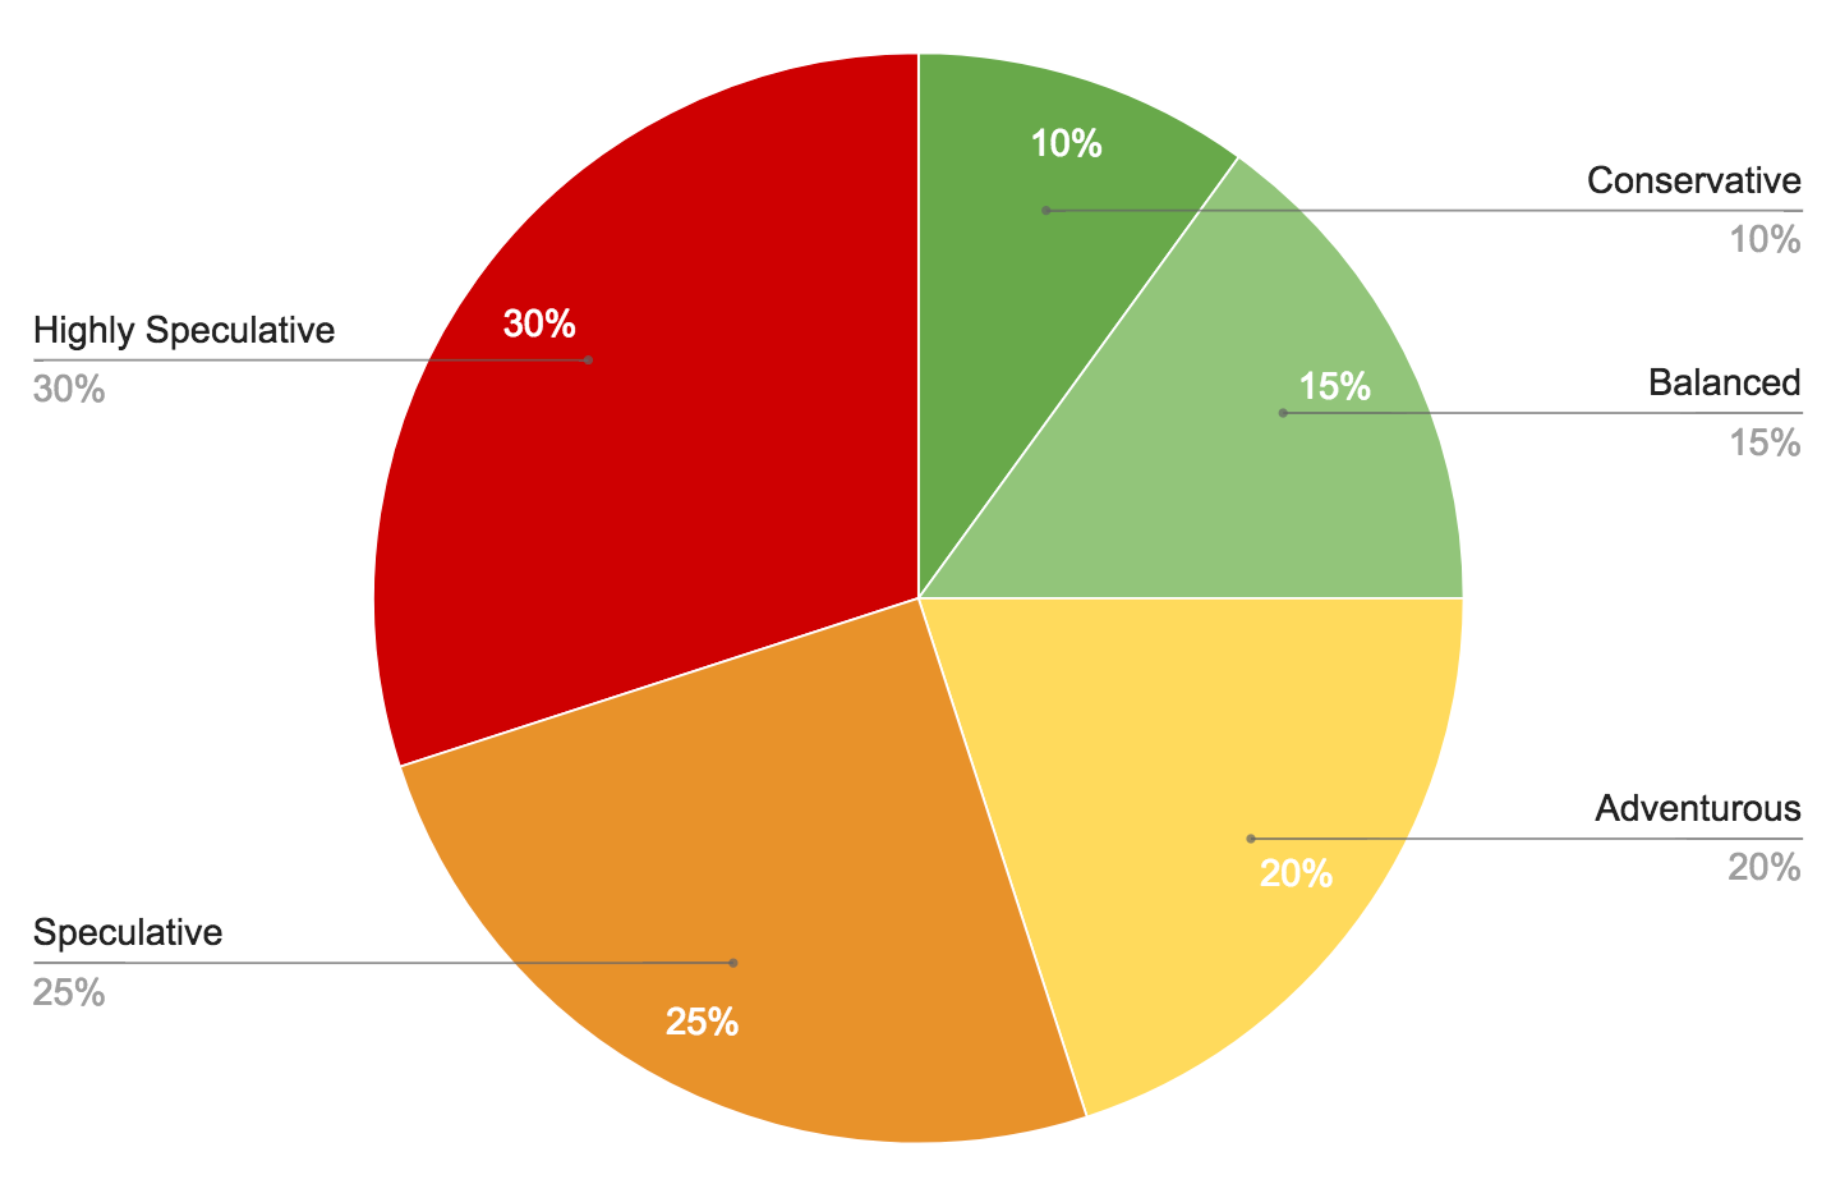
These proportions will never change. So the ratings should be understood to be relative. So if the entire market turns highly volatile for an extended period of time, there will still be 10% of the market classified as "Conservative".
1. The relationship between RiskRating and Size Group
In general the volatility and riskiness of stocks increases as their market capitalisation decreases. The following graphic analyses the RiskRatings and Size Groups of all Pan-European equities.
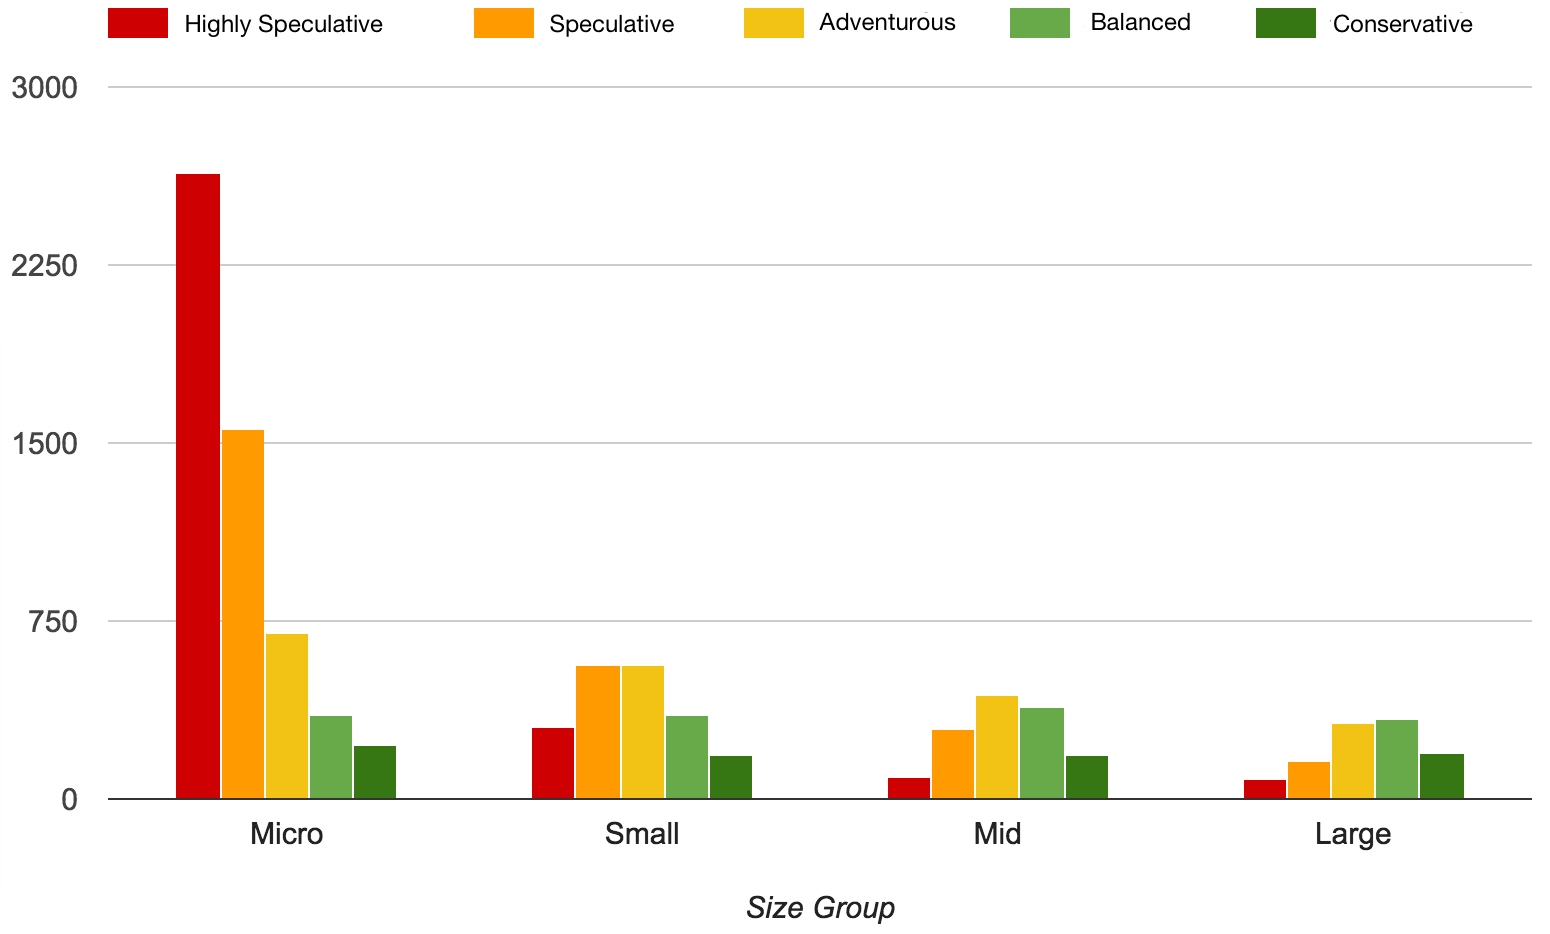
There are a few key insights:
- The number of Conservative and Balanced shares across each size group is fairly similar.
- The number of Adventurous shares increases fairly linearly as size decreases from Large to Micro Cap.
- The count of Speculative and Highly Speculative shares increases exponentially across smaller size groups.
Proportionally large caps are skewed towards lower RiskRatings, while smaller caps are skewed towards higher RiskRatings. In spite of this, it is still possible to build risk diversified portfolios at all Size Groups.
2. The Relationship between RiskRating and StockRank
If we look through the lens of the StockRank - our proprietary ranking of each stock’s Quality, Value and Momentum - we can see a similar picture.
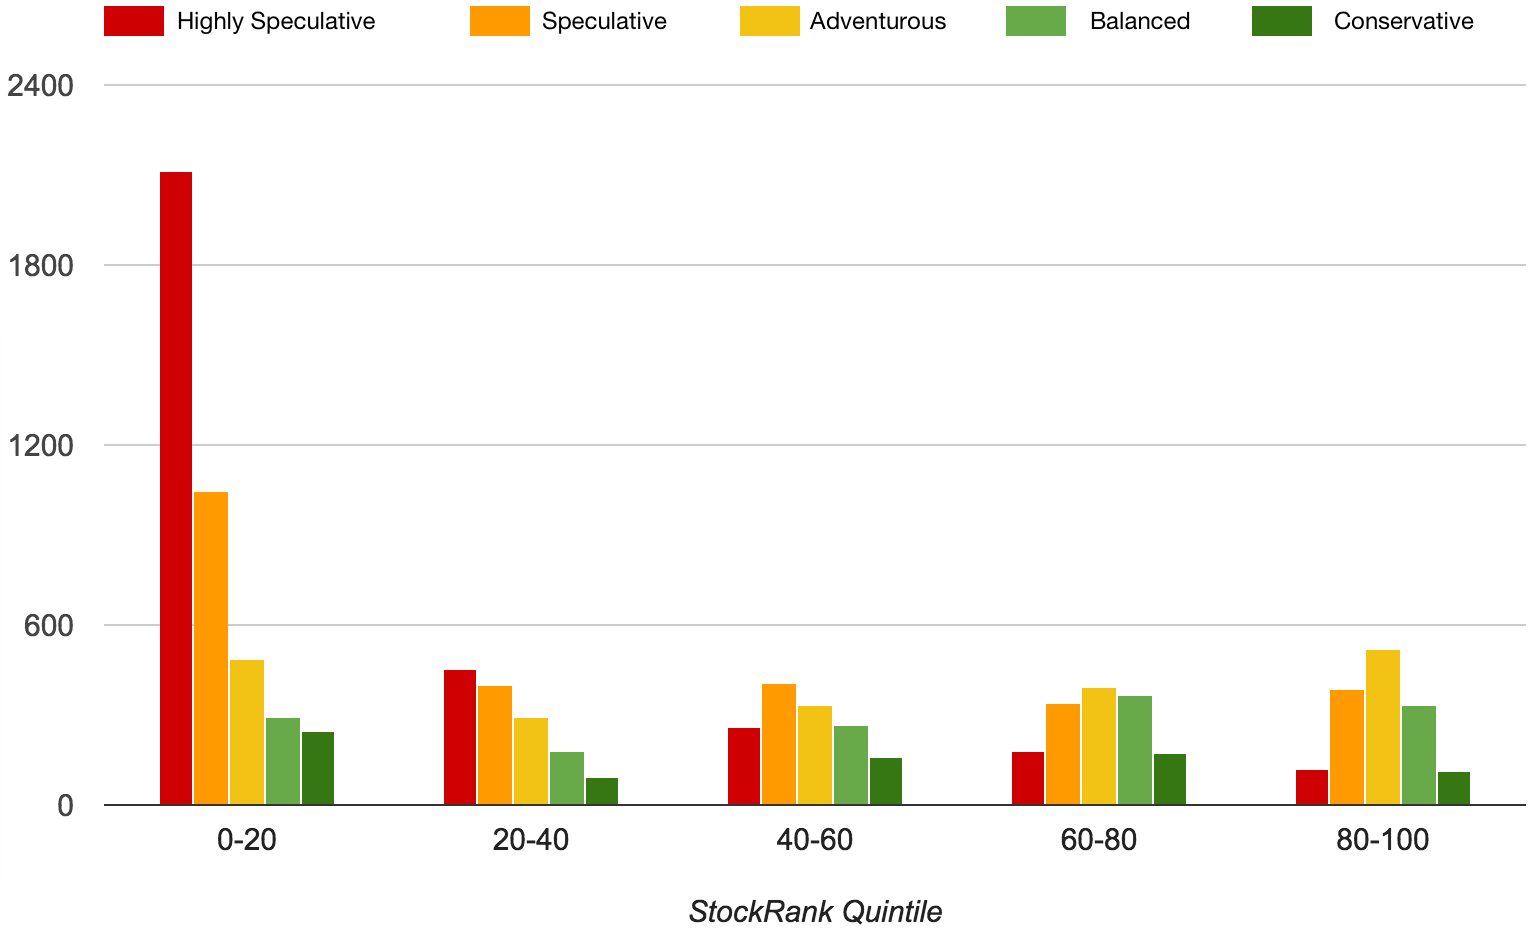
The lowest ranking sets of shares tend to be far more speculative. Higher ranking shares have a proportion of lower RiskRatings.
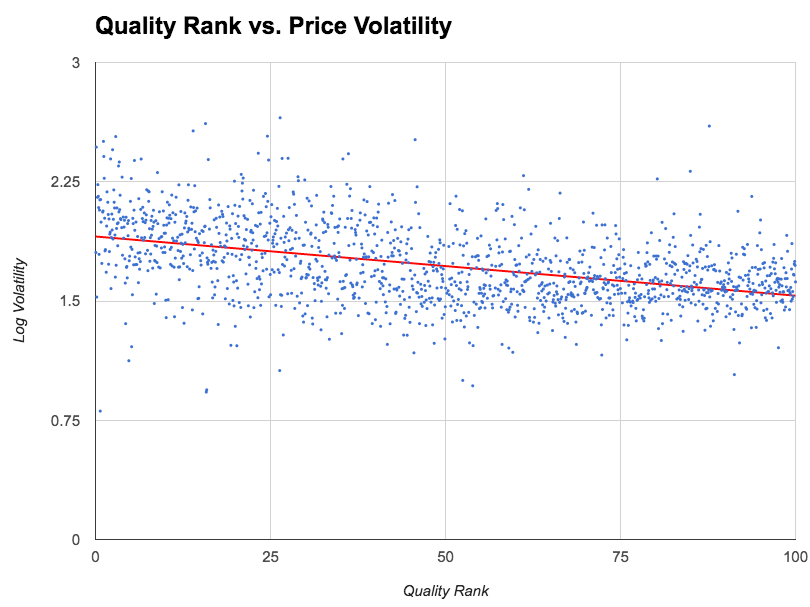
If we dig a bit deeper we find a strong negative correlation between price volatility and company quality. The scatter plot below shows that higher Quality Rank stocks tend to have lower volatility share prices.
And digging even deeper, we get an even more interesting relation between a company’s Bankruptcy Risk to Share Price Volatility. Using the Altman Z-Score (available as a bankruptcy meter on all Stock Reports) we can build a scatter plot against Share Price Volatility.
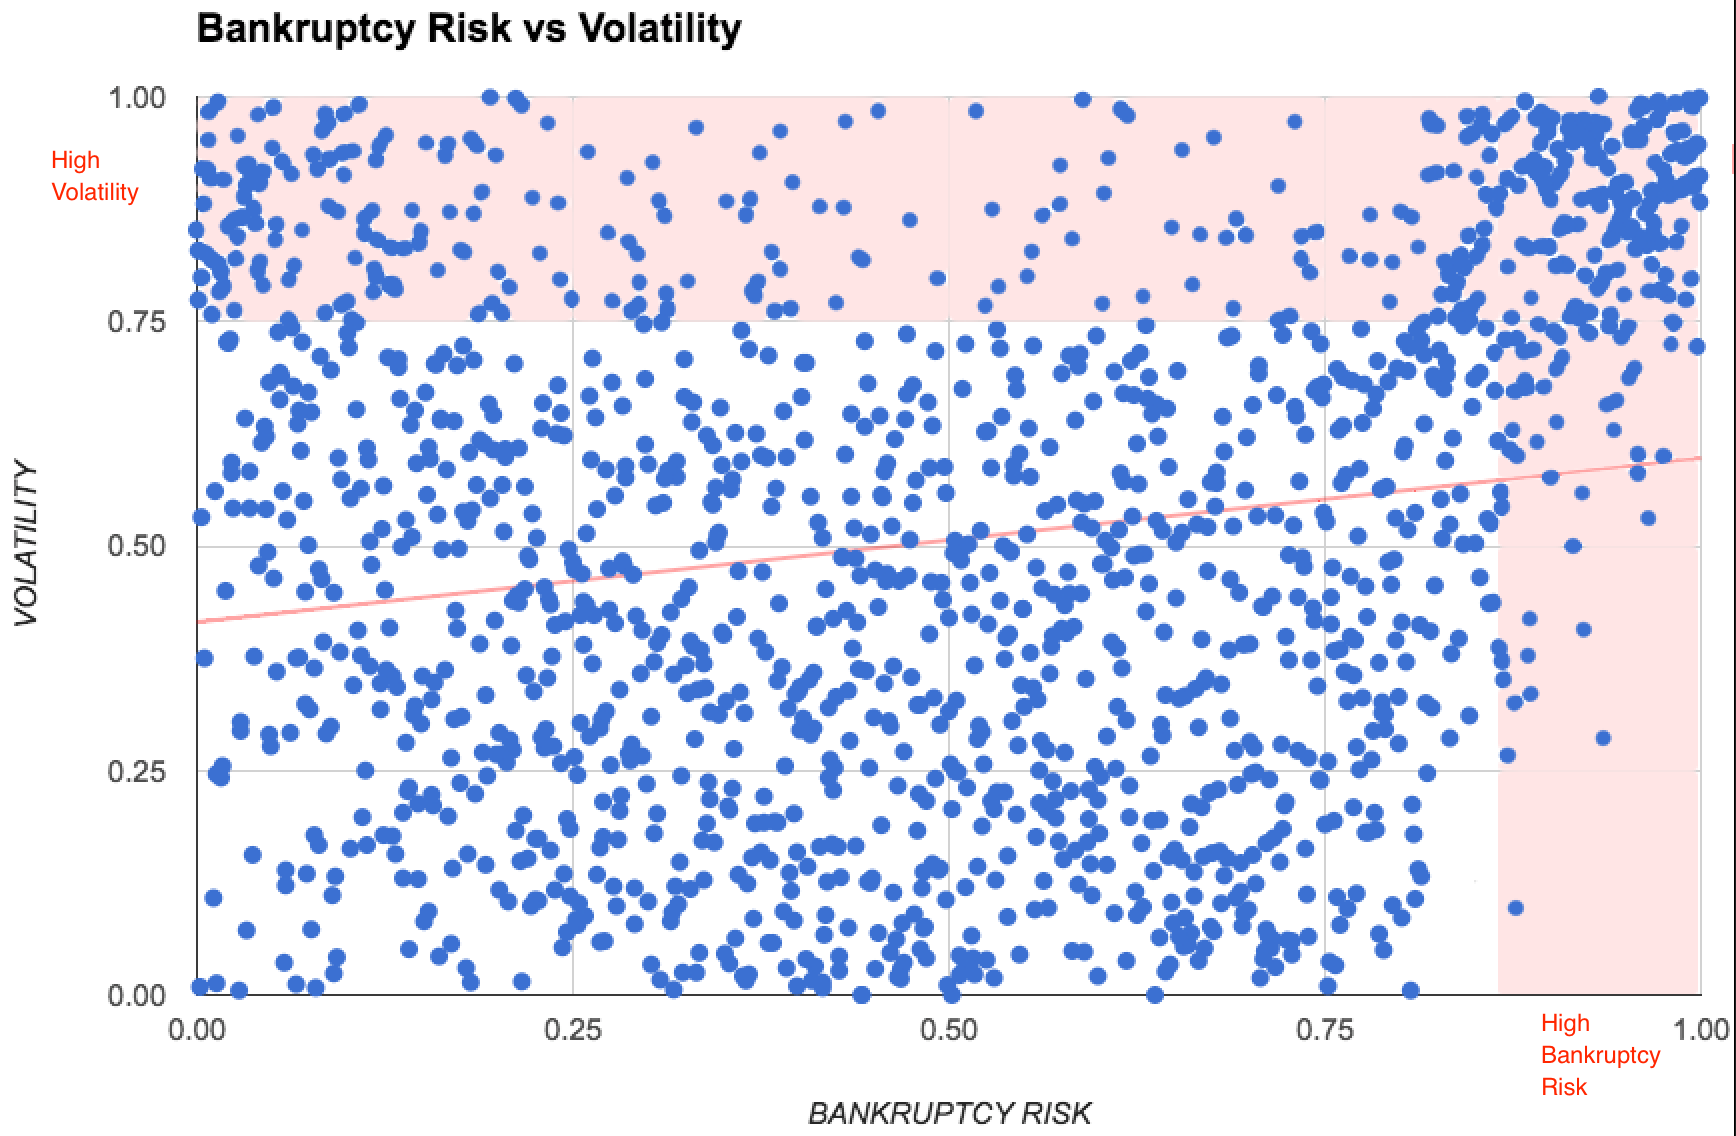
The insight from this chart is that the highest volatility segment of the market is either focused in the highest or the lowest bankruptcy risk segments of the market. It’s clear why high bankruptcy risk stocks should be volatile, but why low bankruptcy risk stocks? The reason is twofold. Firstly a lot of the most speculative investments have binary finances (they are either well financed post-funding or very poorly financed and seeking funding), while a lot of cash generative growth stocks can become very volatile due to investor over-enthusiasm.
RiskRating Product Guide
The RiskRating is available in four core product areas - the StockReports, the Browse Portal, in the Stock Screener and in Table Displays.
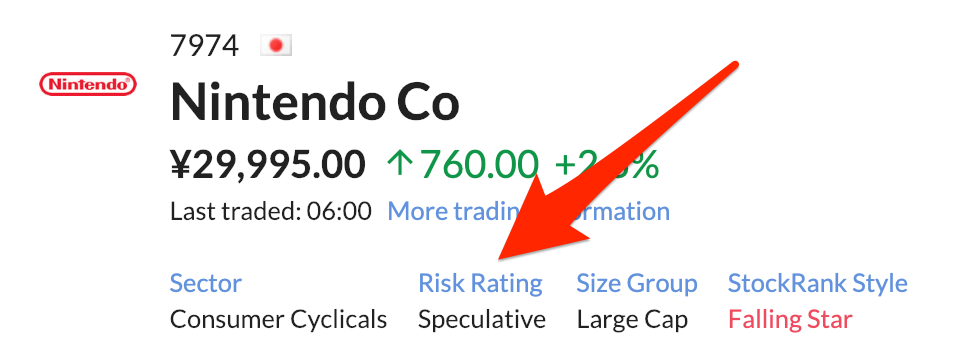
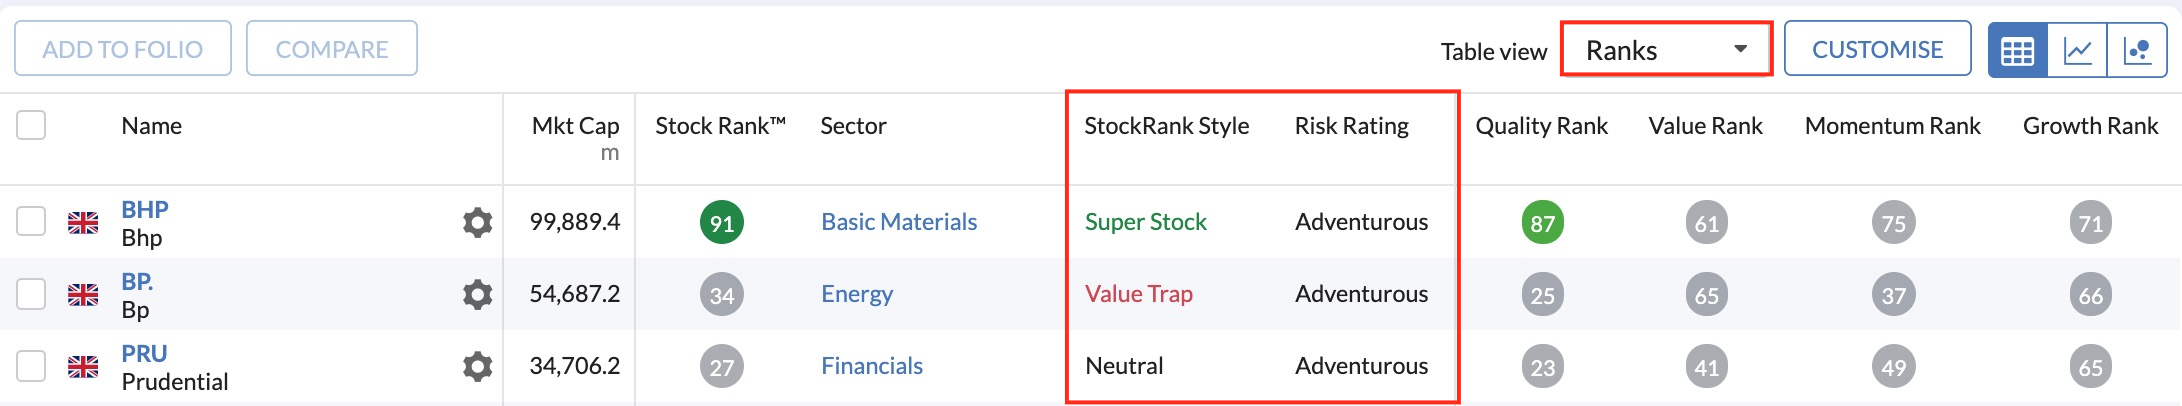
- StockReports: You can find the RiskRating at the top of all StockReports in the Classifications label, alongside the Size Group and StockRank Style. Reading the Classification sentence allows fast insight into the risk and investibility of a stock.
- Browse: You can also filter for various RiskRatings in the Browse portal (on the left of the screen). You can customise results according to your tolerance for market volatility or risk.

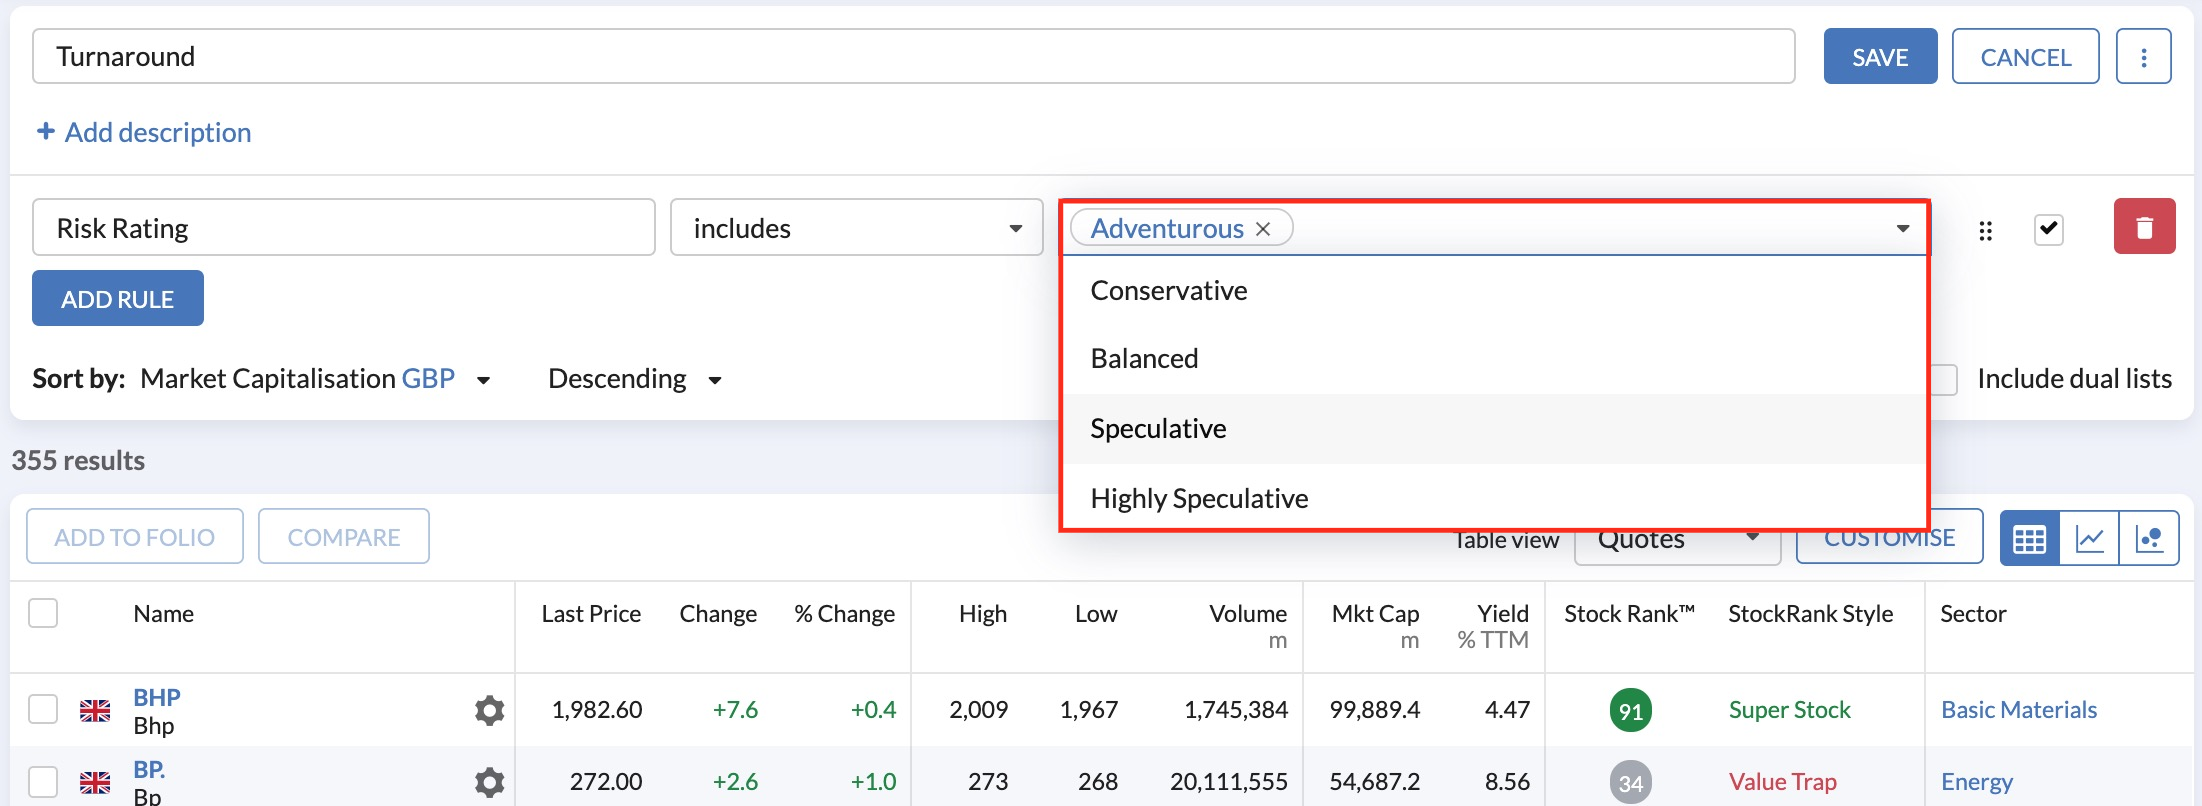
- Stock Screener: For more advanced filtering using the RiskRatings, you can use the Stock Screener. To do this, go to Screens and either open one of your existing screens or start a new screen by clicking New Screen. Next, click the Add Rule button to open the Ratio Picker and then select Profile > RiskRating and click Add Rule to apply it to your screen. You can then adjust the rule (see below) to exclude or include any of the RiskRatings.
- Table Displays: The Risk and Style classifications are available as default in the “Ranks” tab of all tables. If you want to add the RiskRating to any table display, launch the Table Editor by clicking the blue pencil icon in the active table tab. Open the “Profile” folder and select RiskRating from the menu. You will then have it available as a column in your table.
Technical Guide
We use proprietary measures of volatility, which accounts for the fact that some stocks have shorter histories and/or are traded less frequently than others.
Underlying the RiskRating is a proprietary measure of volatility based on the standard deviation of three year daily price returns adjusted for auto-correlation and sample size. If a straightforward standard deviation is used as a measure of volatility, some stocks can appear to be low risk options when in fact the opposite is more often the case. We make two key adjustments to counterbalance this:
- The first is adjusting for sample size. This measures how much price history we have to base our estimate on. We are always conservative and take the upper bound of the measured confidence interval to be the observed volatility.
- The second is autocorrelation. This measures how highly a stock’s returns are correlated with themselves. When scaling observed daily volatility to annual volatility, we make an additional adjustment for the amount of autocorrelation observed. We use the upper bound of the confidence interval for autocorrelation just like we do with the volatility measurement. This is a technique sometimes used in assessing the volatility of Real Estate funds or other assets which aren’t priced as frequently as ordinary shares.
The RiskRatings themselves are based on the annualised adjusted volatility that we compute and split into 5 buckets with proportional weights as follows:
- Conservative - lowest volatility 10% of the market.
- Balanced - the next lowest volatility 15% of the market.
- Adventurous - the next 20% of the market.
- Speculative - the next 25% of the market.
- Highly Speculative - the highest volatility 30% of the market.
The actual volatility underlying these categories can drift over time, but on average Conservative stocks stocks have less than 25% annualised volatility, Balanced stocks less than 35%, Adventurous stocks less than 45%, Speculative stocks are up to 70% annualised volatility, and Highly Speculative are above this level.
Why do we not use “Beta” for our RiskRatings?
The use of Beta has become very popular amongst investors seeking Low Volatility stocks. The Beta is a simple to understand measure of the amount a share’s price movement is correlated with the market returns. Beta is hinged around 1. A beta greater than 1 suggests a share’s price moves up further on up days (and down further on down days) than the market as a whole, while a beta of less than 1 suggests a share’s price moves less than the market’s move up or down.
But if you run an analysis of the Beta of all equities you’ll find something surprising - Almost all equities are Low Beta ! While for large caps there’s almost an equal distribution between high and low beta shares… amongst the rest of the market over 75% of stocks have a Beta of less than 1.
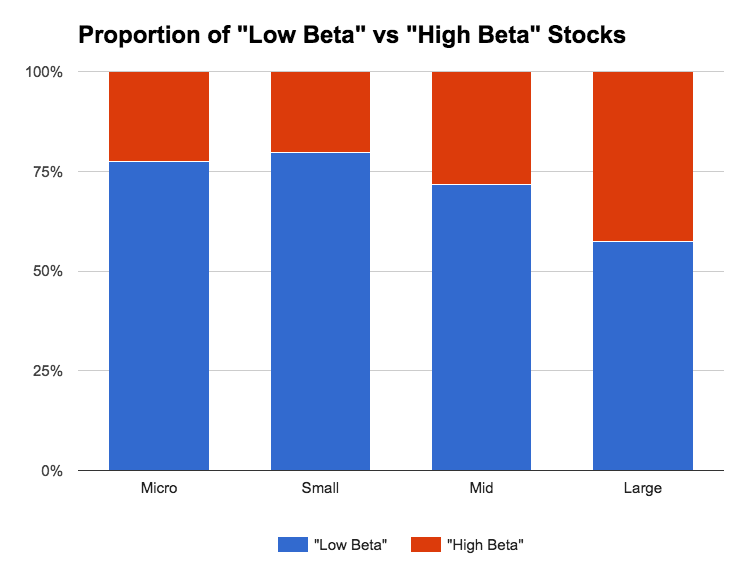
For large cap investors, and ETF providers, using Beta as a portfolio construction technique may be ideal, but it’s a problem for individual investors who like to hunt amongst small caps. The majority of stocks you look at will be “Low Beta” shares. This is obviously not optimal.
The better measure, as well illustrated by van Vliet and Blitz in “The Volatility Effect: Lower Risk without Lower Return” is to use Total Volatility. It is our preferred measure for the RiskRatings.
So if you really want to find low volatility shares, the RiskRatings are a much more optimal measure than the Beta across the breadth of the market.
Conclusion
To conclude, we've designed the RiskRatings to deliver a simple and easy to understand method to assess and access various levels of Risk in listed stocks. We hope you've enjoyed the read, but more importantly, we hope you'll see your stocks and portfolios in a whole new light through the lens of the RiskRating.
For those interested in reading the academic research into the Low Volatility Anomaly, we recommend the following papers for further reading.
- “Low Risk Stocks Outperform within All Observable Markets of the World” by Baker & Haugen.
- “The Volatility Effect: Lower Risk without Lower Return” by Blitz and van Vliet.
- “The Cross Section of Volatility and Expected Returns” by Ang, Hedrick, Xing and Zhang.
- “Betting against Beta” by Frazzini and Pedersen

