Reviewing the StockRanks performance
The StockRank Performance Pages allow subscribers to chart and query the performance record of the StockRanks since their launch across different variations. Our hope is that subscribers will gain confidence in these approaches through the transparency we provide. This page updates the morning after every market trading day (usually Tuesday to Saturday).
The default chart on the page shows a set of lines which track the performance of different buckets of stocks according to their StockRanks. To date the best performing set has been the stocks ranked 90 or more (which is always coloured in the darkest shade of green), while the worst performing set of stocks has been those ranked 10 or less (coloured deep red).
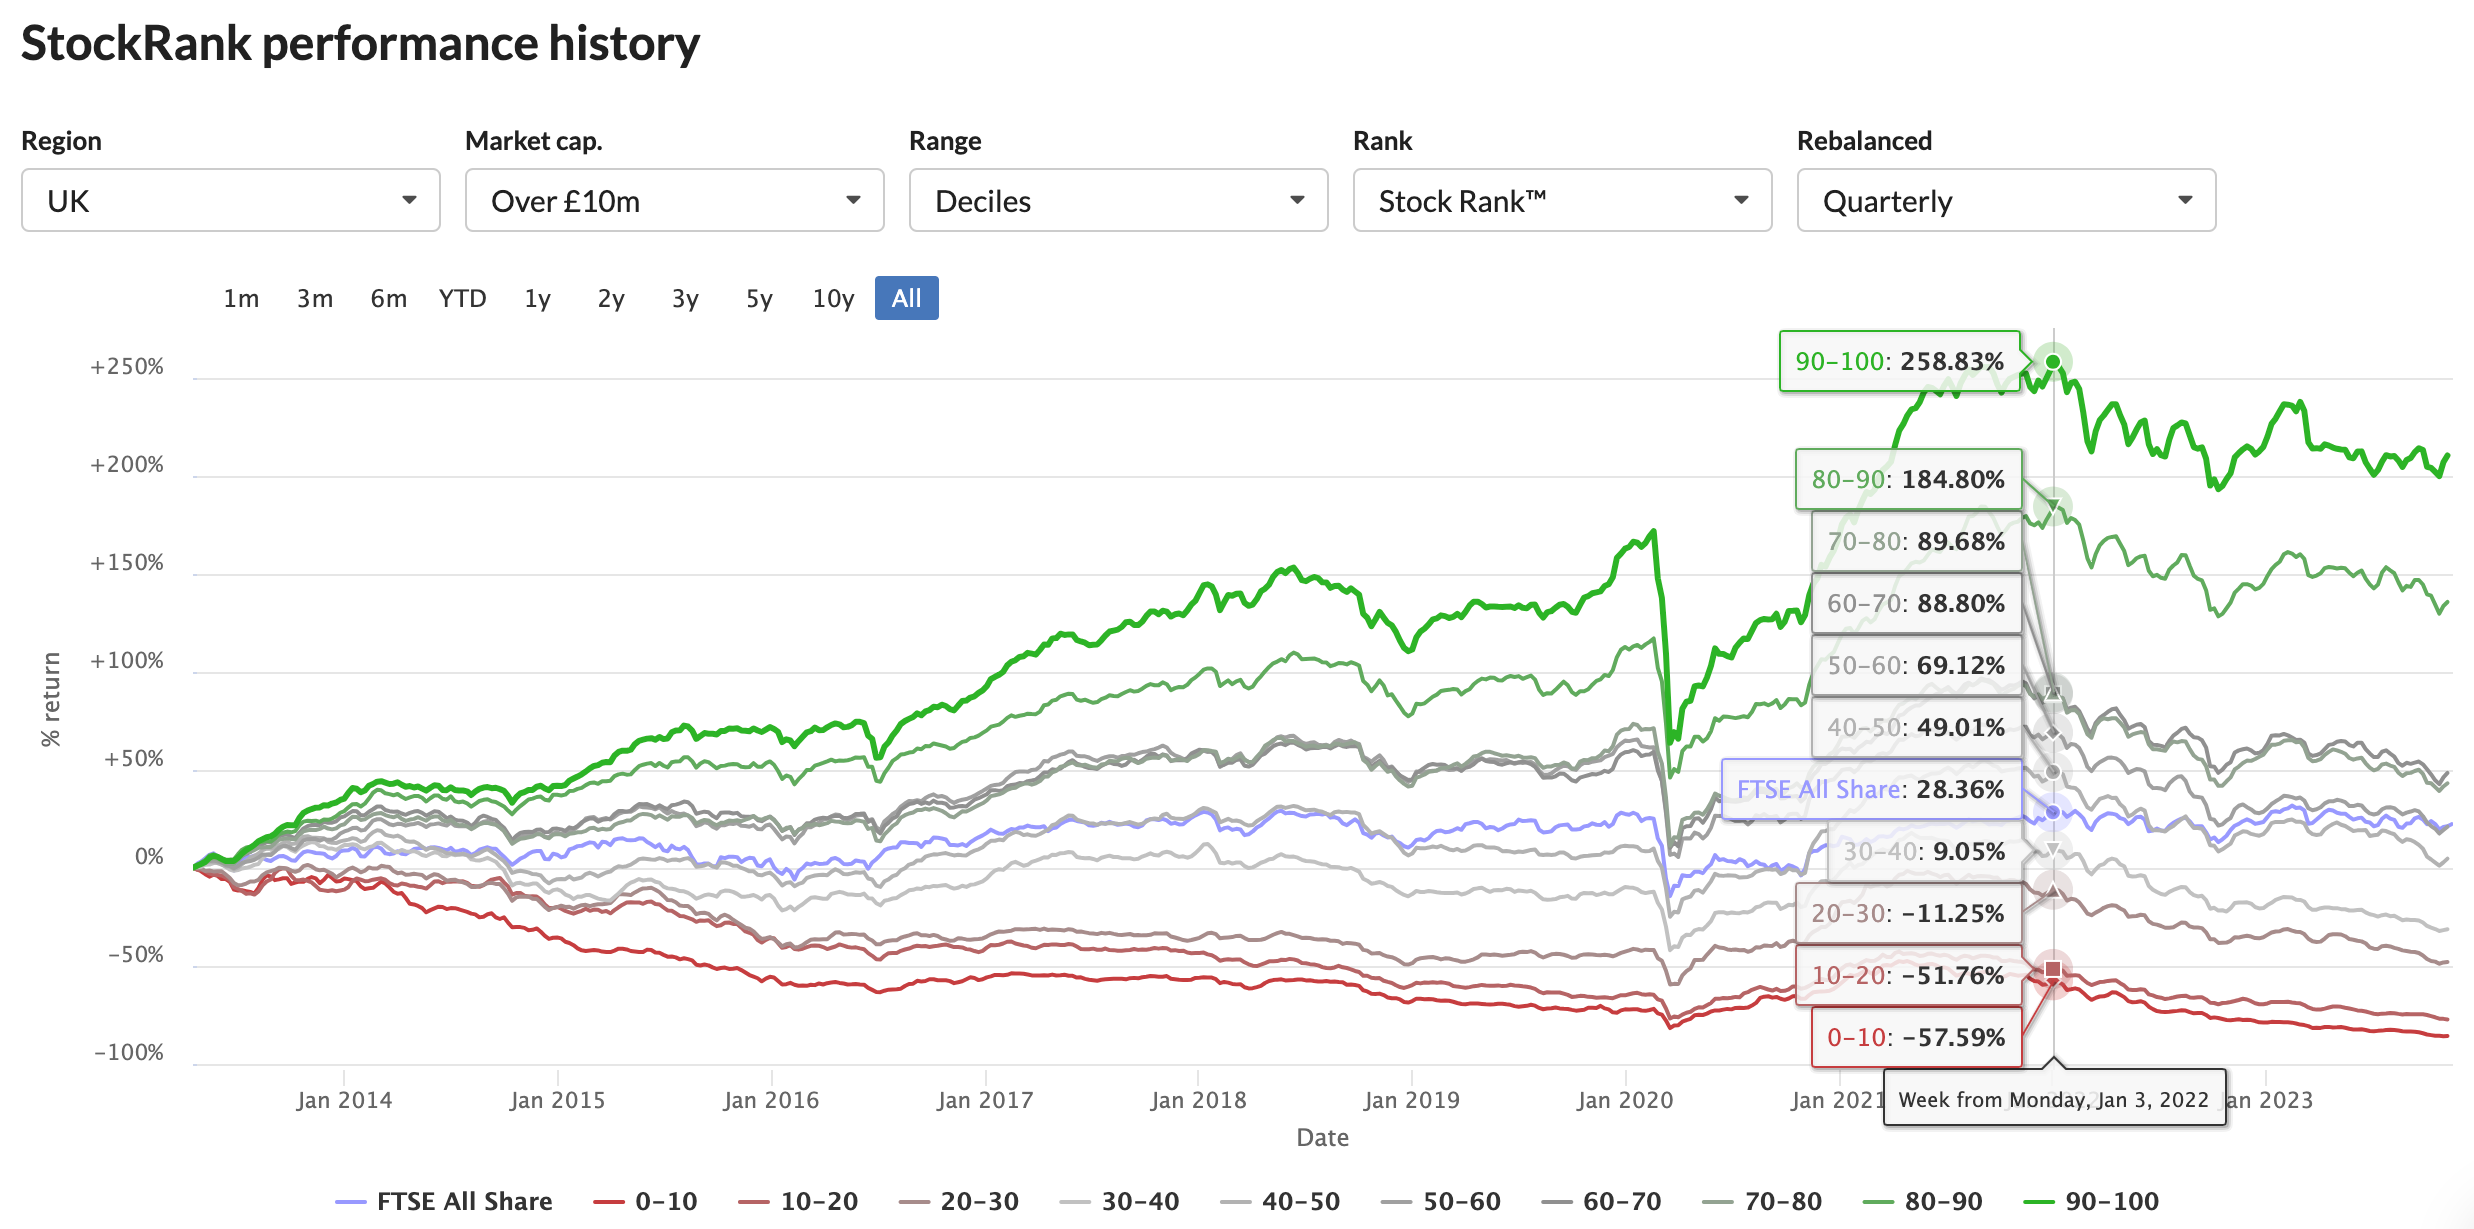
If the StockRanks are performing well, then high ranking stocks should be outperforming low ranking stocks. If this is the case then a broadening ‘spread’ between the green lines (high ranked) and the red lines (low ranked) would be expected.
While the StockRanks since launch have performed well, a broadening spread should not be expected at all times. Every stock market strategy can be expected to go through prolonged periods of underperformance. Caveat emptor!
The blue line on the chart represents the best benchmark for the region in question allowing for easy comparison… the S&P 500 in the USA, FTSEurofirst 300 in Europe and the FTSE All Share in the UK.
Adding Filters
At the top of the chart you’ll see a thin bar of filters which provide deeper drill downs into the data.
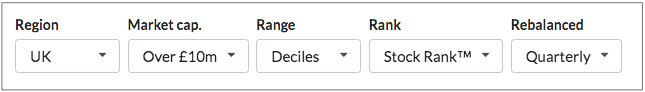
The currently available filters include:
- Region filter - choose the region from US, EU and US
- StockRank filter - choose the QVM, Crossovers or Basic Ranks
- Size filter - investigate different cutoffs of market capitalisation
- Rebalancing period - quarterly, semi-annually or annually
- Bucket breadth - quintiles, deciles or vigintiles
The first three filters should be self explanatory. If you don’t know about the different StockRanks we provide please see the overview in this section. We are, though, often asked for clarification on the rebalancing periods and bucket breadth.
For decile based buckets we split the market into portfolios with cutoffs every StockRank of 10. So the first bucket has a rank of between 0 and 10, then 10-20, 20-30… up to the top ‘decile’ full of stocks ranked between 90 and 100. Quintile portfolios split the market into five groups (0-20, 20-40 etc), while Vigintile groups split the market into twenty groups (0-5,5-10… up to 95-100).
With quarterly rebalancing a set of new portfolios is created every three months. For example the 90-100 portfolio is ‘bought’ and held for 3 months. At the quarterly rebalancing date any stocks that are below the 90 mark are then ‘sold’, while new candidates are ‘bought’. Of the stocks that are still ranked between 90 and 100 the winner positions are pared back, while the loser positions are increased until the whole portfolio is equal weighted.
Technical Details
We try to make these performance results as accurate as possible but it’s important that we state the rules of engagement for these tests:
- Data: To minimise common backtesting biases, we use the actual data that was published on the Stockopedia website at each rebalancing date. All stocks that have delisted are also included in results. We try to make our data archiving as accurate as possible, but data errors can and do occur - please contact us if you see anomalous results.
- Dates: To build portfolios we use data batches as close to the end of each quarter as we have available. As we continue to bring more data batches into the backtester from our archives the performance charts may be liable to change.
- Prices: All portfolios are rebalanced at the next available close price after each data batch publication date. Our studies currently show minor performance differences between the use of open or close prices - we may make the choice configurable in future.
- Costs: We do not include any transaction costs or bid-ask slippage in the calculations - more frequent rebalancing periods may generate better theoretical performance results, but could incur greater transaction costs in real world trading.
- Dividends: Dividend payments are not included in performance calculations - higher ranking quantiles in general have higher average dividend yields so we would expect higher total returns in higher quantiles than published.
- Splits: We are vigilant about finding splits and consolidations - but occasionally they can be missed by our data provider and skew results. If you do see any anomalous charts please contact us using the Green Support Messenger and we will fix.
- Micro-caps: Anomalous share price prints & errors in micro capitalisation stocks can at times skew the results of an entire quantile bucket. We preset our tests at Market caps of > £10m to minimise these issues but please beware in your own tests and notify us of any issues.
- Geometric: We use geometric rate of return calculations.
- Disclaimer: Past performance is not indicative of future returns. Please do your own research & consult professional investment advice when using Stockopedia. Please do refer to the Terms & Conditions when using the Stockopedia website.

