The StockRanks
Every company on Stockopedia is analysed for its Quality, Value, Growth and Momentum across hundreds of fundamental and technical metrics. They all come together in our proprietary set of composite StockRanks, the entry point to the StockReport found in the top right of every page. For many subscribers this is the first thing they eyeball on any stock.
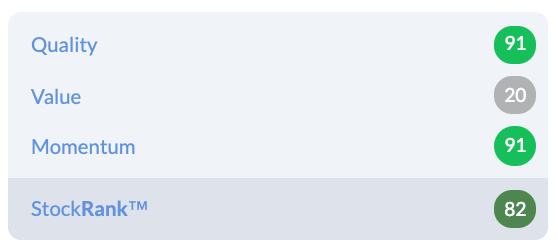
Every stock is ranked from zero (worst) to 100 (best) across each of these axes - Q, V and M. These are then combined into an overall Stockopedia StockRank™ that has regularly beaten the market both in backtests and in our live performance tracking.
Reading the Ranks
We have extensive learning resources about each of these rankings in this section, but to understand them in brief:
Quality Rank - ’good stocks beat junk stocks’.
High scoring stocks by this measure will be profitable, cash generative, high margin, low debt businesses that rarely issue shares. Low scoring stocks will be speculative, cash consuming companies that often disappoint. Q: Why do good stocks outperform? A: They tend to be boring businesses, and most investors shun them as they prefer excitement - but paying for excitement tends to prove expensive.
Value Rank - ’cheap stocks beat expensive stocks’.
High scoring stocks will be cheap on a range of measures versus what they own and what they earn and often out of favour with investors. Low scoring stocks will be expensive and often adored by the market. Q: Why do cheap stocks outperform? A: Cheap stocks often have problems, and most investors shun them as they prefer the safety of consensus - but consensus rarely pays.
Momentum Rank - ’winning stocks beat losing stocks’.
High scoring stocks will have rising share prices, often at new highs, with brokers increasing their earnings estimates. Low scoring stocks will be trading at lows with brokers cutting their numbers. Q: Why do winning stocks outperform? A: Stocks at new highs are hard psychologically to buy, so most investors shun them, preferring the purchase of ‘bargains’ at lows - but trend following works.
QVM StockRank - good, cheap, improving stocks beat expensive, deteriorating junk.
This measure equally blends the Quality, Value and Momentum ranks into our core metric - the StockRank.
We recommend learning as much as possible about these incredibly useful statistics in this section.
The StockRank Deltas
It’s always useful to know in which direction each of the StockRanks is moving. In the StockRank widget, next to each of the ranks there appear the occasional green or red 'arrow' showing the latest movement of the rank, up or down.
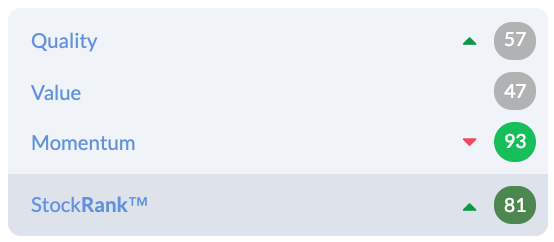
We call these the “StockRank Deltas” and in order not to overwhelm we've set this feature to only print on the page if the rank has moved by plus or minus 5 over the last 30 days. This gives a good indication of recent StockRank movement without being too noisy. You can hover over the arrow and see by how much the StockRank has changed over that time frame.
The picture above illustrates neatly how Value and Momentum can move in opposite directions at the same time without impacting the overall StockRank. The stock in question has got 'cheaper' (so the Value Rank has improved) but the stock has plunged to newer lows on the oil price collapse (so the Momentum Rank has fallen).

