Reviewing quality & identifying red flags
Warren Buffett has been quoted as saying that every time a great manager takes on the challenge of a company with a reputation of bad economics, it is the reputation of the company that will remain intact.
A great company with an 'economic moat' will generate high internal profitability. We use the return on equity, return on capital employed and operating margin to analyse this. A good rule of thumb is to look for companies with internal returns (ROE/ROCE) of over 15%. Margins differ in each sector, but great companies have the best margins in their sector.
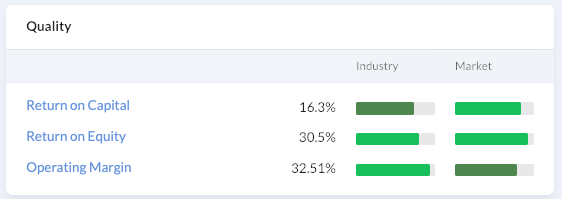
Its very important to look at the consistency of ROCE and ROE by referring to the financial summary section. Does the company have a chequered history, or is it a cash machine with year after year of strong returns? The operating margins are included to show how well each company can turn a consistent profit on their operations.
Companies with a strong moat can maintain pricing power versus their competitors and show consistently high profit margins versus their peer group.
Financial Health
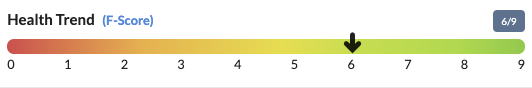
The Financial Health trend meter is based on the Piotroski F-Score, a 9 point scoring system that analyses the trend in a company's accounts across a set of tests that cover profitability, leverage, liquidity, sources of funds and efficiency. Piotroski showed that stocks scoring 8 or 9 significantly outperformed stocks scoring 1 or 2. It is a good shorthand for deeper financial analysis and the popover on click gives a breakdown of how the score is compiled, quickly highlighting red flag areas. More recent studies have shown that focusing on high F-Score stocks can reduce the volatility of returns in a value portfolio.
- Popup Checklist - click the link to generate a checklist for the 9 points that Piotroski covers. Quickly assess the weaknesses in a company's accounts.
Bankruptcy Risk
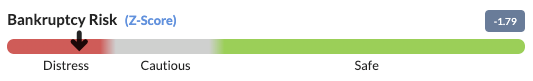
In the 1970s Professor Altman created a statistical measure called the Z-Score which he showed predicted to a 75% accuracy the probability that a company would experience significant financial distress within 2 years of the score flashing 'in the distress zone'. Our visual interpretation of the Z Score gives a quick indication of the company's general financial risk.
- Popup Breakdown - click the link to generate a breakdown of the Altman calculation. Strictly for the Finance Geeks out there!
Earnings Manipulation Risk

Professor Beneish created the M-Score to highlight companies that may be massaging their earnings figures for reporting purposes. Many companies can increase their reported earnings by booking sales early, delaying expense recognition, capitalising expenses and other tricks of the trade. Most of these tricks aren't illegal, but regular practice can signify a company that may be getting into bad habits. The M Score predicted such high profile failures as Enron and has even been shown to be useful as a short selling technique.
References
- Jegadeesh & Titman, "Returns to Buying Winners and Selling Losers, Journal of Finance 1993
- George & Hwang The 52 Week High and Momentum Investing, Journal of Finance 2004
- Curtis Faith The Way of the Turtle, McGraw-Hill 2007
- Dreman Overreaction, Underreaction, and the Low-P/E Effect, Financial Analysts Journal 2005
- Fama & French The Cross Section of Expected Stock Returns, Journal of Finance 1992.
- Kenneth Fisher, Super Stocks, McGraw Hill.

