Reviewing valuation & growth potential
The first TrafficLight section displays some key financial metrics based on forecast growth ratios (where available) and some based on historic accounting data. These provide a quick fix on whether a company is fully, fairly or fatally valued against its peer group and the market as a whole. Let’s take a closer look.
Forecast Growth & Value

There’s a challenge in presenting consistent forecast data on StockReports when companies report their financial year ends on different dates. Imagine a company is reporting results next week. If it has the same earnings per share forecast as a company reporting results in 11 months time then it would be valued the same forecast PE Ratio. This could cause an investor to favour one share over the other, when one or the other may be much more expensive in 11 months time !
Introducing Rolling Ratios - we’ve solved this by creating rolling 1 year forecast earnings per share figures which weight this year and next year's earnings forecasts depending on how far a company is through in its fiscal year. This puts every single company in the market on a comparable, 12 month forecast footing, allowing a like for like comparison across forecast valuation, growth and dividend variables.*
The 1 year rolling growth outlook contains several ratios all based on this 1 year rolling forecast dividend and eps outlook. All the following ratios are accompanies by a pair of 'traffic light' indicators showing in colour how each ratio compares against:
- the company's industry peer group.
- the market as a whole.
Please read the TrafficLights™ article in the previous section for more information. Each of the ratios is clickable on the StockReport for a more full explanation, but here’s a brief introduction:
PE Ratio
Much maligned by many as an incomplete ratio in comparison to EV/EBIT, it nonetheless is the most accepted valuation ratio by many investors. If forecasts are available, we publish a standardised forecast PE Ratio based on the current price divided by the 1 year rolling forecast earnings forecast. If forecasts are unavailable we publish the trailing twelve months PE Ratio. Low PE stocks have been shown to outperform high PE stocks in the long term, but many investors today are willing to pay a premium for quality, and some strategies that have proven exceptionally profitable such as CANSLIM have no limit on the PE Ratio if accompanies by very strong earnings growth.
PEG Ratio
This is the current PE ratio divided by the 1 year rolling EPS Growth forecast. The PEG Ratio was popularised by Peter Lynch and Jim Slater and shows how much you must pay for each unit of earnings growth. It is generally accepted that a PEG ratio of under 1 signifies growth at a reasonable price (e.g. PE ratio 20 for EPS growth of 20%). Some investors such as Jim Slater prefer looking for PEGs of less than 0.75 - i.e. paying less.
EPS Growth
This shows the 1 year rolling forecast growth rate. One of the key contributing factors to stock price appreciation is the forecast rate of earnings growth. Accelerating earnings growth and broker forecast upgrades have also been cited by many investment experts such as Bill O'Neil as critical factors in their investment models. This figure should be viewed in tandem with historic EPS Growth in the financial summary section and the trend in forecast data in the broker section.
Dividend Yield
This shows the expected dividend yield in 12 months time if the broker's consensus is correct. It is important when buying a stock for income that the financial health and dividend history is considered. A high yield can sometimes be an indicator that a company is in financial trouble. The dividend history, dividend cover, financial health and bankruptcy risk indicators should all be considered when buying for income.
* NB - If forecasts are unavailable these metrics revert back to the Trailing Twelve Month versions of the fields - so do check the label at the top of this section to confirm forecasts are available.
Historic Value
While growth investors like to look to the future, value investors like to look to the past. Using the rear-view mirror of historic earnings*, we publish four key ratios for value investors which are explained below.
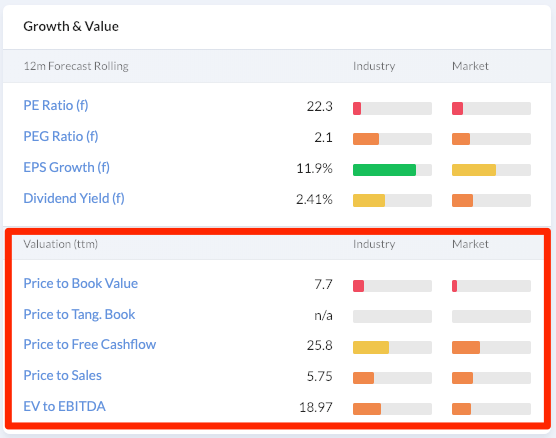
Price to Book Value. The book value of a company is its net worth or common equity. It is what is left over when everything that is owed to creditors and lenders is paid off. Low Price to Book Value (PBV) companies have been shown to outperform the market in aggregate by 36bps per month.Companies can have a large amount of intangible assets on the balance sheet which are occasionally written off (e.g. due to overpaying for acquisitions etc), as a result we also show the Price to Tangible Book (i.e. subtracting intangibles to provide a more conservative view of value).
Price to Sales. Kenneth Fisher popularised the Price to Sales ratio in the 1980s in the book Super Stocks and it was called the 'King of the Value Ratios' by Jim O'Shaugnessy. While it was misused during the Tech bubble, Fisher used it to show how to buy stocks that temporarily had no earnings which would be missed by traditional PE Ratio searches. Low Price to Sales Ratio stocks, especially compared against their sector, can often be stocks that bounce back very quickly as they return to profitability.
Price to Free Cashflow. The price-to-free cash flow ratio (P/FCF) compares a company's current share price to its per-share free cash flow. Free Cash Flow is calculated from the Statement of Cash Flows as Cash From Operations minus Capital Expenditures and is the amount left over which a company can use to pay down debt, distribute as dividends, or reinvest to grow the business.
EV/EBITDA. A ratio much favoured by City analysts and private equity predators. It compares the Enterprise Value (i.e. the market value of shares plus the net debt of the company) to the cashflow figure proxy of EBITDA (earnings adding back interest, tax and non cash expenses like depreciation and amortisation). However, some sceptics might say that a company that has to resort to quoting EBITDA numbers in its financial results may not be making any money at all.
* NB - we use Trailing Twelve Month data as standard on the site for historic ratios. This is true on StockReports and on the Screener. It provides far better timeliness for investors than historic data. To learn more please read the data guide.

