Spotting strong or weak momentum
Ever since the 1980s, when the now infamous Turtle Traders beat the market with some simple strategies based on breakouts to new high prices, momentum investing has been shown to be a very profitable strategy. In fact many academics now agree that ‘momentum’ is a more powerful driver of returns in financial assets than ‘value’.

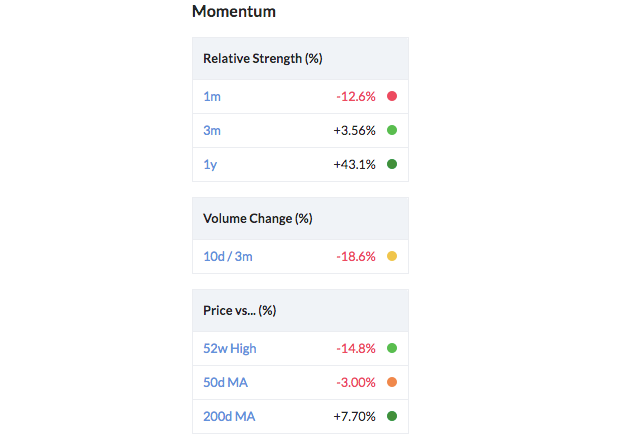
We provide a set of simple yet powerful metrics to interpret share price momentum along with their associated TrafficLights™ to help interpret their meaning.
Relative Strength
Relative Strength is defined as the share price performance versus the market index. Stocks with 3 to 12 month relative strength (vs. the market) above zero have been shown in many studies to continue their outperformance by several percent over the following year. 1 month relative strength has actually been shown to be less reliable as a predictor (even inversely correlated with subsequent performance) but it is still closely watched. Each indicator flashes green when it is above zero.
Volume Trend
The big institutional funds cannot trade in and out of a stock without leaving their footprints, and learning to read the signs in daily and weekly volume is important. If current volumes are higher than previous volumes while price is increasing, it may be a sign of fund accumulation hence the indicator flashes green.
Price vs 12 Month High
Academic research and many successful trading strategies have shown that stocks breaking out to new highs have a tendency to outperform the market. This indicator flashes green when stocks are within 10% of their 12 month high.
Price vs 50 and 200 day Moving Averages
The Moving Average we compare against is the average of the last n days closing prices. Some successful momentum trading strategies buy stocks that are trading above their 50 and 200 day moving averages, and many investors will not buy stocks that trade below them. These indicators flash green when a stock is trading positively and above these moving averages.
Measuring and calculating Relative Strength
Relative Strength measures a stock's price change over the last X months relative to the price change of a market index. It shows the relative outperformance or underperformance of the stock in that timeframe.
This value is sourced from Refinitiv. It is calculated dividing the price change of a stock by the price change of the index for the same time period. e.g. A stock falling by 20% versus an index rising 20% would lead to a Relative strength calculation of 100 * ( 80/120 - 1) = -33%
For relative strength calculation, the benchmark index used is the main index of the particular country. The Benchmark index used for UK companies is the FTSE All Share Index. You can read more on Relative Strength calculations in the Prices section of the Technical Guide.

