Compare a stock against its peer group
With the Compare Stocks tool you can easily compare a number of companies across a wide range of fundamental and technical measures. This is a great way to come to a quick conclusion about their relative strengths and weaknesses.
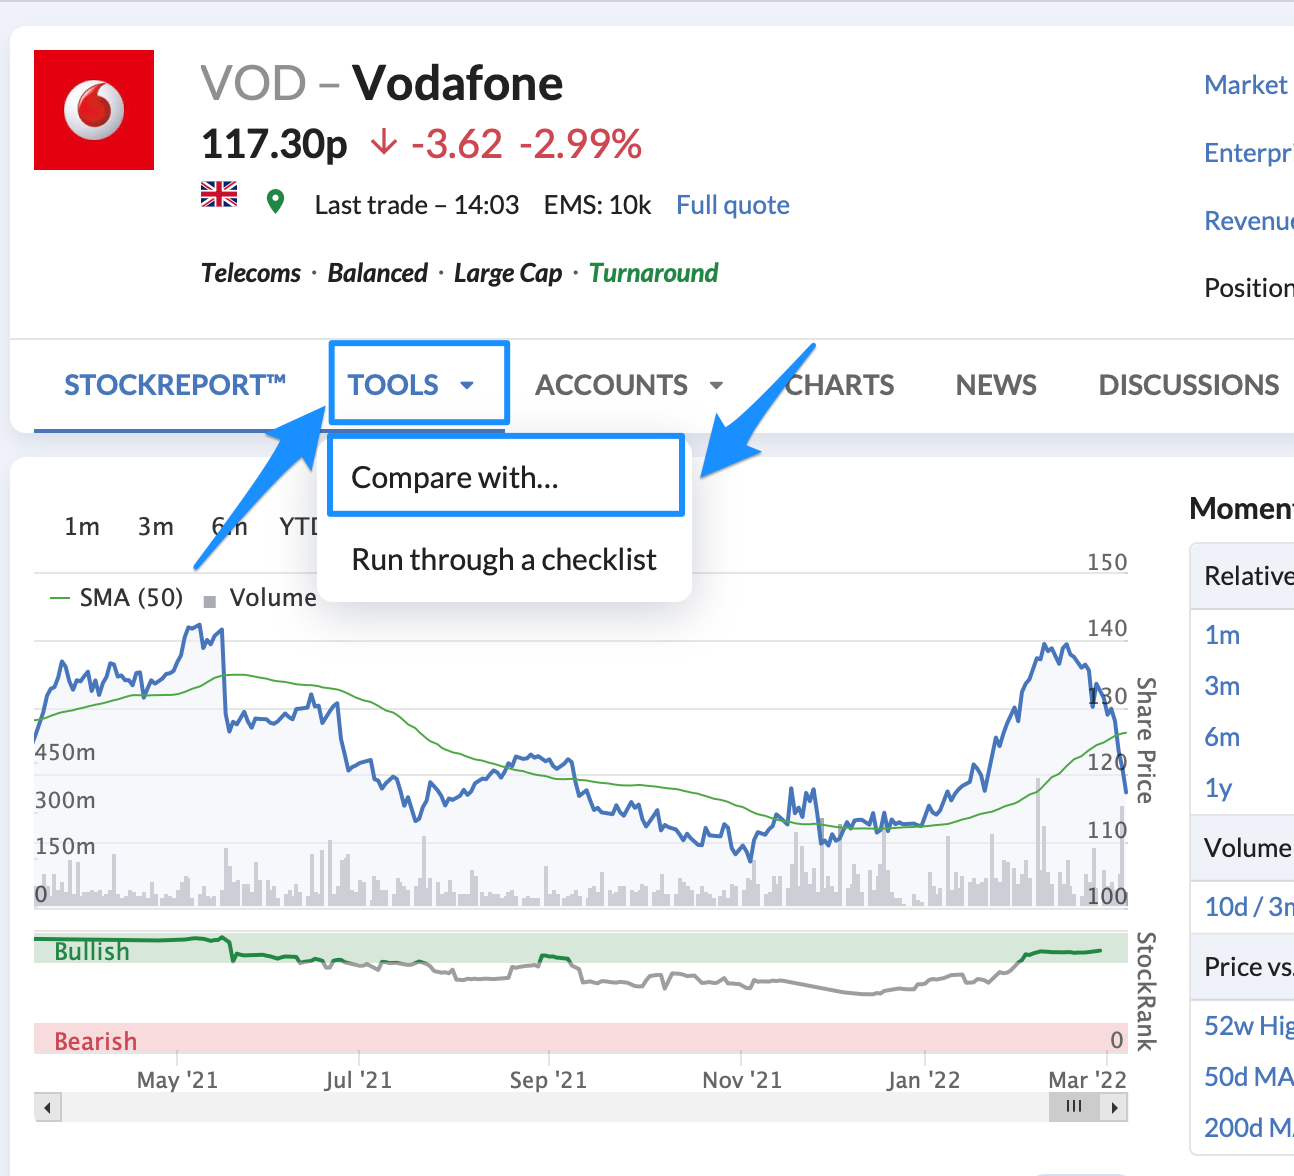
The Compare Tool can be run from any individual Stock Report. Simply hover over the Tools tab above the price chart and click Compared with....
You can also launch the tool from any table or portfolio view on the website. Simply tick the boxes next to the stocks you want to analyse and a Compare button will appear. Click it to load those stocks into the Compare tool.

Adding stocks to the comparison
Once loaded, the Compare Stocks tool allows you to compare different companies. You can add further shares to your comparison in one of two ways.
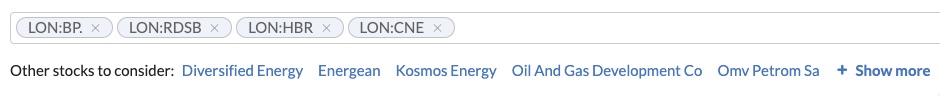
Firstly, you can use the input form box at the top of the page. Enter a company name or ticker and select it from the drop-down list.
Secondly, we provide a few suggestions from the company’s sector which can be added selecting their names.
Analysing the results
The results are presented in vertical columns on the page with a single stock in each column. Each row contains a vital fundamental or technical metric. Across each row for each metric the value for each company is displayed. As a helping hand, we automatically flag which company achieves the “best” value for each of the measures in the comparison.
NB - “Best” in this scenario means fastest growth, cheapest valuation, highest profitability or best performing share price.
We show the best value from the peers by highlighting it in green. The stock which wins on the most number of metrics is also highlighted at the top.
In the example below, the second stock in the list is the cheapest based on P/E Rolling, however the first stock has a better Yield.
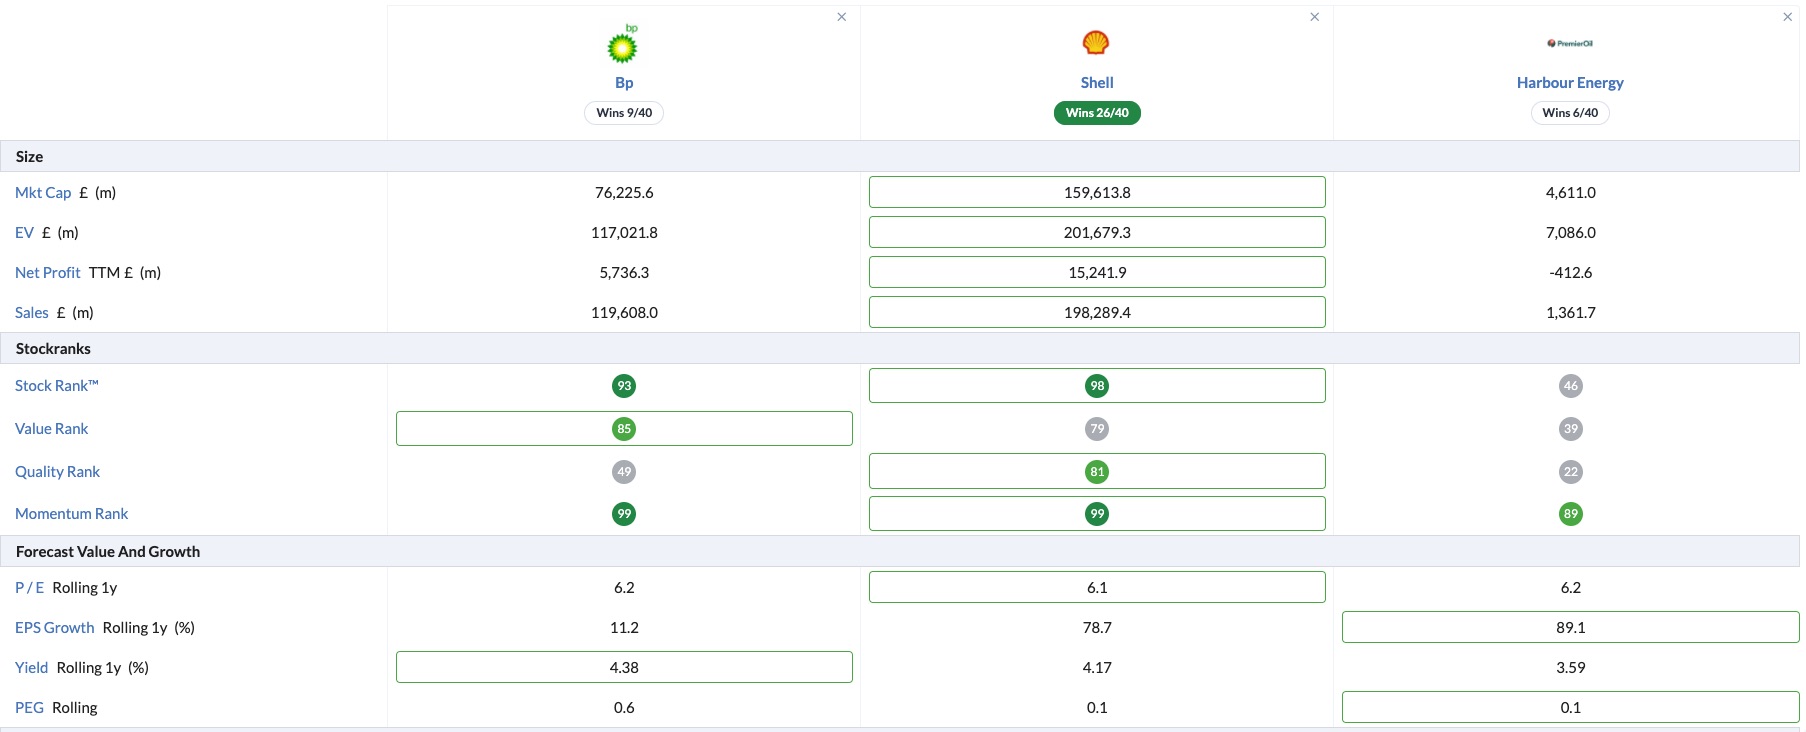
In the left column we split fundamental and technical ratios into intuitive groups across size, value, quality and momentum.
If you don’t understand a metric or ratio you can of course click the name and a helpful popup definition from the glossary will appear.
FAQ: In some cases, why are the sum of the numerators greater than the denominator value?
This will occur where stocks have a 'draw' for a given number of metrics. In this case each drawing stock is awarded the 'point' for that ratio.
Removing stocks
If you want to remove stocks, simply click the cross next to the company name.

Similar companies
At the bottom of the StockReport you'll find a list of similar companies to the stock you are looking at. This peer group is generated according to your investment universe, making it a great way to find new research opportunities.


