One of the most important requirements of anyone investing in the stock market is to have an accurate view of how their portfolio is performing.
As part of the latest improvements to our folio tools we've introduced powerful and hugely useful new time-weighted return performance view that shows you exactly how your portfolio is doing. These charts automatically adjust your returns for the impact of cash inflows and outflows over time - giving you a true reflection of your underlying investment performance.
A new performance chart that isn't distorted by cash
Calculating portfolio performance over time should, in theory, be as simple as comparing the start value to the end value. But for that calculation to be right, you'd need to invest a single pot of money and then leave it untouched. But that's not what most investors do...
More typically, cash tends to be added periodically to build positions and buy new ones, and may be withdrawn occasionally for any number of reasons.
The problem is that these deposits and withdrawals change the absolute value of your portfolio and make it impossible to directly compare the start and end values. That makes it difficult to appraise your investment decisions and rate your performance against a benchmark or the returns of other investors.
Until now, Stockopedia's valuation charts haven't done a good enough job of reflecting the true nature of a portfolio’s performance. By depositing or withdrawing cash after the portfolio start date, the chart would spike upwards or downwards - which was very frustrating.
Just take a look at the valuation chart of the Stockopedia Investment Club over the past year or so to see the impact. Cash inflows have skewed the real performance. As much as we're striving to beat the market, we're nowhere near 300% up.
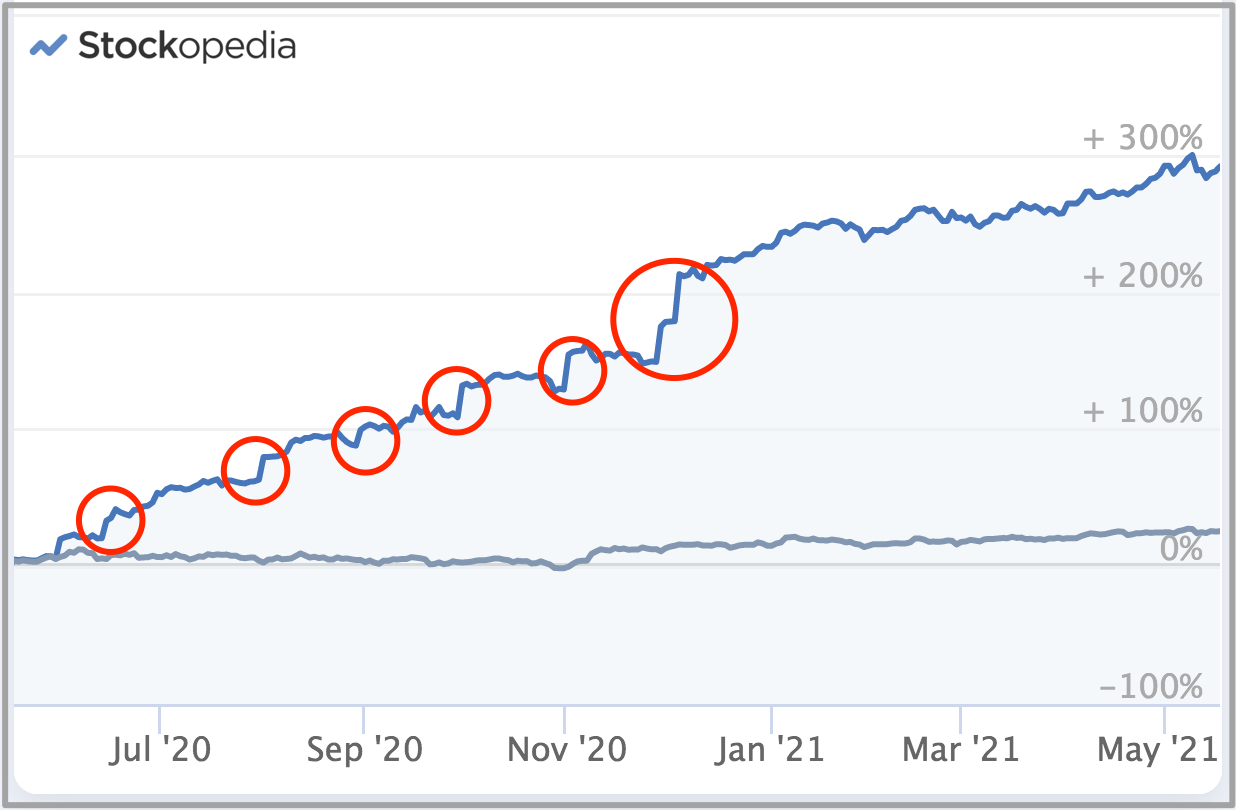
The portfolio valuation has climbed because of regular cash deposits, and not because of our superior stock picking abilities. This is where the new time-weighted return performance charts solve some real headaches that we know have been troubling our users, as well as us.
Professional-grade performance calculations over any timeframe
In order to produce an accurate performance chart, the new system uses an industry standard time-weighted return methodology. It's this that means you can now fairly compare your investment performance over any timeframe against benchmarks and fund managers. Here's how it all works...
For each day in your portfolio's history we do the following calculation:
Today's Valuation/(Yesterday's Valuation + Today's Net User_Cashflows)*
*User_Cashflows = Deposit (positive) or Withdrawal (negative)
Doing this throughout the history creates a geometric series, which means that we can then compare the return between any two dates over the period.
While this calculation is fairly simple, arriving at an accurate return figure means being very rigorous about recording valuations and cashflows. In order to link the geometric series, a record needs to be made of the portfolio valuation both before and after every single cash deposit and withdrawal.
This challenge means that calculating a genuine time-weighted return can be time-consuming for the investor and very computationally demanding . That's why many investing platforms use sub-optimal approaches to try and achieve it. For example, some compare the portfolio valuation to the total cost basis over time, but that approach is not cashflow-agnostic, which means performance can change when adding positions. Others try to simplify the calculation by estimating the return based on average capital over time. Again, that approach can struggle with portfolios where there are large cash inflows and outflows over time. By contrast, we constructed the Stockopedia portfolio system knowing that time-weighted return charts would eventually be part of the functionality.
An easy-button to transform how you see your portfolio
To take advantage of this new feature, just click the "Performance" button on your folio return chart to see the new time-weighted return view. The only requirement is to ensure that cash movements are recorded in your portfolio transactions. This is essential for us to be able to make the calculations. But even if you haven't got the precise records, the new performance chart will do the maths for you by suggesting a "starting cash deposit".
Obviously, the more detailed you are with recording cash inflows and outflows, the more accurate the performance chart will be. But even by using the suggested "starting cash deposit" you'll instantly have a much more accurate view of your underlying portfolio performance.
The new performance charts are now available in portfolios (alongside the regular valuation charts). Just click the "Performance" button on your folio return chart to see it. If you haven't yet created a portfolio, please see our guide for further details on getting started.
See total dividend returns on a stock-by-stock basis
In addition to the new time-weighted return charts, we have also made improvements to the way dividends are shown in portfolios. Specifically, we have introduced a new table column that shows the total dividends received for each stock in a portfolio. That means you can see precisely which holding are contributing to your overall dividend income in a portfolio.
Dividends can have a significant impact on the returns of each stock within a portfolio, especially for investors using an income strategy. Total dividends received in aggregate for a portfolio has always been shown on the Portfolio Overview page, but it wasn't shown on a per position basis. This improvement provides very welcome detail about the income being generated by each holding.
To take advantage of this new feature, you can use the Table Editor to add the 'Dividend Gain' field as a table column on your Portfolio Overview page. You can add the field by customising you portfolios tables, as outlined here.