It has been a year since Stockopedia introduced the new-look, mobile-friendly platform that's now being used by the majority of our subscribers. In that time we have been working on multiple fronts to keep adding the features we know our community wants, as well as lay the groundwork for more to come.
We've always been proactive in asking users about the features and issues that are most important to them. We've listened very carefully to that feedback, prioritised it and we're continuing to work through it.
In terms of site improvements, there have been some important updates in recent weeks and we've got a very full schedule of work. We're set to release data and functionality improvements right across Stockopedia in the months ahead.
Meanwhile there are also some slightly longer-term projects on the go. One of those is site speed and performance, which is now integrated into every area of product development. Advancements here have already been shipped but it's a long haul. Better visibility and benchmarking have meant that our designers and developers have been able to make strong improvements, but there will be more to come.
In the near future we'll also have news of a transformative new data system and a pipeline of new data products that will make the Stockopedia toolbox even better.
Mobile Stock Reports - all the data you need, wherever you are
Our focus in recent weeks has been on making improvements to Stockopedia's mobile services. One of the big changes here is that Stock Reports - our most popular feature among subscribers - are now fully accessible on mobile devices.
Stock Reports presented a big challenge to our designers. With so much financial data on one page, deciding what to deliver, where and how, is hard enough on a regular laptop or computer screen. With tablets and mobile phones it's an even tougher problem. After extensive discussions (which included a number of subscribers) and weeks of design iterations and development we've finally got the full Stock Report experience on mobile.
Some of the changes you'll see include action buttons (for features like Notes and Alerts) that automatically adjust their size and position depending on the screen size. Likewise, Financial Summaries, with data coverage going back six years-plus, are now scrollable and have sticky headers - so you can browse all of this information effortlessly.
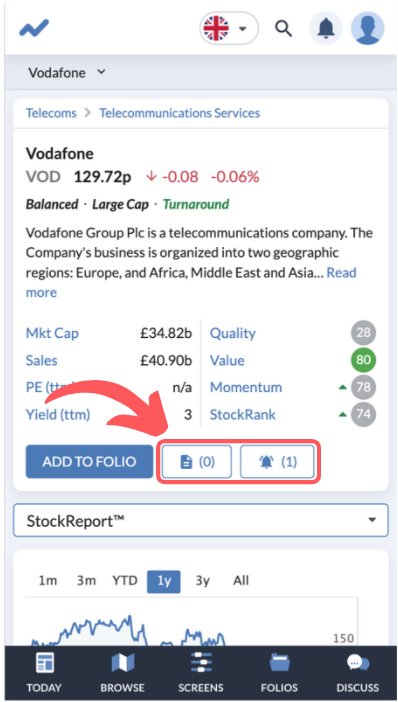
Overall, StockReports are now a joy to use on mobile devices - giving you the full power of Stockopedia's company analysis wherever you are.
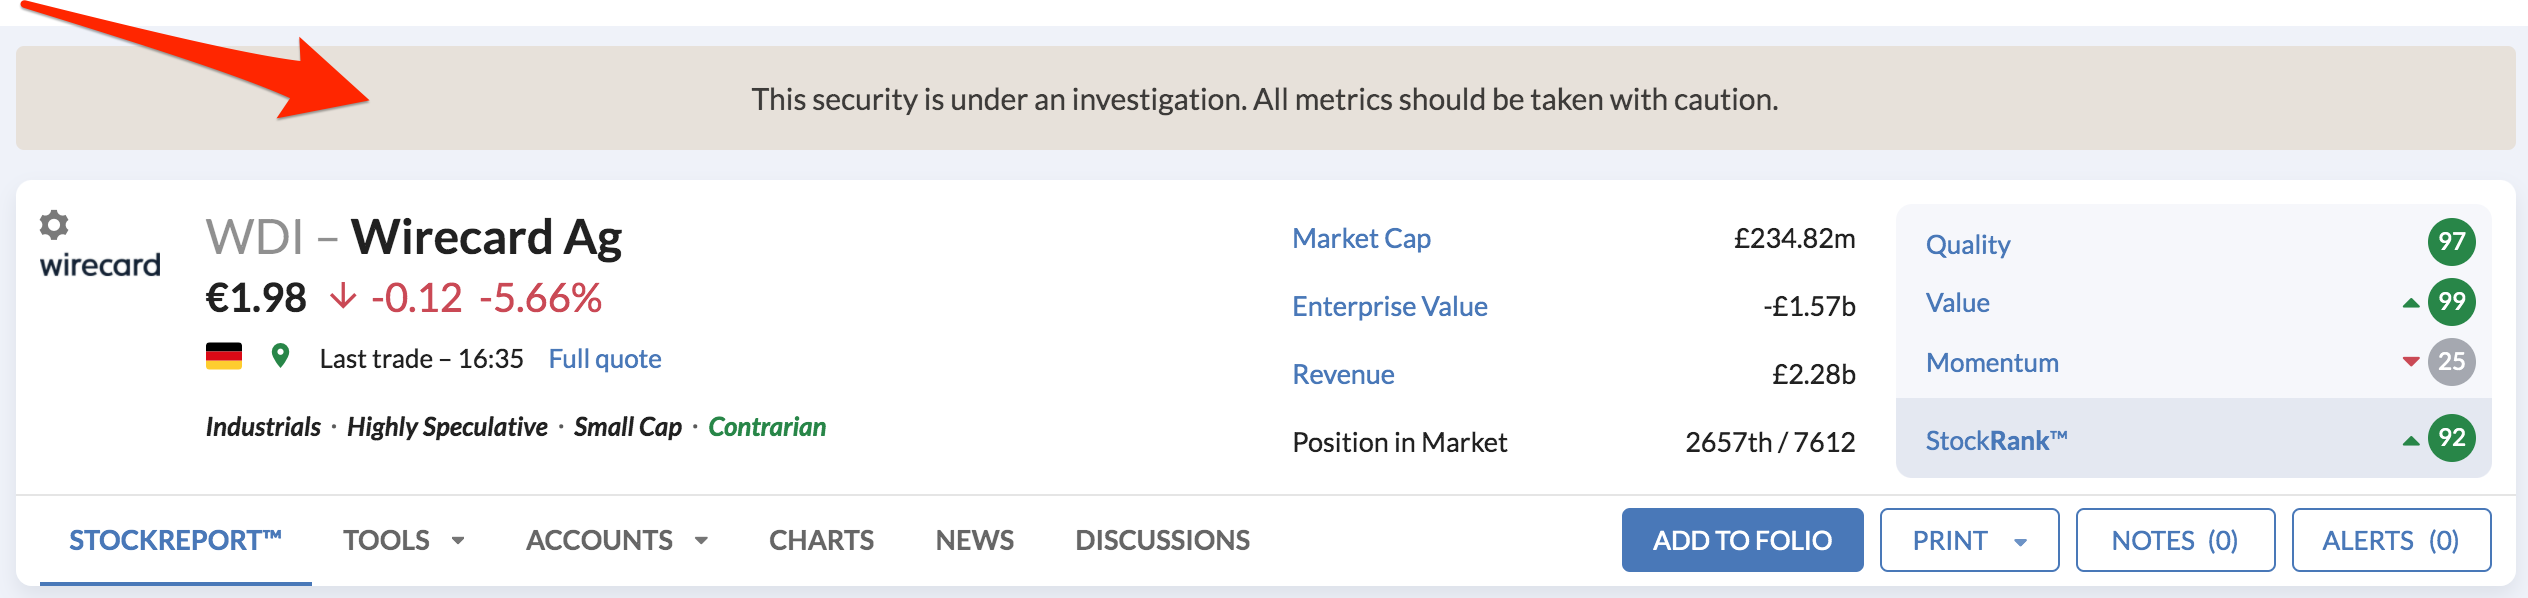
Stock Report banners - Highlighting unusual or one-off situations
With thousands of companies quoted on world stocks markets, it's inevitable that occasionally there is a need to flag a particular event or circumstance that you should know about. So we've introduced new warning banners to help us do this.
Typically, these issues arise when the data that is presented on a Stock Report doesn't give the full picture. That usually happens when a company has recently joined the market. With insufficient financial and price data, Stockopedia's algorithms may not be able to produce a fair assessment of the stock. In that case, we'll now flag it with a Stock Report banner.
Other cases warranting Stock Report banners include potential takeover situations and, unfortunately, stocks that are allegedly fraudulent, or have other associated concerns.
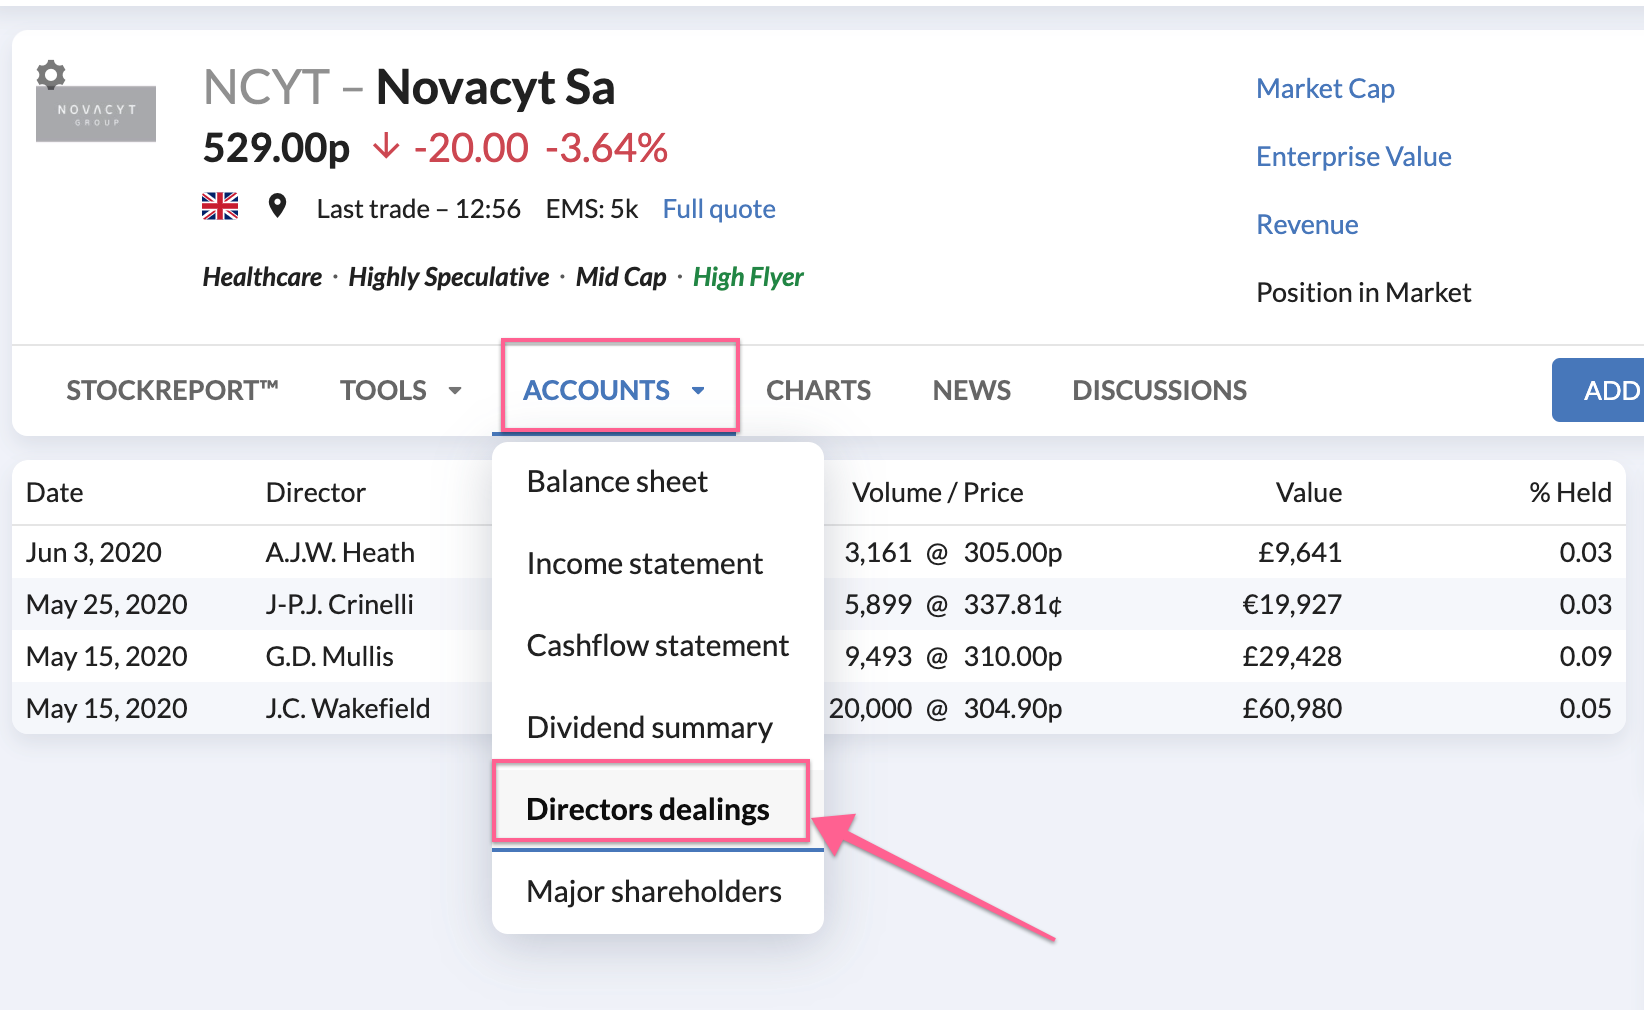
Compare Page update - sticky headers so you don’t get lost
Another recent update is on the Compare pages (which you can find on the Tools menu of Stock Reports). We've we have now made the company names at the top of the table sticky, which means that you can scroll down the extensive Compare table and always have those company names in view. That saves you having to jump back to the top to remember which stock you are looking at.
Bug fixes
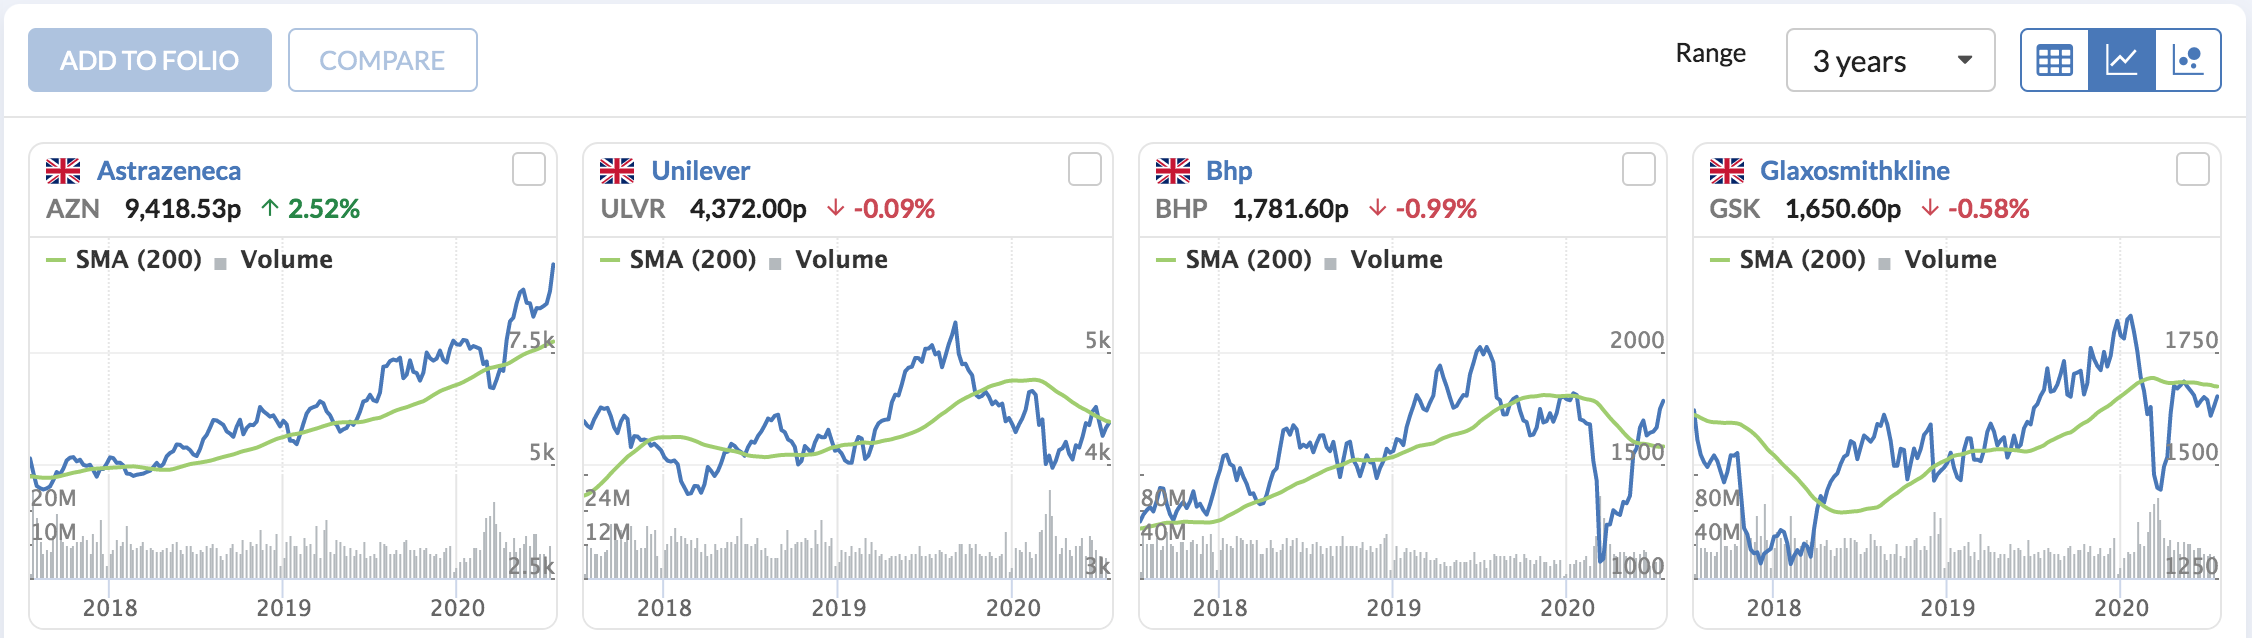
In recent weeks we've released a number of bug fixes, including an issue that was affecting mini-charts. The 200-day simple moving average line now appears correctly on both the three- and six-year view.
Elsewhere, we've fixed a data bug on the pop-up graphical histories on Stock Reports. You'll now find that the 'years' on these graphs are identical to the years on the main Financial Summary.
Another small but important fix on StockReports is that values for P/E Ratio range and Dividend Yield range are now showing on the Graphical Summaries. So now you get historical data for Revenue, Net Income, Normalised EPS as well as P/E and Dividend Yield.
Finally, it came to our attention that company names a logos had gone missing from new articles, which obviously had the potential to be very confusing. That's now been fixed and news stories appear as they should.