Getting an instant view of price & volume technicals just got much easier with the release of improved Mini Charts. You can now see traded volume and smart moving averages for stocks instantly right across the platform - including StockReports, the Today page, Screening and Folio Table Chart Views and even on blogs in Discuss.
Mini Charts are already a popular way of viewing basic chart trends without having to click away or launch full scale charts. They’re a huge time-saver and an essential component in the Stockopedia toolbox. You don’t need to be a technical analyst to benefit from Mini Charts, but these new upgrades should help those looking for quick ideas that can be taken further in the main charts area. Here’s what’s new:
Instant technicals - spot trends quickly without disruption
The two new technical indicators on Mini Charts are the moving average and traded volume. These metrics play an important role in understanding price and trading trends.
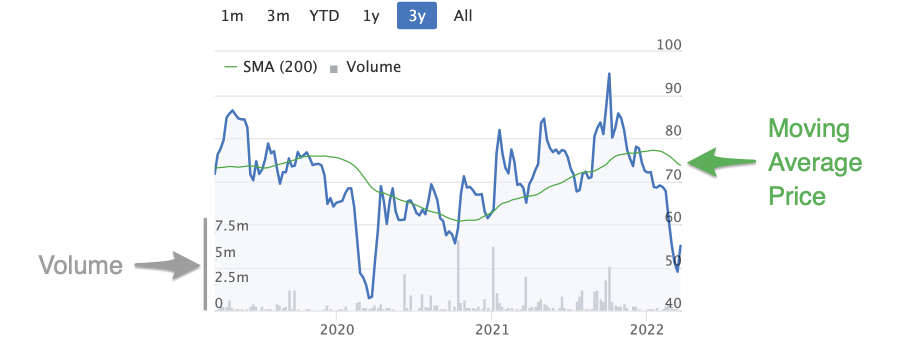
Moving averages smooth out the noise of daily price moves to give you a clearer view of trends over time, as well as potential points of support and resistance in up or down trends. Traded volume is a measure of the total volume of shares that have changed hands, and can be a confirmatory signal in securities that appear to be breaking out or falling sharply. You can read more about Moving Averages and how to use them in the Guide
By having this detail on Mini Charts, it’s much easier to see technical breakouts and trend setups. By setting a table of securities to Chart view, you can now breeze through long lists to get an instant view of what to ignore and what to explore:
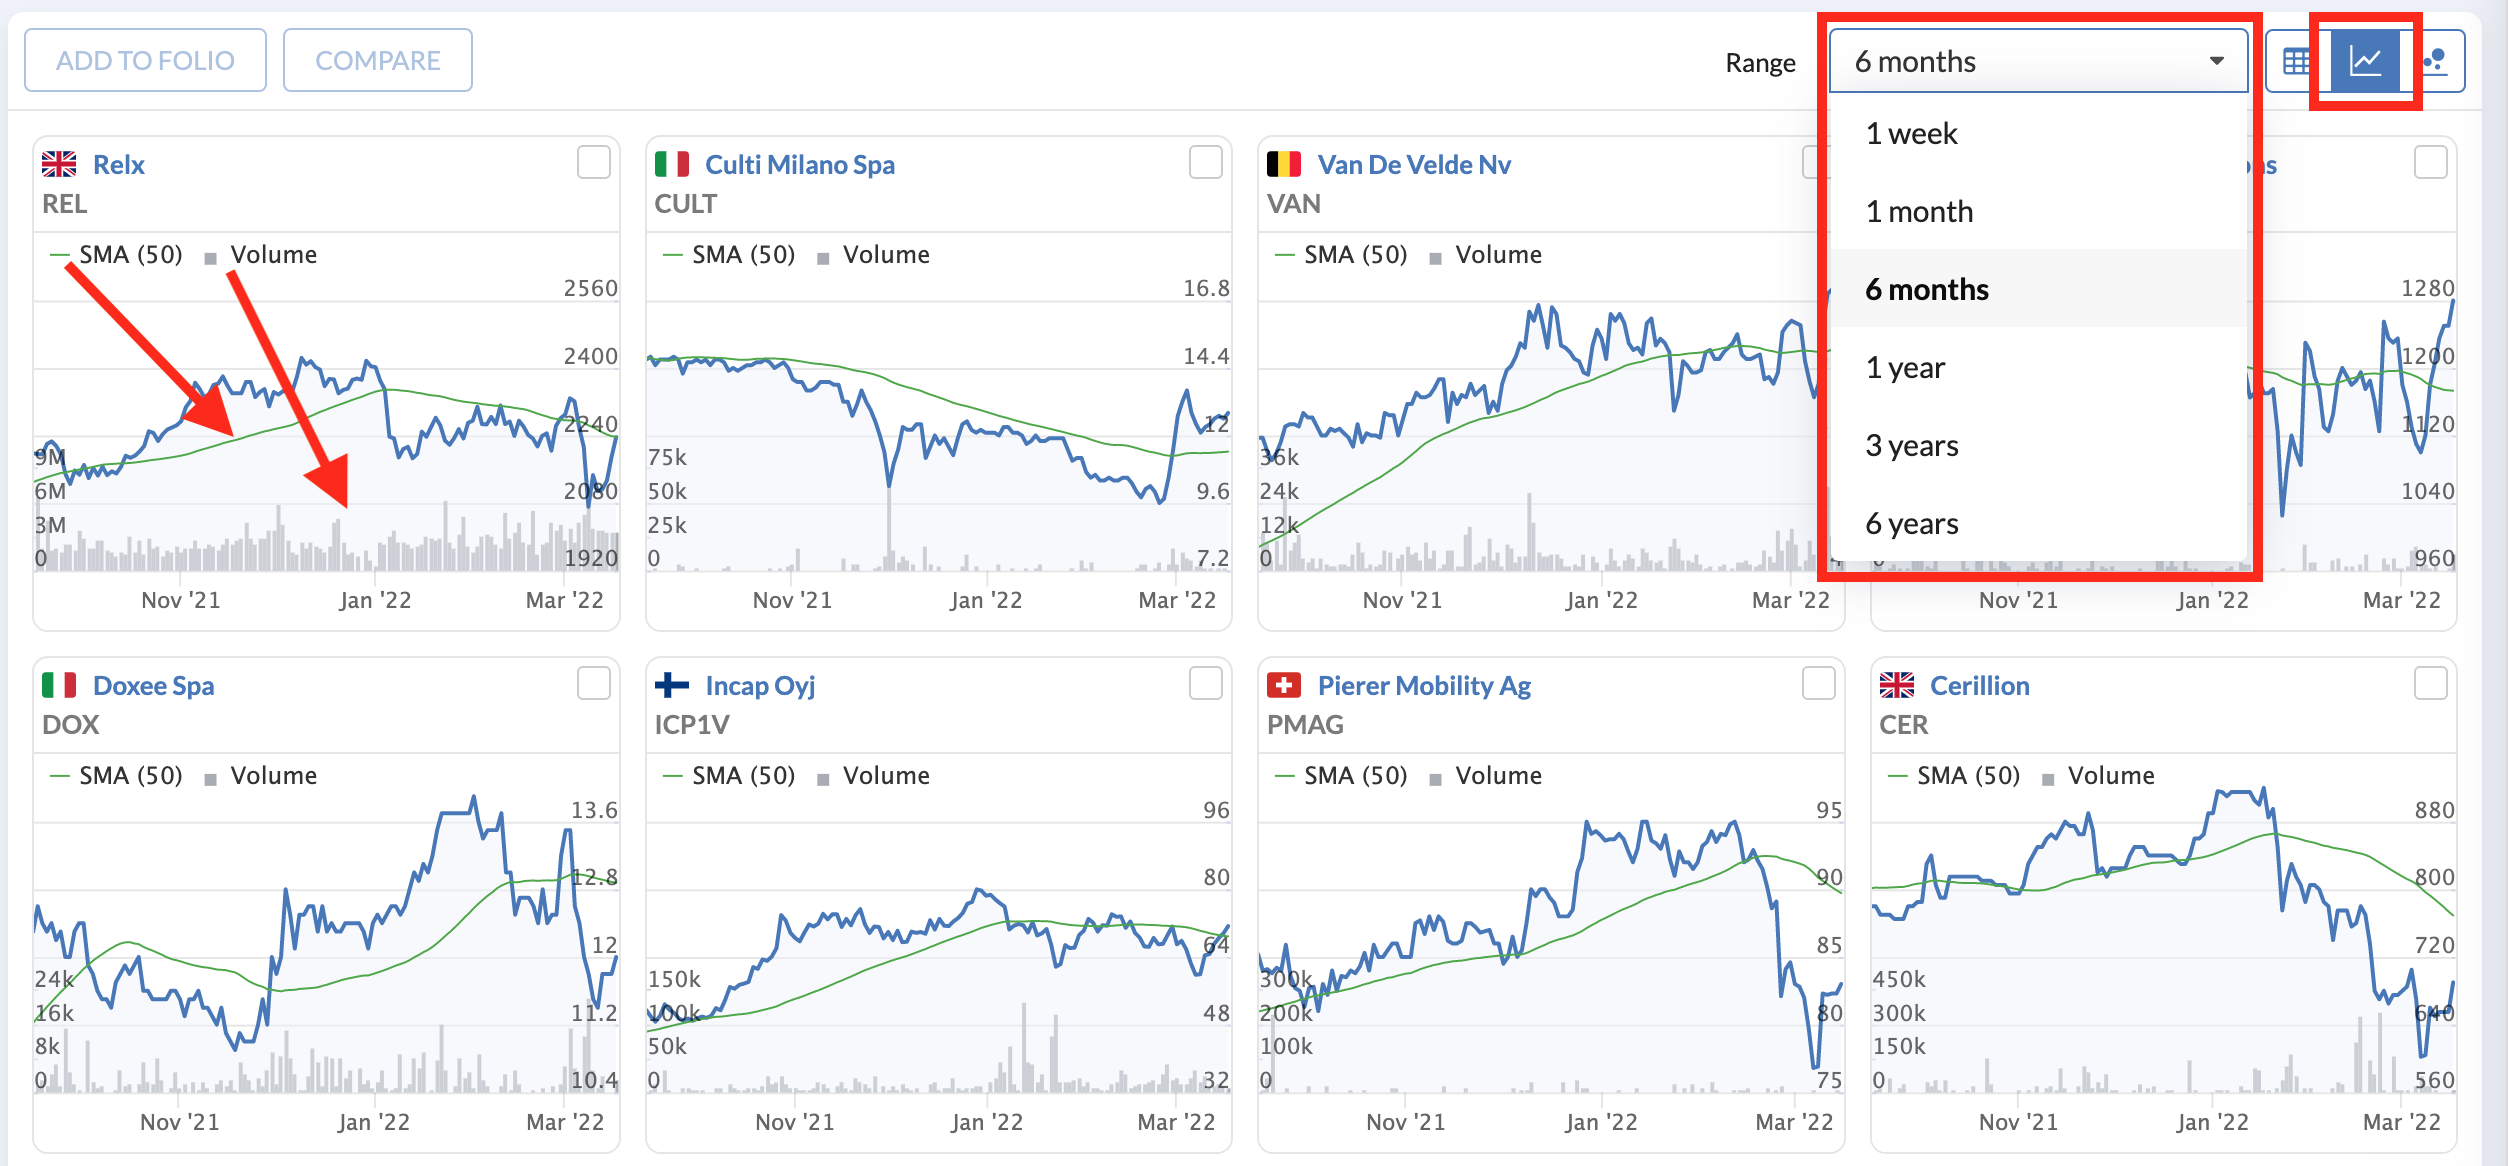
Chart flexibility - see technicals over your preferred timeframes
Mini Charts have always had adjustable timeframes, and we’ve kept that flexibility with the new technical data - giving you the option of seeing short and long term trends. In Screener and Folios tables, the date displays can be adjusted from anywhere between 1 week and six years using the menu at the top of the table.
As part of the adjustable chart timeframes, the moving averages are dynamic, which means that chart views of up to one year show the 50-day moving average. But when the chart view is greater than one year, it defaults to the 200-day moving average. This simplifies the chart and shows the most appropriate moving average without distracting from the price line.
Quickly access full charts with one click
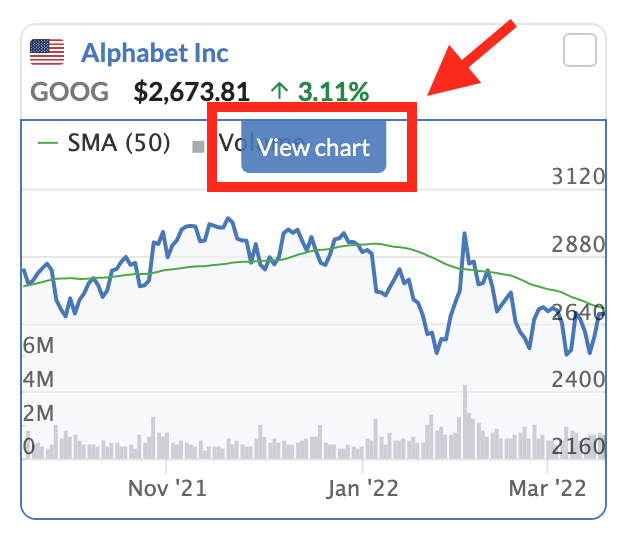
Along with extra data on Mini Charts, we’ve also made it clearer how you can switch to more powerful main charts with just one click. Previously this was not as obvious as it could have been, so we’ve made it more intuitive.
Hover over any Mini Chart in Screens and Folios lists and you’ll now see the option to view the main chart:
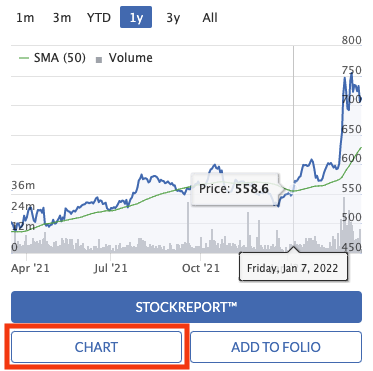
Likewise, the Mini Charts that you can find next to articles in Discuss all now have a button to open the main chart:
Enhanced charts available across the platform
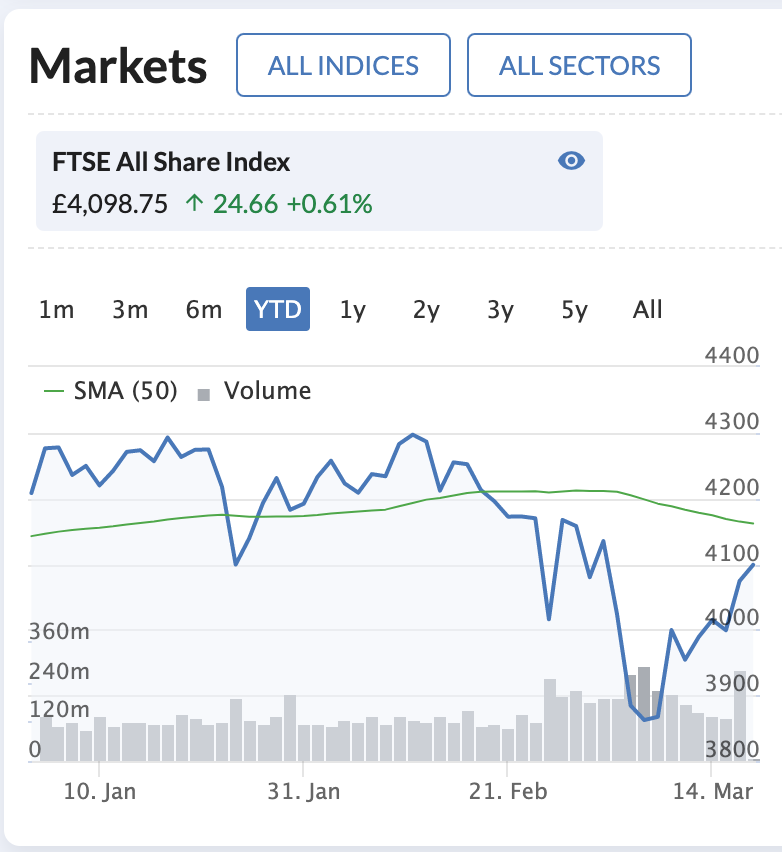
As well as individual securities, we’ve also enhanced the MiniCharts for main indices - which you can find on the Today page and the main Indices pages. Again, this provides useful extra insight about trading volumes and price trends for each index - giving you a greater snapshot assessment of market action.
More technical data at your fingertips
Overall, the new Mini Chart enhancements provide extra technical detail for anyone wanting to see essential trends in an instant - without disrupting your research experience.
Other fixes and updates
- Folio transactions for today can now be added without error. We have fixed an issue that was causing problems for some users when entering portfolio transactions when the date was today.
- Print improvements to Folio, Screener and Compare pages. We’ve resolved some of the formatting issues that were causing problems when printing tables. Site menus, check-boxes and cog icons no longer appear on printed pages. In addition, when printing Compare pages, all the securities will now print.
- Historical StockReports (available via the Print button on Stock Reports) are now being generated for all geographical regions. This has not always been the case over the past year, but will be from now on.
- NAV and News updates for Investment Trusts are fixed. We had reports that regular updates were not appearing in the news section of StockReports, and this is now resolved.
- In portfolios, news and discussion posts are respecting the toggle for closed portfolio positions. Previously, news and posts were showing for both ‘open’ and ‘closed’ positions even when ‘show closed positions’ was unticked, which created a lot of unnecessary noise in folios, which we have now fixed.