StockReports have always been the most popular feature on Stockopedia for good reason - they are designed to give you everything you need to make effective decisions on shares fast - in one single, easily scannable view.
In our earliest releases of the new site there were a few differences compared to the 'classic' format which the community were quick to point out. In this release we've put a big effort in to improve the layout and data fidelity, which bring the new StockReports up to the 'classic' format standards.
Community engagement continues to be a source of invaluable feedback for the development team. On that note, we'd like to thank Paul Scott for taking to the new site and giving us some excellent pointers on what to look at next. Please do follow his lead, and head over to the new site to check out the latest changes.
Here is what's new:
StockReports look more familiar with fixed widths...
Many in the community will be aware that our StockReports were initially inspired by Company REFS - a fixed width & height format print product. Print format designs gives consistency when your eyes scan the data. We'd initially tried providing a 'responsive' layout which filled the width of the screen, but on larger screens that caused issues. So we've fixed this. We've re-introduced a maximum width - you'll find that StockReports look great on wide screens as they now lock out at a max width of 1250 pixels. This means the StockReport keeps its iconic shape and layout by remaining compact across all displays. If you tend to use larger screens, you'll find the change quite striking.
Quickly see how many 'long' and 'short' GuruScreens a stock qualifies for
The 'Screens passed' widget has been split out so you can immediately identify how many 'long' and 'short' screens a company qualifies for. This means that you don't have to scroll through the different screens to find out if there are any surprises in there.
Get more accurate peer group sets to compare your stocks against
At the bottom of the StockReport you'll find a list of similar companies to the stock you are looking at. This peer group is generated according to your investment universe, making it a great way to find new research opportunities. We're improving our process around this all the time so please do send in your feedback.
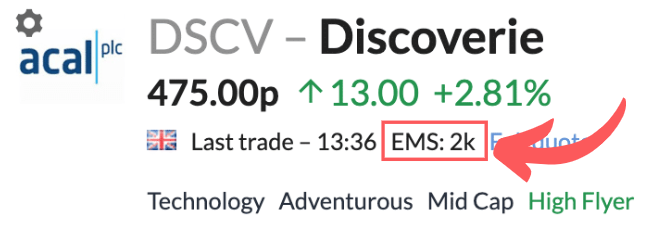
Quickly gauge a stock's liquidity
Gauge a stock's certain liquidity at a glance with the Exchange Market Size (EMS) metric. This shows the number of shares market makers are compelled to trade at the price they offer. Although this is only a proxy for liquidity, it gives a valuable indication of the volume you can be certain you can deal at.
Keep track of the notes you've written on a stock
Now you can see how many notes you've created on a stockReport, meaning you can get a quick feel for how much you have written on that company. Making the most of this Notes feature is a great way to keep track of your thought process and jot down potential future lines of analysis.
Get a feel for recent trading with the Financial Brief
You can quickly get up to speed with a concise overview of recent trading by clicking on the 'Financial Brief' section to the bottom of of the Financial Summary of the StockReports - a useful feature for when you are getting to grips with a new stock.
More dividend data and a revamped dividend history page
The income seekers among us will notice that you can now instantly see the dividend payment status and last dividend payment date on a StockReport. This information is found at the top of the 'Dividends' section of the Financial Summary.
When you click through, you'll then be taken to a revamped Dividend History page with a useful chart on the left showing interim and full year dividend payments stretching back over many years. You should find the accompanying dividends column to the right easier to read as well.
Bug fixes
- StockReports - the charts that pop up over certain lines in the Financial Summary of a StockReport disappear more quickly once you hover away
- StockReports - formatting improvements have been made so releases in the News section of the StockReport have paragraphs and are easier to read
- Screens and Folios - the Table Switcher Dropdown Menu has been made taller so you can see all Table Views without scrolling.
- Notes - you can now bold and italicise text in Notes
- Browse - we have fixed some sorting issues in the Sectors/Industry Group Pages
What's next?
In the next development sprint we're going to add Director's Dealings data into the StockReports of UK-listed companies. This is a fantastic function that gives a great insight into where the 'smart money' is going and will include vital info like the date and type of transaction, the name of the director in question, and the volume and price of the trade.
We're getting to the point where we can focus on some totally new features now. Take a look at the near term Product Roadmap to see what's on the agenda and if you are still using the old site, and if you haven't yet, be sure to switch over to the new site every now and then to keep up to date on how it is progressing.


.jpg)