Nobody knows stocks better than directors that run the company. They have intimate knowledge of a firm’s future prospects and a huge information advantage over private investors. What if you could follow director trades to piggyback their insights? Now you can. The latest advancements on the platform enable investors to track Global director trades and potentially profit from director deals across the world. Until recently, Stockopedia only provided director deals data for UK stocks. The same data is now available for all regions in the Stockopedia coverage universe.
Track director buying and selling
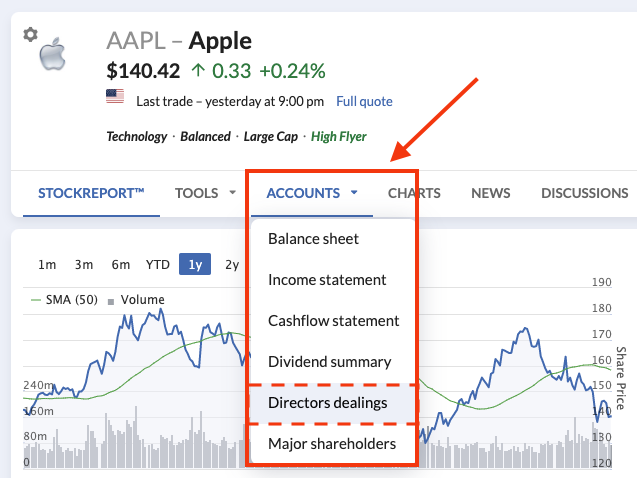
Subscribers will be familiar with the Accounts tab on StockReports; it enables you to read financial statements, track dividends and analyse major shareholdings. By clicking on director dealings, under the same tab, you will be taken to a page where it is possible to keep on top of directors' trades and conduct further due diligence before making an investment decision.
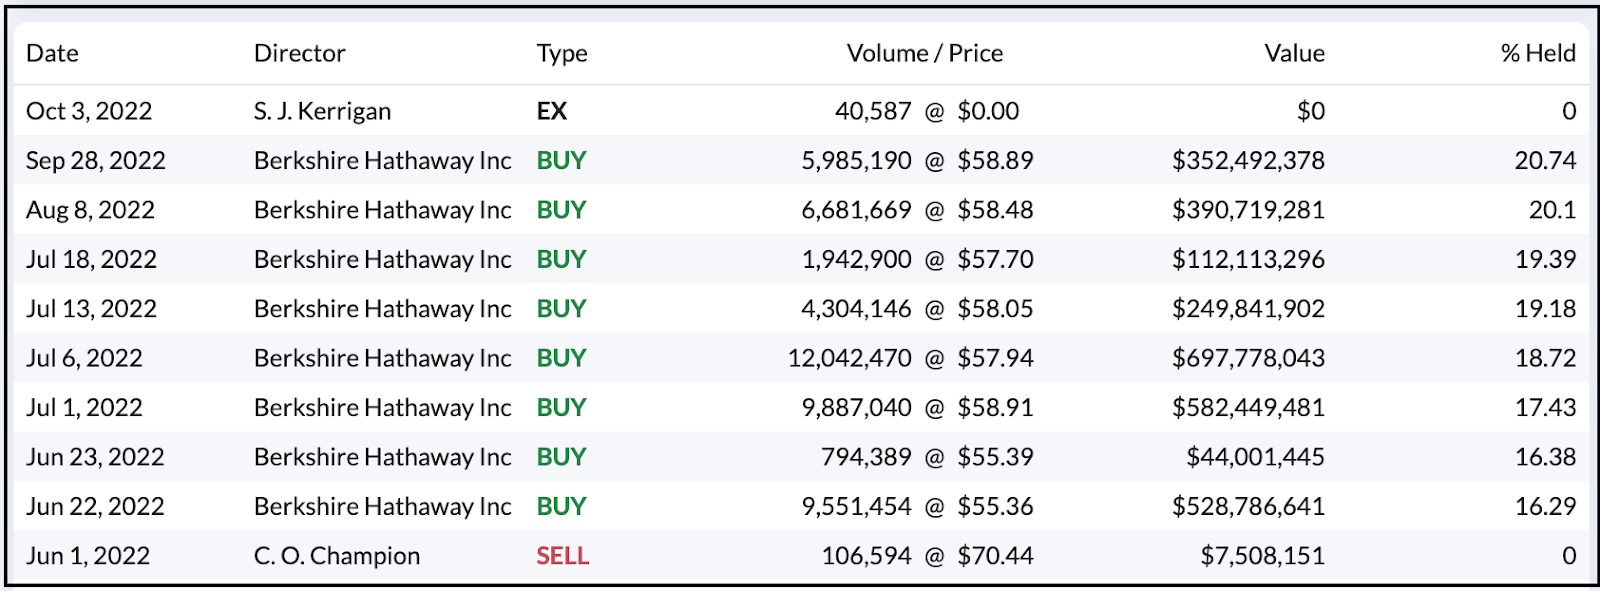
The director deals page shows a table with the following columns:
- The date when the transaction went through the market - i.e. not the date the trade was announced to the public.
- The name of the director.
- The type of trade - e.g. buy or sell.
- Volume refers to the number of shares traded.
- The price at which shares were traded.
- Value is the total value of the transaction - i.e. volume multiplied by price.
- % Held displays the proportion of shares, as a percentage of market cap, held by the director after the transaction.
It is worth mentioning that a table row will not be present:
- if the trade is below £1000 in value;
- if the transaction is ‘within’ a holding - e.g. director simply transfers the same stock position from one brokerage account to a different account;
- if the trade was by a major shareholder who is not an insider (although these are reported in Canada and US);
- if the company is based in Taiwan or Japan, where directors are not obliged to disclose transactions.
How Can I Use This Data?
Not all director dealings are meaningful signals. Here are four guiding principles that will help you benefit from this data
- Pay More Attention to Buying: Insider ‘sells’ are often made for personal reasons rather than concerns for the company’s prospects. For instance, a director may simply be buying a house. As Peter Lynch explained in One Up on Wall Street: 'Insiders might sell their shares for any number of reasons, but they buy them for only one: they think the price will rise.' Investors can distinguish between buying and selling using the Type column in the table.
- Act on buy signals as quickly as possible: The table shows when a trade happened (see Date column). This is important because it pays to act quickly after the information is released to the market. Research suggests that while insider trades have been shown to be profitable signals for the first nine months after they are disclosed, on average about half of the profits are made within the first 60 days.
- Focus on larger trades in small value stocks: Research by Lakonishok and Lee scrutinised one million director trades in the period 1975 to 2005. They found that the highest returns were produced when at least three different insiders were trading sizable amounts of a small value stock. The Value column in the above table displays the size of a trade in nominal terms.
- Focus on intensive buying by multiple directors: One of the most important patterns in director dealings is cluster buying, or those periods when several directors are snapping up stock at the same time. Academic research suggests that conviction trades like these are some of the best at predicting share price outperformance.
New Data Supplier
We have switched data vendor for director deals data, from Financial Express to Smart Insider. The new vendor enables Stockopedia to cover director deals on a global basis. Smart Insider also offers a broader range of data points, for example the directors’ Job Title, which we plan to incorporate into the product as we go forward. Furthermore, Smart Insider report trades on a consolidated basis, which makes analysis easier…
Consolidated Trades
It can be difficult to track trading activity when the same director places a large number of small trades within a very narrow timeframe. To reduce noise and increase signal, we display consolidated transactions - i.e. a single table row when trades happen within a 4-week window, in the same security, with the same transaction type. When we consolidate trades, we use a weighted average price alongside the latest trade date in the series of transactions. The % Held column will also reflect the holding on the date of the last transaction.
FAQs
- How often is the data updated? We aim to display director deal data on the website within 24 hours of the transaction being announced publicly. From time-to-time, there will be a delay if our data vendors need to make inquiries to clarify important details.
- Can I screen on director deals? Not at the moment, but we do plan to make this data screenable in the future.
- What do each of the trade types mean? We provide a definition for each type of trade here.
Feel free to check out further details on our this help-page.