Guru Strategies Review H1 2019: bargain strategies buck the trend
.jpg)
I once observed two people facing the wrong way in one of those wave pools - it didn’t end well for them.
What looked like a pleasant chat was interrupted by an artificial tsunami. They resurfaced after a second or two, coughing and spluttering, alive but very wet.
Looking at the year-to-date performance of Stockopedia’s 60 or so Guru Screens, I’m beginning to see how they must have felt - because the screens look as if they have just been dunked as well. Don’t read that wrong, there have been some big winners - but there have been some losers, too, and it is the sheer range of performance that hints at the volatility in the markets over the past year.
To recap briefly on our Guru Screens: we have been running these strategies (inspired by some of the world’s most highly regarded investors) since late 2011. We rebalance the screens quarterly to prevent these portfolios drifting from their stated strategies and we do not include transaction costs or dividend payments. It is important to bear the former in mind when looking at the performance of screens that tend to focus on small and/or micro-cap stocks, where spreads become more of a factor.
The second half of 2018 acted as a sort of equaliser. It interrupted trends and disrupted conversations. It was a bit of a reset.
Most of us have long since dried ourselves off and forgotten about the stock market slide with a sort of defensive amnesia, as is our wont. But halfway through 2019, the influence of H2 2018 can still be felt. The stock market narrative continues to be one of recovery.
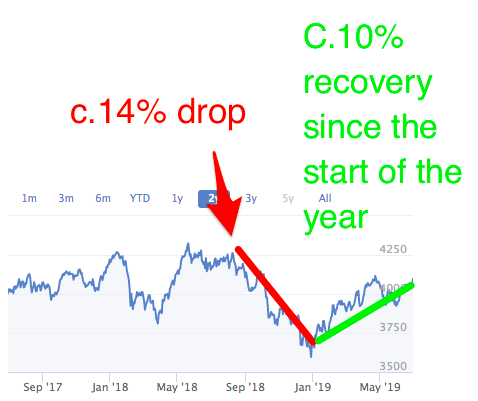
A quick look at the FTSE All-Share chart confirms that, yes, we did get drenched a couple of months ago:
How the guru strategies performed
The rate of recovery has varied across our Guru Screens. Here is how they have performed so far this year.
Index / Strategy Composite | Performance H1 2019 |
FTSE 100 | +13.16% |
FTSE 250 | +12.69% |
AIM 100 | +8.21% |
FTSE All Share | +12.73% |
Bargain Composite | +22.14% |
Guru Strategy Composite | +11.84% |
Quality Composite | +11.16% |
Momentum Composite | +11.01% |
Income Composite | +9.84% |
Value Composite | +8.96% |
Growth Composite | +7.91% |
Key observations
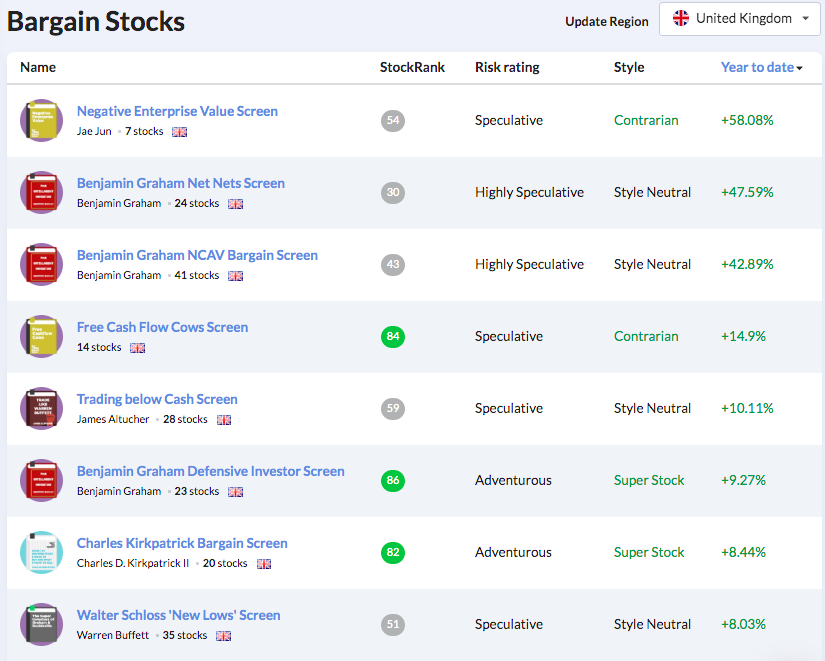
The Bargain Composite is a clear outlier in the table above. When we dig into this category of Guru Screens, we can see quite a broad spread across strategies. All of these bargain strategies have generated positive returns so far this year (note that these screenshots are taken from the new site):
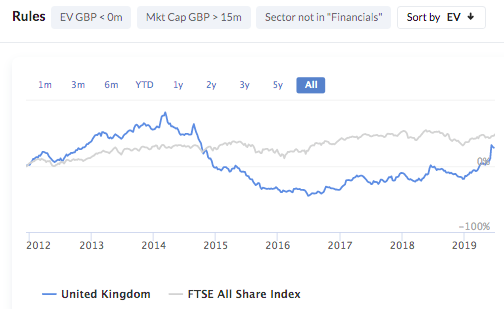
The Jae Jun-inspired Negative Enterprise Value Screen leads the charge although, with just seven stocks qualifying at present, the level of concentration (and risk) in this portfolio is well above average. Negative Enterprise Value quite simply looks for firms with a market cap of more than £15m that have a negative enterprise value - extremely cheap stocks with more cash than debt and equity combined.
What’s more interesting is this screen’s performance since inception. It has spent the majority of its life as a losing strategy - might this gap up mark the start of a bull market for bargain investing?
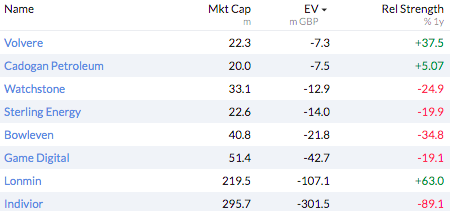
Perhaps, but not likely. One swallow does not a summer make. And we can see that this heavily concentrated portfolio bears all the risks and high volatility characteristics you might expect from a small sample size:
Two big winners (Stockopedia favourite Volvere and high-risk mining recovery play Lonmin, which has just been bid for), one big loser (Indivior) and four others in the red by a considerable margin. This is not a portfolio for the faint-hearted. By Jun’s own admission, ‘If done correctly, it looks like this strategy is hugely profitable, but it does come with a lot of volatility.’
The Benjamin Graham Net Nets and NCAV Screens provide more compelling evidence of deep value outperformance as a factor considering far more stocks tend to qualify for these screens. They are both supported by the same underlying notion of finding stocks that are so cheap that their liquidation value exceeds their market value.
Even though these screens are populated with more stocks, by themselves, each stock is particularly risky. It is in diversifying across a basket of such stocks that a degree of safety is attained. Ben Graham himself suggested a minimum of 30 stocks in order to diversify away the high levels of unsystematic (company-specific) risk.
This is best highlighted by the overall RiskRatings of these portfolios: Negative Enterprise Value is a Speculative portfolio, Net Nets is Highly Speculative, and NCAV is also Highly Speculative. What’s more, all three screens are dominated by micro-caps. For example, the majority of stocks currently in the NCAV screen have a market cap of less than £10m, meaning some sort of discount for lack of liquidity should be factored into these impressive returns.
Other notables
While Bargain was the only composite to outperform the All Share, there were multiple individual Guru strategies that have been having a whale of a time.
In terms of Quality screens, the Buffetology-esque Historical Growth Screen and the Buffetology-esque Sustainable Growth Screen both enjoyed above-average results. The former has appreciated nearly 22% and the latter is up 19.7% so far this year thanks to their blend of consistently high returns on equity and capital at reasonable valuations.
The classic Peter Lynch Growth Screen is leading the Growth strategies and is currently sitting on a 21.23% gain for the year so far (although the requirement of having a trailing twelve month PEG of less than one means that only three stocks currently qualify: T Clarke, Mission Marketing, and HML Holdings).
It is the Value strategy bucket that displays the widest range of performances. The John Neff Value Screen - which has historically underperformed the All-Share - has had a very strong 2019, up 31.03% as of writing. Meanwhile, the David Dreman High Dividend Screen, which holds Plus500, came unstuck and is now down 14%.
Other notables include the Quality Income Screen (+16.87%) in the Income bucket and the Earnings Upgrade Momentum Screen (+22.28%) from the Momentum strategies.
Form is temporary, class is permanent?
Pretty much any strategy can win (or lose) over a six-month timeframe. There is not a single strategy out there that is so good it never underperforms the market. But over longer time frames, the cream rises to the top.
We now have over seven years of guru screens data. In that time, about a quarter of our screens have underperformed the FTSE All-Share and three-quarters have outperformed. What works is not a secret. The market rewards simple, well-executed strategies. Tiny Titans, up 334.14% is just value and momentum. The Zulu Principle, up 302% is just low PEG, high ROCE, positive momentum.
Understanding winning strategies isn’t hard. In fact, sometimes, it appears to be their simplicity that helps them win. Sticking to a clear, consistent, and effective strategy over multiple years, on the other hand, can be trickier than it sounds.
.jpg)
About Jack Brumby
I'm looking for compounding investments.
I started off in Leisure - a part of the market I still love, but an area where stocks can appear "cheap" for years without going anywhere. It made me realise that valuation is only one part of the puzzle.
Now I sift through a much broader universe of stocks in search of small, high quality operators with large addressable markets, strong and maintainable margins, and clear share price catalysts.
CFA charterholder.
Disclaimer - This is not financial advice. Our content is intended to be used and must be used for information and education purposes only. Please read our disclaimer and terms and conditions to understand our obligations.


I'm confused, Volvere (LON:VLE) was only added to the Negative Ent. screen on 2019-06-14, so why are you including it for the H1? My understanding is the screens are rebalanced quarterly and the shares selected daily don't necessarily form part of the screen, that screen is down 15% in the last week, Volvere (LON:VLE) has a huge spread also.
.jpg)
You're right herbie, I read the relative strength as portfolio performance. Negative Ent is definitely not a screen I imagine many investors replicating given the concentration, volatility, and transaction costs. It's not one I'd go for. All three of the top-performing Bargain screens are populated disproportionately with out-of-favour small and micro-caps, so it strikes me as pretty specialist territory.

Please show me how the entry and exit dates are being generated and the calculations of how the profits are being made. Can we subscribers achieve the same results?

That deserves a prize as an entertaining piece of journalism plus being an excellent summary.
First comment: a Lot goes on between the quarterly updates of the screens when you can make or lose money.
Second comment: the Print function that gives past valuation of a stock shows the number of screens it qualifies for but only identifies the first and one cannot flip though the others. Vodafone (VOD) as an example presently does not qualify for any screen, last summer was in 3 or 4 but one cannot tell which. As another example (BATS) has moved out of Ben Graham as the price rises.
The Bargain strategies are my hunting ground but I pay close attention to the date they join. The housebuilders have consistently appeared for some time but are misleading because the biggest bargain at the top of the cycle. Other companies, however, rotate in and out with price changes.
Your opening para echoes Yogi Berra's remark which is appropriate here: 'One can observe a lot by watching.'

Typically the guru strategies screens produce a list laden with dual list companies with roots in emerging markets such as Egypt, Kazakhstan and Eastern Europe. Often quoted in a currency other than sterling. For example in the Warren Buffet - Hagstrom screen this evening there are 22 candidates or which 13 are these outside the UK.
So it's no wonder that there's a deviation from the FTSE100, FTSE all share etc. The historic performance is kind of like a play on half an emerging markets screen. I'm therefore not convinced a UK focused investor should conclude much from these screens.
It would be very interesting to see how each screen performs if it could be filtered to only allow shares quoted in sterling, with a main listing in London, and (reasonably) a minimum market cap of say £200m.

*Past performance is no indicator of future performance. Performance returns are based on hypothetical scenarios and do not represent an actual investment.
This site cannot substitute for professional investment advice or independent factual verification. To use Stockopedia, you must accept our Terms of Use, Privacy and Disclaimer & FSG. All services are provided by Stockopedia Ltd, United Kingdom (company number 06367267). For Australian users: Stockopedia Ltd, ABN 39 757 874 670 is a Corporate Authorised Representative of Daylight Financial Group Pty Ltd ABN 77 633 984 773, AFSL 521404.


Excellent write up. Thanks.