Screening for Warren Buffett stocks: the ultimate strategy?

Warren Buffett’s 2022 letter to Berkshire Hathaway shareholders is due to hit the wires very shortly. The Oracle of Omaha always has something worthwhile to say, and his letters usually make for a compelling read.
This year, I think it will be interesting to see what Buffett has to say about the potential impact of higher borrowing costs.
One thing I’m fairly sure of is that his investment strategy won’t change very much as a result. Shares in his company Berkshire Hathaway (NYQ:BRK.A) have risen by a compound average of 20.1% per year between 1965 and 2021, defying wars, recessions and various other crises.
Over the same period, the S&P 500 Index (SP:SPX), including dividends, achieved an average annual return of 10.5%.
Beating the market in this way over such a long period is impressive enough. But the real success of Buffett’s stock-picking strategy becomes clear when we look at the total gains achieved during this time.
Over the 56-year period to 2021, the S&P 500 rose by 30,209% including dividends. Berkshire Hathaway shares rose by 3,641,613% during that time.
Yes, 3.6 million per cent:

Source: Berkshire Hathaway 2021 shareholder letter
SInce 1965, Berkshire’s average annual gain has been double the market average. But over the same period, the total gain achieved has been 120 times greater than the index.
This is a graphic example of the power of compounding. By focusing on businesses that can reinvest their earnings profitably over long periods, Buffett has outperformed pretty much every investor in recorded history.
With that in mind, I thought it might be a good time to follow up my recent Terry Smith screen with a Warren Buffett screen. Can I use Stockopedia’s powerful screening tools to find investments with the potential to deliver wonderful compound gains?
Warren Buffett screen criteria
As I did with Terry Smith last month, I used Warren Buffett’s past letters to build a list of criteria for my screen. Although Buffett isn’t quite as explicit as Terry Smith in terms of specifying the metrics he uses, there are a number of themes that crop up regularly.
In addition, Buffett often shares examples from Berkshire’s investments that give us an idea of the kind of numbers he might look for.
Like Terry Smith, Buffett provides an owner’s manual for Berkshire shareholders. This provides a good overview of the company’s philosophy, but it’s short on financial details and was last updated in 1999.
From more recent publications, I found the 2019 letter very helpful for providing concrete details of ratios and values that I’ve been able to incorporate into this screen.
In the remainder of this article, I’ll explain which screening rules I’ve chosen and why. I’ll finish up with a look at the UK shares currently returned by the screen and discuss the next steps I’d take.
I’ve linked to my Warren Buffett stock screen here.
Size & sector
Buffett started out by investing in small companies, before his growing success meant that he needed to seek out larger targets. I’ve opted for a minimum market cap of £50m to reflect UK market conditions and private investors’ smaller position sizing.
Berkshire Hathaway does not tend to invest in mining-type commodity businesses, but does invest in oil, renewables, utilities and transportation.
However, Buffett’s primary criteria is that he should be able to understand a business; it should be within his circle of competence. In his writing he recognises that this will be different for each of us – the key thing is to be aware of one’s own limitations.
For this screen I’ve opted to exclude Metals & Mining, Coal and Investment Banking & Investment Services. The last of these is because I can’t imagine Buffett buying conventional asset managers.
However, anyone re-using this screen might want to alter the sector choices to suit their own preferences.
Rule #1: market cap > £50m
Rule #2: industry group excludes Metals & Mining and Coal
Profitability
One of Buffett’s most consistent requirements is that businesses must have above-average profitability. This is often an indicator of pricing power and a potential moat – a defensible advantage that helps a company maintain market share and deliver sustainable growth.
In his 2019 letter, he lists Berkshire Hathaway’s then-largest 15 stock investments by value. At that time, these were said to have a weighted average return on tangible capital of 20%.
Source: Berkshire Hathaway 2019 shareholder letter
The standard measure of return on capital employed used by Stockopedia includes intangible assets, such as goodwill. To more closely reflect Buffett’s preference for tangible capital, I’ve specified the Joel Greenblatt ROC ratio that’s also available in the screener.
Buffett’s writings and those of people who’ve studied his investments also make frequent reference to return on shareholder’s equity. This is also an important measure in his estimation of future growth potential, as I’ll explain shortly.
Rule #3: Return on Capital (Greenblatt Definition) 5y avg > 15%
Rule #4: Return on Equity 5y avg > 15%
Sustainable growth
At the heart of Buffett’s investment strategy is the concept of reinvested earnings. Berkshire’s portfolio is heavily concentrated on companies with a proven ability to long-term compound growth funded by retained earnings.
Such businesses are naturally more likely to have competitive advantages, hence their ability to continue expanding without being constrained by fresh competition.
Fortunately, this is one area where his letters are quite explicit. There are many mentions of the importance of his companies’ ability to retain and reinvest a portion of their earnings every year.
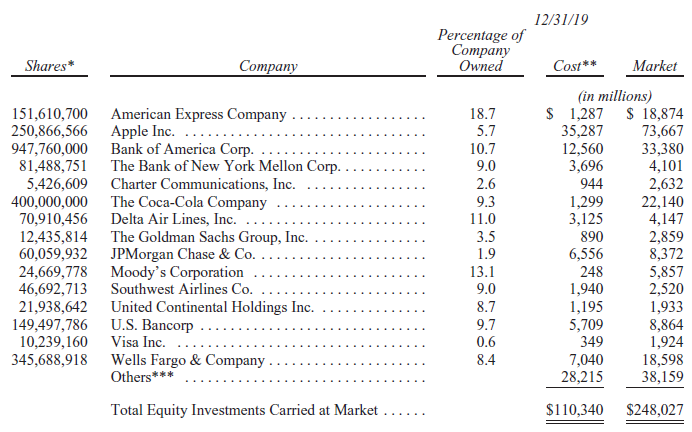
In the 2019 letter, there’s an example of dividends received versus retained earnings for Berkshire’s 10 largest stock market holdings at that time:

Source: Berkshire Hathaway 2019 shareholder letter
My sums suggest that in aggregate, the companies listed above paid out 31% of their earnings as dividends in 2019. The remaining 69% of earnings were potentially available for reinvestment.
Estimating a company’s ability to grow in the future is difficult; it is, perhaps, one of Buffett’s greatest talents. Fortunately, Stockopedia provides an Expected Return rule we can use to set an expectation for future growth.
This is based on the work of Buffett’s former daughter-in-law, Mary Buffett, in her book The New Buffettology.
There’s more detail in the link above, but in short this calculation looks at a company’s 10-year average return on equity and its typical dividend payout ratio. Using these, it’s possible to calculate an expected sustainable growth rate, based on retained earnings.
I’ve used this rule to specify a minimum sustainable growth rate.
To complement this, I’ve also used two other rules intended to demonstrate a trend of earnings per share and book value growth. I’ve chosen these as I believe they’re good indicators that a business is successfully reinvesting its retained profits.
Rule #5: Expected Return (Sustainable Growth) > 6%
Rule #6: Earnings per share CAGR 5y > 5%
Rule #7: Book Value per share Growth CAGR 5y > 5%
Debt
Warren Buffett dislikes companies that rely on debt equity to generate growth. He rightly points out that while this might increase overall returns, it adds risk and can detract from shareholder returns.
The most commonly-used measure of leverage I’ve found in discussions of his approach is the ratio of total liabilities to shareholder equity. This is shown as gross gearing on Stockopedia’s StockReports and is available in the screener.

However, in an effort to prevent my screen becoming too exclusive, I’ve opted to use net gearing inc pensions instead. This uses net debt rather than total liabilities, but also includes pension deficits.
For UK shares, I think this is a more useful measure for an initial sift. Remember that screening results are always a starting point for further investigation, not a final selection.
Rule #8: Net Gearing inc Pension Latest < 60%
Valuation
Valuation is probably one of the most difficult elements of this process. As with growth estimates, I think that estimating intrinsic value is one of Buffett’s great skills.
He’s said to use discounted cash flow valuations a lot, but they aren’t a realistic option for a screen. Instead, I’ve used two valuation ratios I often use myself. They both take a holistic view of earnings relative to the value of the complete business. I think they should be reasonably well-aligned with how Buffett might view a stock.
Rule #9: Earnings yield (EBIT/EV) TTM > 6%
Rule #10: Enterprise Value to Free Cash Flow TTM < 25
Here are the screening results generated by these rules, at the time of publication (here's the link to the screen):
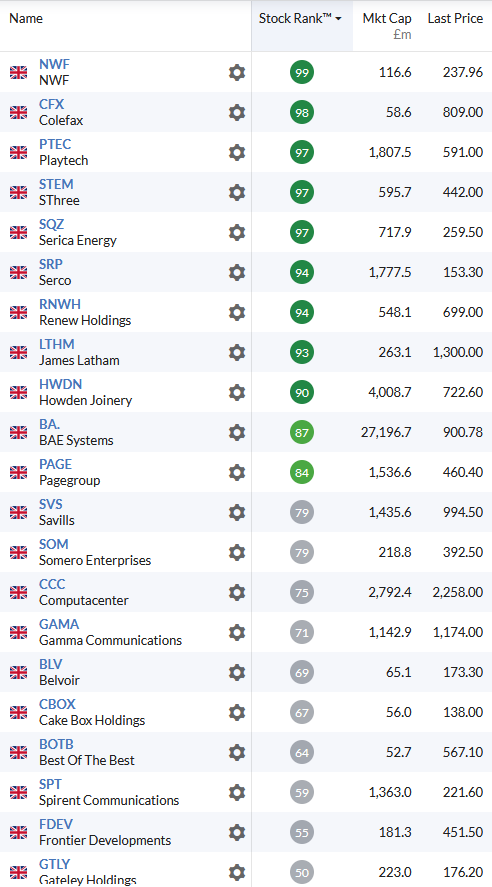
Conclusions & next steps
I think this list of stocks contains some interesting names, one or two of which I plan to look at in more detail in the coming weeks.
However, these results do have some clear limitations. Perhaps the most glaring restriction is that the criteria I’ve used effectively exclude banks. Buffett is a big investor in US banks and I can imagine that some UK banks might be of interest to him.
In my view, financial stocks need different screening criteria, so there’s little I can do about this without restructuring the screen.
To do this – in brief – I’d probably specify financial sector stocks only and use return on equity as the sole measure of profitability. For valuation, I’d use price/earnings and dividends as the key metrics, rather than the EV-based ratios I’ve chosen. I’d also remove the gearing rule.
In my view, stock screens are often most useful as a starting point for consistent stock picking. They help us reduce an unmanageable number of stocks down to a manageable, pre-qualified starting point for further research.
I hope this screen has proved interesting. As always, please let me know what you think in the comments below.

About Roland Head
I'm an investment writer and analyst, with a particular focus on systematic investing and dividends. I look for quality stocks with above-average returns, strong cash generation, and attractive valuations - always with dividends.
In my earlier life, I worked as an systems engineer in telecoms and IT. The quantitative, rules-based approach required for this kind of work suits me and has certainly influenced my investing style. I also learned a lot from seeing the tech bubble deflate in 2000/1, when I was working for a large and now defunct telecoms group.
Disclaimer - This is not financial advice. Our content is intended to be used and must be used for information and education purposes only. Please read our disclaimer and terms and conditions to understand our obligations.
Hi shipoffrogs,
Thank you for your feedback.
I chose to focus on high ROCE/ROE instead of operating margin, because low-margin businesses can sometimes still generate consistent high returns for shareholders. In the list above, Computacenter (LON:CCC) might be one example of this.
Equally, high-margin businesses don't always provide strong shareholder returns. There can be various reasons for this, including leverage.
Ultimately, though, the screen reflects my interpretation of Buffett's writings. It's not intended to be a rigid set of rules and others would probably do it differently.
Please feel free to make a copy of the screen and play around with the rules if you'd like to see how the results change when you change individual rules.
Regards,
Roland

Rowland,
I love the concept.
In relation to: Rule #10: Enterprise Value to Free Cash Flow TTM < 25
This rule doesn't seem to be excluding many companies because the highest company score in the screen is EV/FCH = 18.6. A max UK number of EV/FCF <10 would maybe highlight the "don't over pay" candidates. Arguably a low'ish EV/FCF is the most important of the Value parameters.

My manual screening process tries to imitate what I think are his key criteria -
high margins, little or no debt, light Capex requirements, honest management, a fair price and operating a business that looks like it might still be doing well in 10 years time (which often means it was doing well 10 years ago). Simple, but not easy as his sidekick says.
> which often means it was doing well 10 years ago
I agree. In my experience this is usually safer than hoping that a past underperformer will transform itself. Although this does happen.
Roland

I'm surprised Frontier Developments (LON:FDEV) makes the selection, after poor results last year and profit warning in this year. I don't know if it would have been selected a year ago or is it because last year, that the growth looks good?
Think I prefer the Terry Smith selection. I see Gamma Communications (LON:GAMA) is on both but that has not performed very well either.

Thank you Roland. Much food for thought. I am interested to see the importance of Retained Earnings in Warren Buffett's choices. The slow building up of a company that is a sign of solidity, above the interests of shareholders. Buffett was nothing if not cautious.
Warren Buffett's largest holding at 31.12.22 is Apple (NSQ:AAPL) by a long way, he bought over 330,000 shares last quarter, when the price dipped. Second largest holding is Bank of America (NYQ:BAC), he also has large holding in some oil companies. He also likes insurance companies, some I think he owns outright.
Stockopedia has Apple (NSQ:AAPL) as a falling star now. It only passes 8/11 on this screen, Bank of America (NYQ:BAC) only 6/11.
Mark Simpson also did Buffett screen last year, in case you want to see it: https://www.stockopedia.com/sc...

Concerning DCFs, Charlie Munger once said something like this: 'Warren talks a lot about using them but I've never seen him do one'. I think the DCF thing is something Warren does in his head rather than on paper, a rough-and-ready appraisal of what sort of growth will be achieved in the years ahead and whether or not that is reflected correctly in the share price.
Another thing - 20 years ago I saw a carefully researched article showing that despite the often repeated Warrenism that the ideal holding time is forever he is probably the greatest and most successful trader there has ever been. How on earth he manages to buy and sell in the volumes his fund requires is something I do not understand.
Was thinking about Apple (NSQ:AAPL) as a busted flush but as a Mac, ipad, iphone and buds user their seamless inter-connection is not replicated in the Samsung/Android world imo.
So their so called eco-system or moat is strong. A mature business so maybe growth won't be so exponential but a cash generative dividend paying pension hold is probably up Buffetts street.
If Bank of America (NYQ:BAC) gets into trouble then presumably we may as well shut up shop and climb under the mattress with the few gold coins which everyone says should have in your portfolio.
Buffett's history is in insurance. Looked at Sabre Insurance (LON:SBRE) so in the SCVR camp.
Has no debt, cash in bank and assets twice its market cap.
Fell off the cliff from 200p to 100p in July 2022.
The only link is 'insurance' sorry. The days of Buffett looking at small caps has long gone.
The letter is out there on Rolands link. Has made many people so rich they can be philanthropists. The ultimate aim - sort the kids and then put to a good cause J D Wetherspoon (LON:JDW)
I tend to agree that high margins are indicative of pricing power, ie a moat. But the other potential indicator of a moat, in a world where intangibles and intellectual capital define the success of so many businesses, is expenditure on R&D. I would add a filter that screens for high R&D spend, either relative to the sector or to revenues.
Whether such an enhanced screen finds any UK businesses is another matter, as I don’t see much in the way of a moat across the original output of the screen. But you would find plenty internationally.


Thx for this where do you factor in WBs requirement to always buy at a discount to intrinsic value? His "margin of error"


*Past performance is no indicator of future performance. Performance returns are based on hypothetical scenarios and do not represent an actual investment.
This site cannot substitute for professional investment advice or independent factual verification. To use Stockopedia, you must accept our Terms of Use, Privacy and Disclaimer & FSG. All services are provided by Stockopedia Ltd, United Kingdom (company number 06367267). For Australian users: Stockopedia Ltd, ABN 39 757 874 670 is a Corporate Authorised Representative of Daylight Financial Group Pty Ltd ABN 77 633 984 773, AFSL 521404.
Great article - thank you. But I think a screen for high margins belongs here too.