Stockopedia Subscriber Performance Survey 2019

When you strip back all the political and economic turmoil of Brexit, 2019 turned out to be a solid year for UK shares.
That said, things got off to a shaky start. Markets were trading close to new lows as January 2019 got started. But that proved to be the bottom, and the mood turned bullish almost straight away. In fact, this time last year the market was risk-on with investors flooding back into shares.
In the end, it wasn’t quite a vintage year for PIs, but positive momentum was the prevailing trend. A last gasp, post-election rally in the final weeks took the small and large-cap indices up to between 11 and 14 percent for the year. That wasn’t a bad result given the economic unease that still hangs in the air.
But for many savvy investors in the Stockopedia community, 2019 proved to be much more profitable than that.
In recent years we’ve been keen to take the pulse of Stockopedia users. We’ve wanted to find out how confident they are feeling, and of course, how they’ve performed. Last summer, this routine check-up discovered some aches and pains. Markets were labouring and equities were under pressure. Stockopedia’s StockRanks were only moderately outperforming. But in our latest survey, covering nearly 1,200 subscribers, we’ve found things are much healthier...
Stock markets bounce back
In the 2018 Subscriber Performance Survey, published last year, it was clear that the going was pretty tough. Falling markets and moderate StockRank outperformance had combined to put pressure on subscriber portfolios. Back then, just over 50% said they’d outperformed or significantly outperformed the market since subscribing to the service, while 18% had underperformed or significantly underperformed.
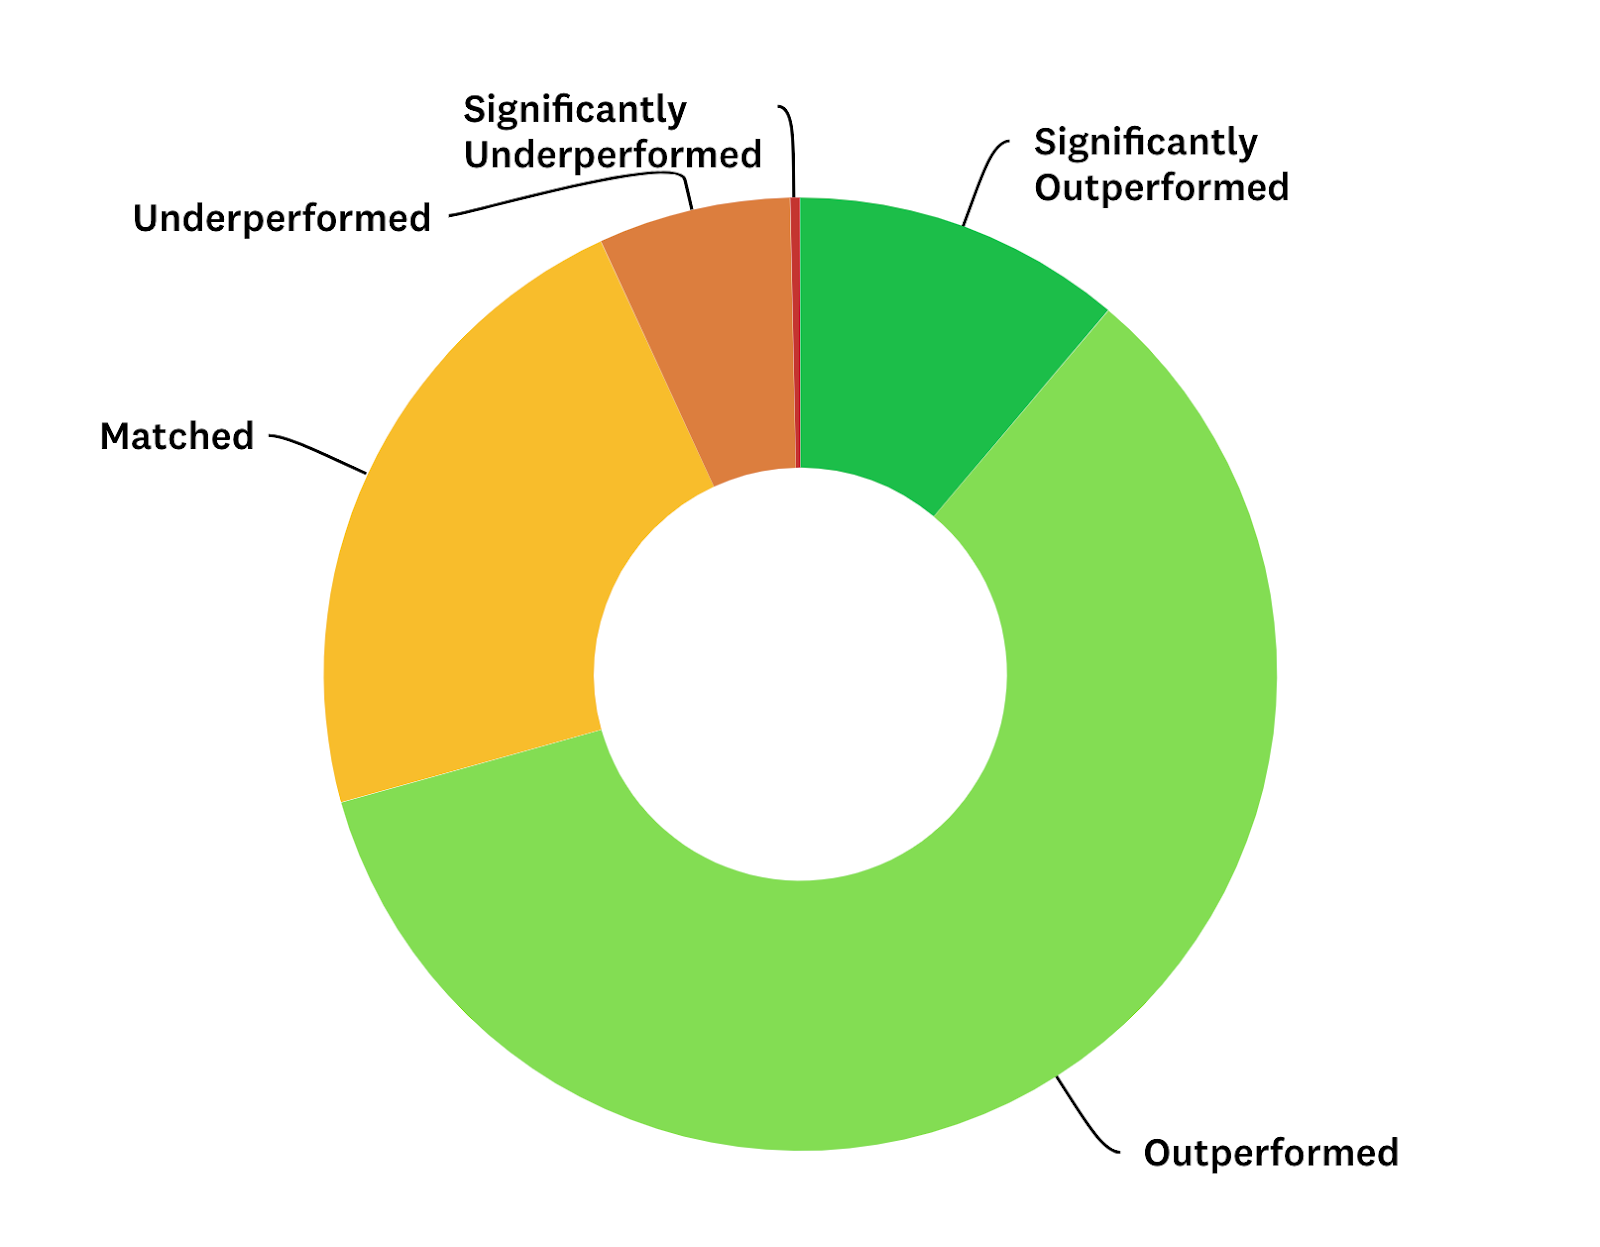
In 2019, the results were much more upbeat. Seventy percent of respondents said they’d outperformed or significantly outperformed the market since joining Stockopedia, with 22% matching the index and just 8% underperforming it.
Since subscribing to Stockopedia has your performance outperformed, matched or underperformed the market?
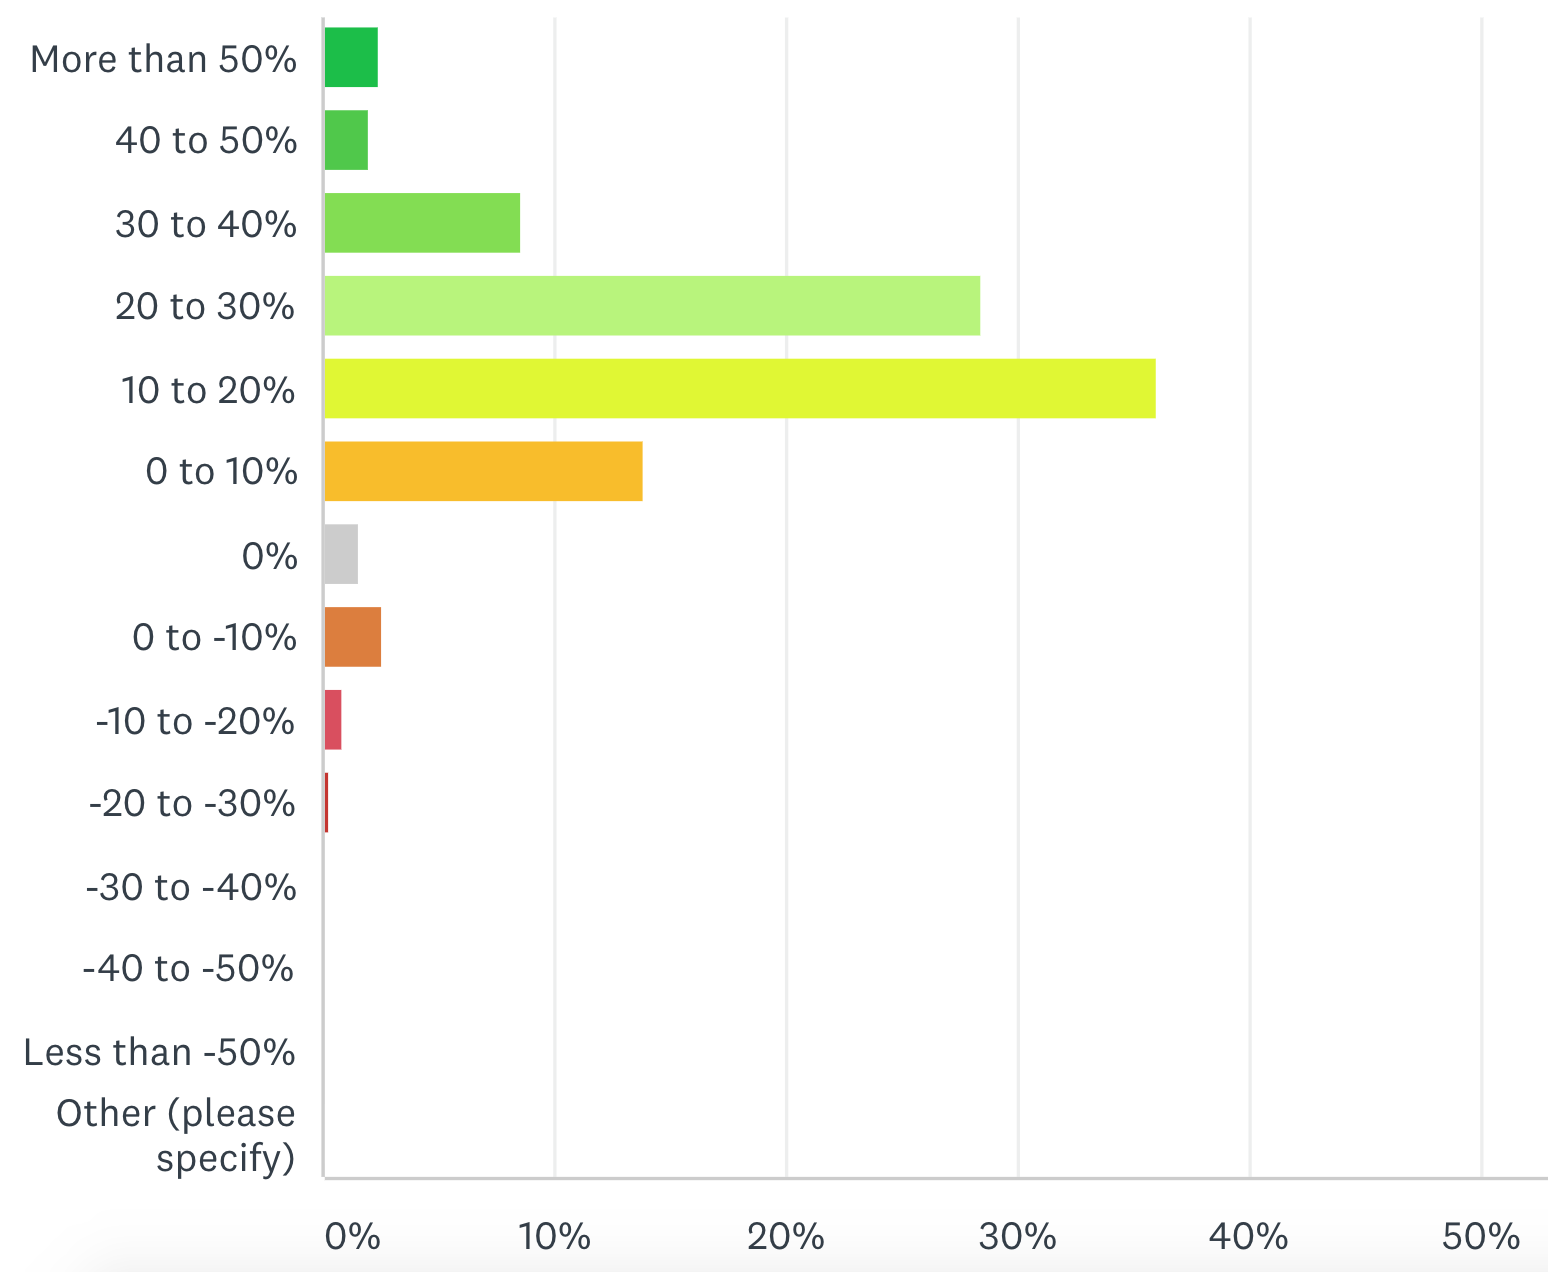
Another big change between 2018 and 2019 was the scale of the average outperformance. In 2018, 45% of respondents said their portfolios had fallen in value by up to 20%, but only around 4% said the same in 2019. As you’d expect, it looks like it was harder to lose money in last year’s buoyant conditions.
In terms of winners, just over a third of respondents saw gains of between 10-20% in 2019. Another 29% of users saw returns in the 20-30% bracket and 14% of users soared through 30%-plus. That’s a very encouraging performance.
What has your 2019 performance been as a percentage year to date?
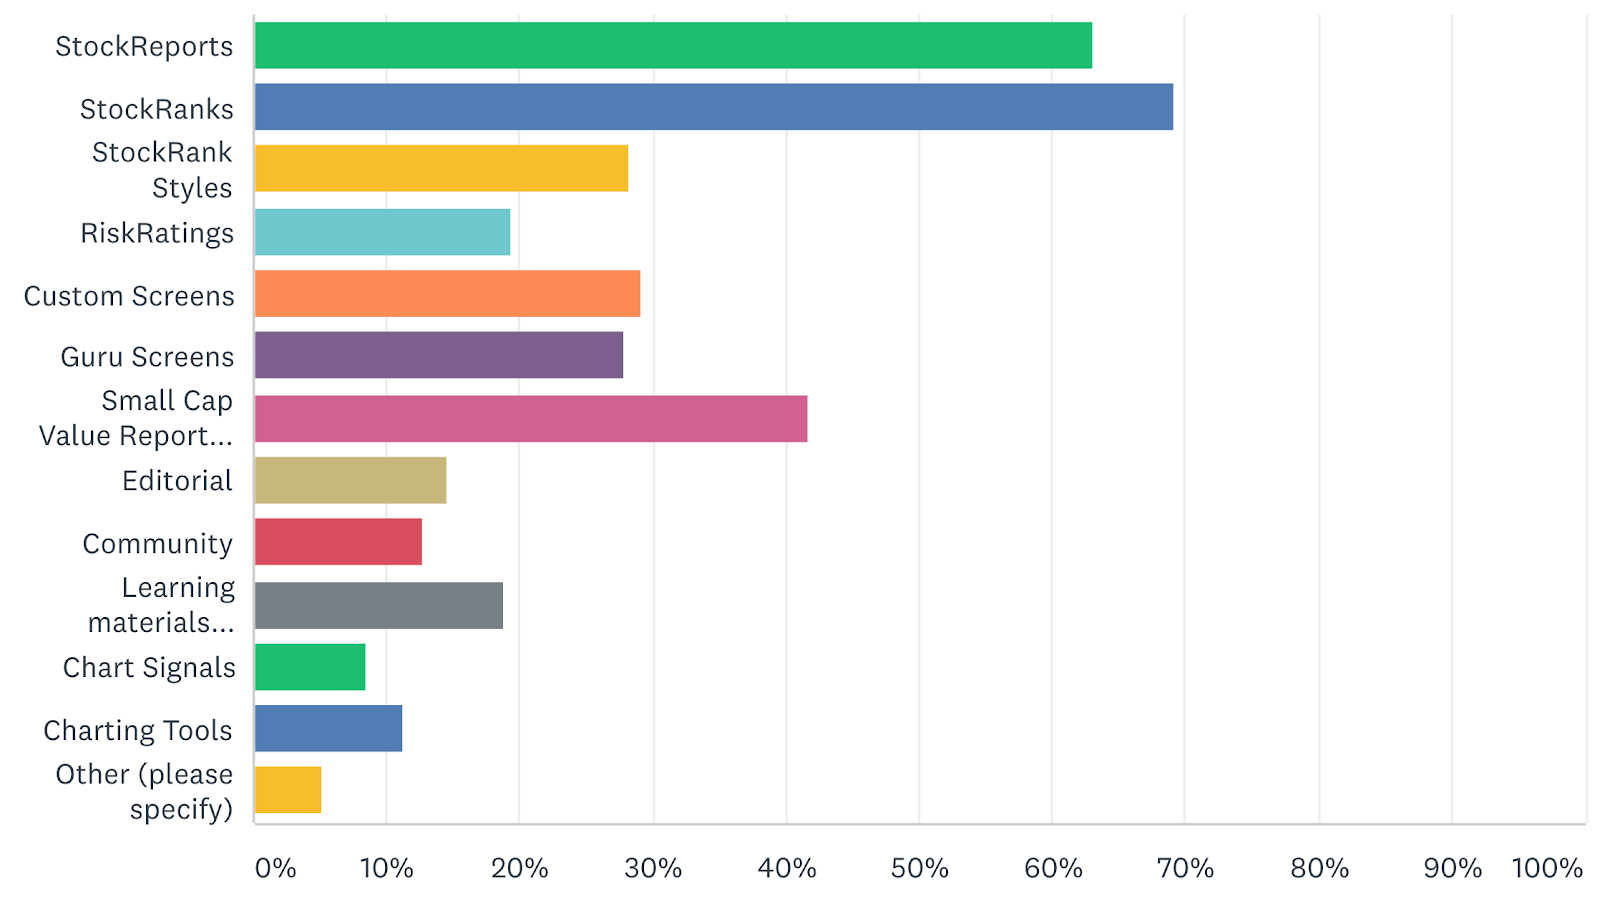
When it comes to Stockopedia features that have helped influence subscriber performance, StockReports and StockRanks are still the runaway favourites. Meanwhile, the daily Small Cap Value Report written by the brilliant Paul Scott and Graham Neary remains a go-to resource for many.
Which features have most impacted your returns?
Pleasingly, the StockRanks remain our most popular tool for investors - with nearly 70% of respondents saying these ranking tools had had the biggest impact on their returns.
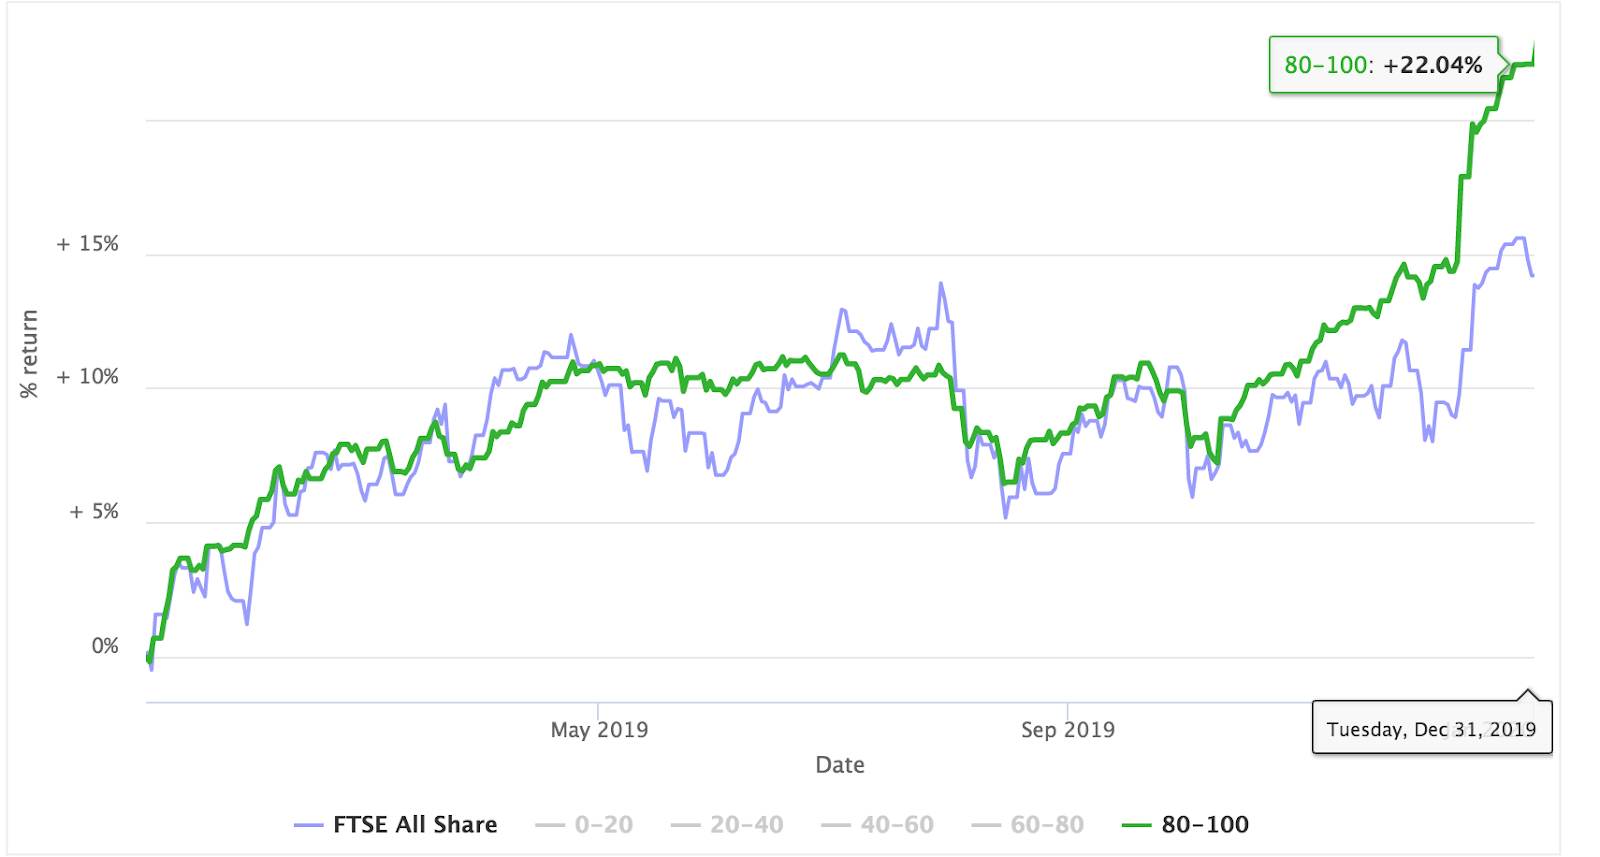
In 2018, the highest ranking shares (with StockRanks of 80+) had a hard time in the market, falling 8% on average and only moderately outperforming the index. Last year, however, the performance was much better. After trending with the rising market through three quarters of the year, high ranking stocks soared in the final quarter - and flew as the market picked up in December. Overall, they came in with a 22% return versus 14.2% from the FTSE All Share.
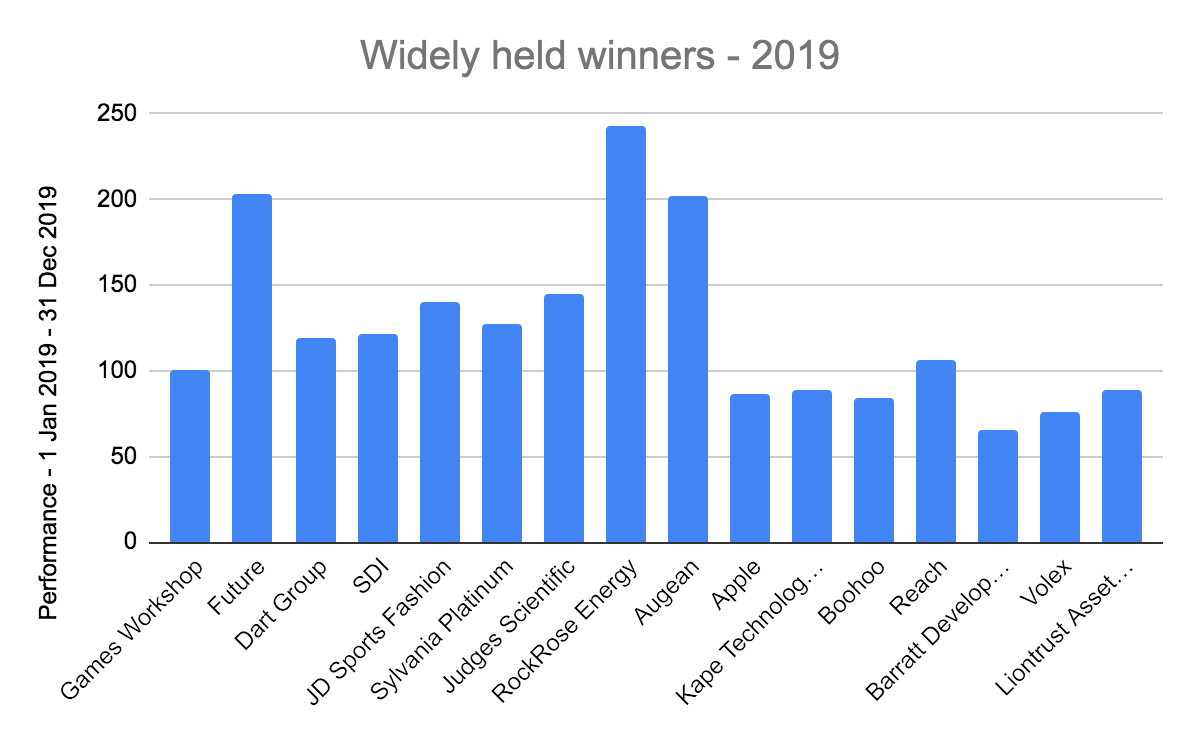
As for the best performing stocks, our analysis once again shows a very broad list of names that our users credit for their biggest wins in 2019. The table below highlights the most widely held winners and how they performed:
Share | Ticker | % of respondents | 2019 Gain % | StockRank Jan | StockRank Dec |
GAW | 6.3 | 100.8 | 91 | 82 | |
FUTR | 2.8 | 203.3 | 49 | 68 | |
DTG | 2.5 | 119.4 | 97 | 95 | |
SDI | 2.4 | 121.4 | 89 | 70 | |
JD | 2.3 | 140.1 | 69 | 78 | |
SLP | 2.3 | 127.1 | 98 | 94 | |
JDG | 2.2 | 144.6 | 80 | 84 | |
RRE | 1.8 | 243.1 | 72 | 92 | |
AUG | 1.8 | 202 | 80 | 89 | |
AAPL | 1.5 | 86.2 | 86 | 90 | |
KAPE | 1.4 | 88.8 | 50 | 61 | |
BOO | 1.1 | 84.5 | 55 | 78 | |
RCH | 1 | 106.7 | 84 | 98 | |
BDEV | 1 | 66 | 91 | 99 | |
VLX | 1 | 75.4 | 91 | 90 | |
LIO | 0.9 | 89 | 79 | 82 |
Here are some of the takeaways:
- 6.3% of respondents said that Games Workshop was their biggest winner last year. Shares in the fantasy wargaming retailer soared by 100% in 2019, continuing a staggering run (it tripled in 2017 and had a strong year in 2018). Indeed roughly the same percentage of respondents credited GAW for their biggest gain in 2018, too.
- The second most widely held winner last year was the publishing group Future, which unleashed a 203% gain. That was followed by the airline and logistics group Dart, which saw its share price take off in the aftermath of the collapse of Thomas Cook.
- The biggest gain in this top list was at the oil & gas development company RockRose Energy, which saw its price rise by 243% in 2019. The move was triggered by a deal to buy production assets in the North Sea from Marathon Oil.
- Apple was the only non-UK quoted stock to make the widely held winners list. The shares had another phenomenal year in 2019, and it breached the GBP £1 trillion market cap level in the first week of January this year.
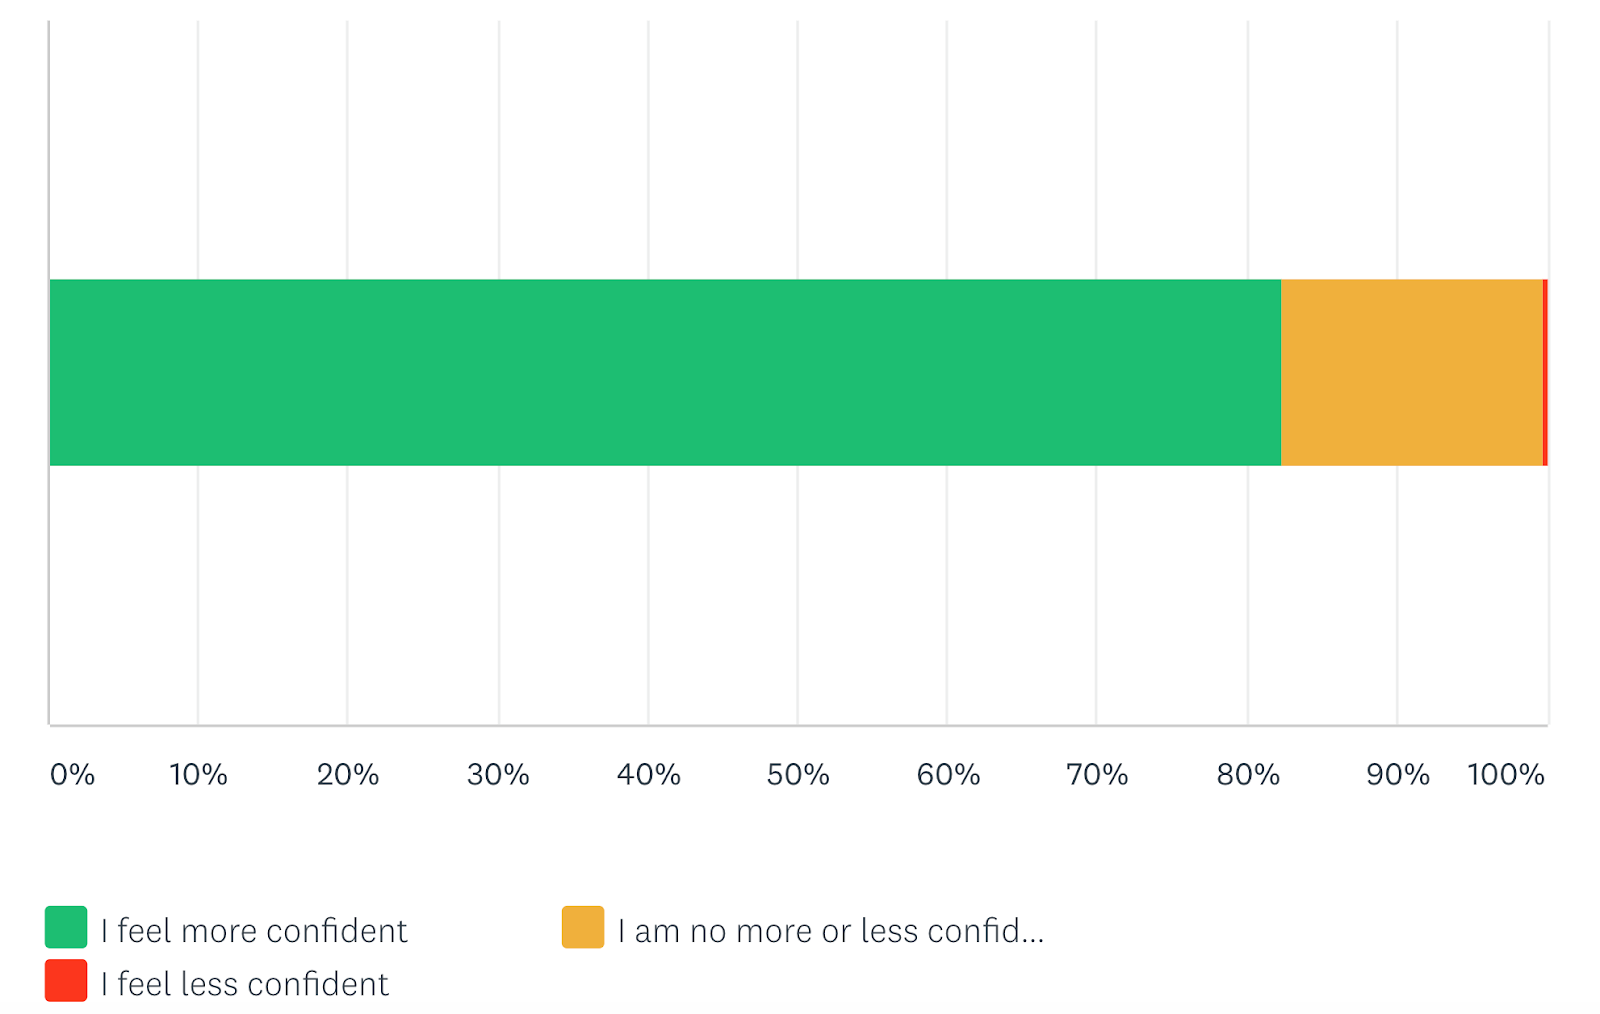
Given the success of 2019, you might expect confidence to be on the up among Stockopedia users, and that’s certainly what we found. More than 80% of respondents said they feel more confident in their understanding of the stock market since using the service. That’s up from around 75% in 2018.
Do you feel more or less confident in your understanding of the stock market since using Stockopedia?
Finally, how do Stockopedia users view themselves? What sort of investors are they and how much experience do they have?
Well, of all the respondents to the survey, broadly 30% defined themselves as Systematic Investors, another 30% defined themselves as Income/ Quality/ Buy-and-Hold Investors and around 25% said they were Active Stock Pickers - those three areas cover what we like to call the Farmers, Owners and Hunters. Traders and more novice (or undecided) investors made up the balance.
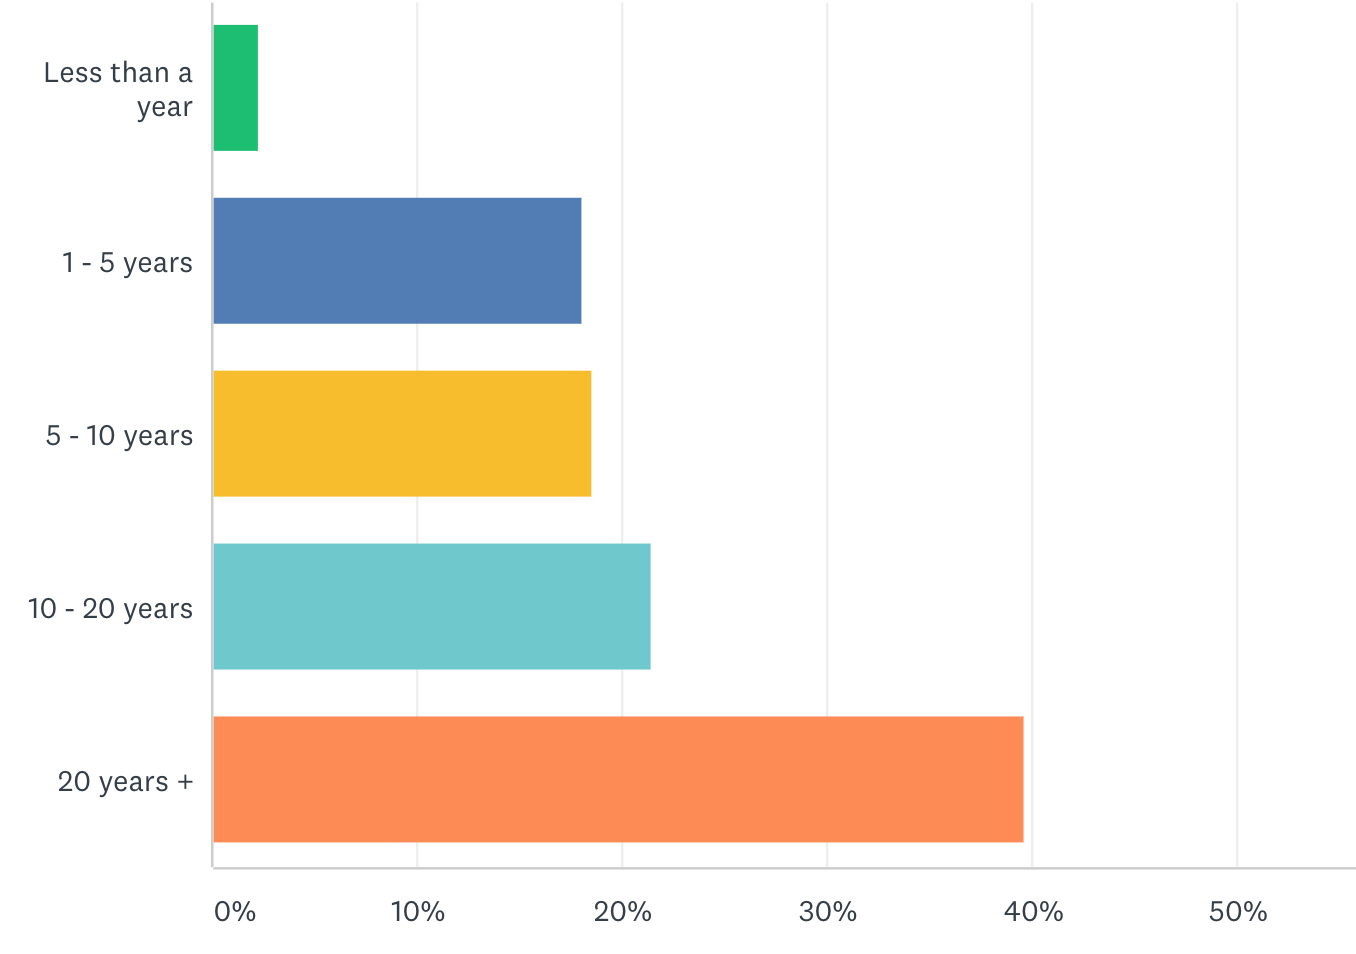
In terms of experience, the Stockopedia community has a fairly broad range of years spent investing, with nearly 40% of respondents saying they've got more than 20 years of experience behind them:
How many years have you been directly investing in shares?
Once again, thanks to everyone who completed the survey. The responses offer a fascinating view of the Stockopedia community and how it is performing on average. It’s useful not just for readers but in shaping the ideas for new tools and site features in the future, so we really do appreciate it.
As ever - Safe investing

About Ben Hobson
Stockopedia writer, editor, researcher and interviewer!
Disclaimer - This is not financial advice. Our content is intended to be used and must be used for information and education purposes only. Please read our disclaimer and terms and conditions to understand our obligations.

I'm a young subscriber - only a few months old - I like the style of the small cap value report but I think there is waaay too much time and space devoted to small caps. I know from experience that small caps are very risky bets no matter the fundamentals. I'd like to see much more coverage of mid and large caps in a value report format.

@prem14 - not everyone responds to survey requests. So they are a sample based on whoever responds.
.png)
Crikey. By the time you're a toddler, you'll be giving Warren Buffett a run for his money!

"In terms of experience, the Stockopedia community has a fairly broad range of years spent investing, but there’s a clear majority with more than 20 years of experience behind them".
No there isn't - there's a sizeable minority.

I agree! To be fair there has been an improvement in this area with the SIF portfolio and articles by Jack Brumby, Michael Taylor and others but personally I would love a 'Midcap report' if possible as thats where most of my investing goes. in fact hows this for a daily diet:
Small Cap report
Mid Cap report
Large cap report
Market sentiment report and finally:
TA report ( Break outs/Break downs etc)
Expensive wish list huh? Well yes but i think most on here are on board with paying for quality. If your serious about investing why would you not be?


No problem. I'm afraid that, along with directly investing in shares, I also have more than 20 years of experience of being a pedant.

Hi Susan
I have to disagree that there is too much coverage of small caps. It is that there is too much coverage of large caps elsewhere (IC, Shares Mag etc) and the likes of £HL promoting funds. But also, all the research shows that a portfolio of well chosen small caps will out perform same of large caps over the medium to long term.
My two examples would be Boohoo (LON:BOO) which is showing a 54% CARG since I invested in November 2015 and Games Workshop (LON:GAW) which is showing a 10 year CARG of 34.3%. Unfortunately I have only held GAW for two years.
So please Stockopedia keep covering the small caps and more!

Hi Susan - thanks for the feedback. It's certainly something we commonly discuss and I certainly am not ruling it out !

Personally I like small caps and put (too much!) of my money there. However, I would also like a regular Mid or even Large cap column on Stockopedia.
To add value, this would have to be differentiated from the publically available analyst reports (although these are not easy for all to access). I think the differentiator could be the Stockopedia community and the DYOR research, self- educating-whilst-listening -respectfully-to-good-peers philosophy that underpins it ie (as per the SCVR) the value is HOW it is analysed as much as the insights it generates.
Key to me is editorial regularity and direction - eg we get a 'Large or Mid-Cap analysis' of something every Friday say but within parameters set by Stockopedia (XX words, educative in tone etc). I think the community would build on that. Apart from the daily SCVR, the other regular contributors seem to write on a schedule I can't anticipate.
*Past performance is no indicator of future performance. Performance returns are based on hypothetical scenarios and do not represent an actual investment.
This site cannot substitute for professional investment advice or independent factual verification. To use Stockopedia, you must accept our Terms of Use, Privacy and Disclaimer & FSG. All services are provided by Stockopedia Ltd, United Kingdom (company number 06367267). For Australian users: Stockopedia Ltd, ABN 39 757 874 670 is a Corporate Authorised Representative of Daylight Financial Group Pty Ltd ABN 77 633 984 773, AFSL 521404.
.JPG)


Regarding this statement -> "...covering nearly 1,200 subscribers". Why do you not cover all your subscribers? Surely it is not an infinite number.