
Good morning!
After what feels like a manic week, it's nice to have a Friday that isn't bulging with news flow.
Following on from my comments yesterday on US markets, Facebook finished down 19% and is now trading at a forward P/E ratio 21x (using Stocko numbers). That's low enough to get me interested. So I'm tempted to have a dabble.
The NASDAQ fell by 1.4% yesterday, and is up by 26% over the past year (according to Bloomberg). So the end of the world has not arrived yet, despite all the scary headlines!
Today we have:
- Scientific Digital Imaging (LON:SDI) - final results
- Jupiter Fund Management (LON:JUP) - interim results
- Gear4music (LON:G4M) - trading statement
- Seeing Machines (LON:SEE) - OEM design award
Scientific Digital Imaging (LON:SDI)
- Share price: 44.55p (+10%)
- No. of shares: 90 million
- Market cap: £40 million
This is an acquisition group making niche scientific products.
I last covered it in January, at the interim results statement.
At the time, I said it looked fairly valued. The share price has gone on to increase by an additional 50% since then! It's making fresh all-time highs today.
My concerns have centred around SDI's increasing share count. The pace at which the share count was increasing made it extremely difficult to predict the future of the company and the likely returns for existing shareholders, in my view.
However, it has been suggested that growth in the share count is going to slow down now, and that future strategy could be more along the lines of Judges Scientific (LON:JDG) (i.e. using some debt from HSBC and internally generated cash flows to fund deals, rather than relying primarily on new equity).
Let's now take a look at these results:
- revenue increases from £10.7 million to £14.5 million. 31% of the revenue growth is organic, so by my calculations the organic revenue growth is £1.2 million.
- gross margin improves to c. 66% (SDI has been collecting companies that have a supplier/customer relationship, so this is unsurprising)
- operating profit nearly doubles to £1.8 million, or £2.1 million before one-off costs and share-based payments.
Capitalised development spending: SDI capitalised £600k of development spend, instead of putting it through the income statement.
At the same time, it did put an amortisation charge on its income statement (i.e. writing down previous development spend) of £530k.
These numbers are close enough to balancing out, so I wouldn't view it as suspicious.
Earnings per share makes a huge percentage increase to 1.79p per share.
That's a great result. The acid test of performance for me, however, is return on capital employed (ROCE).
ROCE is the test which can trip up a rapidly-expanding business even when all the other metrics (sales, operating profit, EPS, etc) are looking good. It punishes a company for expanding its capital base without generating sufficient returns on this new capital.
I will use a simple textbook definition: EBIT / Capital Employed, where Capital Employed is the average value of total assets (less current liabilities). There are other ways to define it, but this is a straightforward method. I will add back the one-off acquisition and fundraising costs to EBIT.
Feel free to look for errors or pick holes in my calculations:
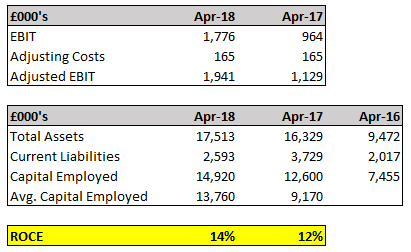
The bottom line is that I think SDI's ROCE has improved in FY 2018.
That's a fine achievement, especially considering that it was carrying a lot of fresh capital.
The last major fundraising was in December 2016, and I have taken the timing of this fundraising into account when calculating the Avg. Capital Employed during FY 2017.
I should mention that Stockopedia takes a stricter view and calculates trailing ROCE at 10%.
Anyway, tihs result means that I'm automatically going to take the view that management are allocating capital in a reasonable way - the numbers say that they are.
Trying to understand the underlying businesses is a separate matter, and a huge task. We have the following companies and brand names:
- Atik Cameras, Opus Instruments, Quantum Scientific Imaging, Applied Thermal Control, Astles Control Systems, Sentek, Synoptics, Syngene.
Some of these are contributing organic growth, and the group as a whole is clearly doing well in the aggregate. That's really all we can ask for! It seems to have a healthy amount of diversification now.
Dividend - not yet, but the matter is "under review". If the company can continue deploying capital at a 14% return, I think it would make sense not to pay one yet.
Outlook - confident of "profitable growth through increased revenue and new acquisitions in 2018-19".
My view - I didn't think I would be saying this, this morning, but I've seen enough now to buy into what SDI management are doing. The plan has been executed and has succeeded so far.
With improved diversification and with the increase in share count hopefully slowing down, it now looks to me like a lower-risk investment with the potential for compound growth.
This is reflected in a much higher share price, so I am a bit late to the party. Well done to those who backed it at an earlier stage!
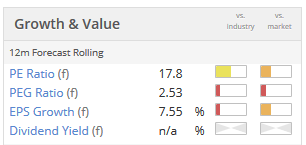
It's not priced at bargain levels any more, and that is fair enough:
Jupiter Fund Management (LON:JUP)
- Share price: 421.55p (-5%)
- No. of shares: 458 million
- Market cap: £1,929 million
A quick word on this fund manager.
This has been on my watchlist for a while for a potential purchase, and I do consider it to be in value territory at the moment.
EPS of 17.3p has been achieved in H1 2018, a small improvement compared to the equivalent period last year.
I think the last 12 months of EPS add up to 35p. So we have a trailing P/E ratio of 12x.
The problem is client net outflows and a reduction in AuM.
From a competitive point of view, mainstream fund managers are at risk of losing out in the battle for AuM as traditional active management looks somewhat dated, except for those managers with a very strong track record and/or expertise in a specific niche.
Encouragingly, it is disclosed that Jupiter's fund outflows were "driven by redemptions from a single product within our fixed income strategy". Most products appear to be doing ok.
Margins are likely to fall gradually over time, and FY 2018 EPS is likely to show a small reduction versus FY 2017 EPS.
Despite that, I think these shares represent an interesting opportunity.
The balance sheet is fine and management have expressed confidence today by raising the dividend.
Jupiter has paid a special dividend every year for the past four years, and yet even if we exclude that, the yield is currently 4.3% (with it, the yield is more like 8%).
You do have to form a view on the outlook for active managers, which is undeniably rather mixed. But as Impax Asset Management (LON:IPX), Miton (LON:MGR) and others have shown, there is still plenty of demand for some active managers.
Gear4music (LON: G4M)
- Share price: 676p (+3%)
- No. of shares: 21 million
- Market cap: £141 million
AGM Statement and Trading Update
This has been a favourite of Paul's, who last covered it in May. I wrote about it in March.
The CEO doesn't give too much away today. Trading is in line with expectations:
"I am pleased to report that revenue growth continues to be strong into what is a highly competitive market, and the projects to relocate our Swedish distribution centre and upgrade our UK distribution facilities are on-track to be delivered ahead of our peak trading period."
I perhaps shouldn't have included this in today's report, since it's such a brief statement. But I suppose when expectations are upgraded or downgraded next, this can act as a bookmark for people checking back in the archives.
For me, much of the value is in G4M's potential to develop its own-brand products, which were last reported at 26% of total sales. I wouldn't be interested to pay a heavy valuation for something that is just a distributor.
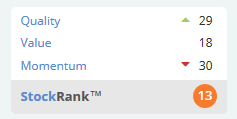
The StockRanks aren't convinced yet, calling this a Sucker Stock:
Vertical Integration
Seeing Machines (LON:SEE) announced a new OEM design award today, but I honestly have no idea what that company is worth. So instead I'll finish today's report with a simple illustration of an important concept mentioned in the comments: vertical integration (when a company owns its supply chain).
Suppose we have two companies: Supplier Co. and Client. Co.
- Supplier Co. makes products only for Client Co.
- Client Co. purchases inventories only from Supplier Co.
- They each make a gross margin of 33%
This is what they look like separately. The transaction value between them is shown with a grey background:
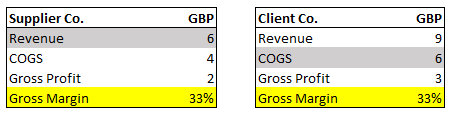
In other words:
- Supplier Co. buys inventories for £4 and sells them for £6 to Client Co.
- Client Co. buys inventories for £6 from Supplier Co. and sells them for £9.
Now suppose the two companies are merged instead of operating separately.
The new, consolidated financial statements don't show the £6 transaction value between Supplier Co. and Client Co.
Instead, the income statement looks like this:
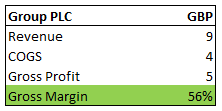
Only the revenue and COGS that relate to external parties are shown, i.e. the £9 sale by Client Co., and the £4 inventory purchase by Supplier Co.
The gross profit of the combined group is the same as the sum of the gross profits of its subsidiaries.
The gross margin (56%), on the other hand, is now bigger than the gross margin of each of its subsidiaries.
This is vertical integration in simple form!
It's been a busy week. I hope you have a relaxing weekend!
Best wishes
Graham
See what our investor community has to say
Enjoying the free article? Unlock access to all subscriber comments and dive deeper into discussions from our experienced community of private investors. Don't miss out on valuable insights. Start your free trial today!
Start your free trialWe require a payment card to verify your account, but you can cancel anytime with a single click and won’t be charged.