Browsing the Guru Screens
Many of the the world’s most successful investors, like Benjamin Graham, Warren Buffett and Joel Greenblatt, have shared their strategies quite openly in letters, books and interviews over decades. At Stockopedia we’ve studied, codified and modelled these rules in a wide range of 67 ready to go “Guru Screens”. These screens contain literally hundreds of years of combined wisdom that you can use or duplicate with ease.
Whether you're looking to research the qualifying stocks on the lists to find winners, or study the ways that financial data can be used in screen construction, the Guru Screens are a goldmine for the curious or time-poor investor. Let’s dive right in and learn how to use them.
The Guru Screens categories
Guru Screens can be found on the local navigation menu that appears when you click Browse.
To make life easy, we include some of the most popular Guru Screens on the main Browse page. Just click the horizontal arrows to scroll through them.
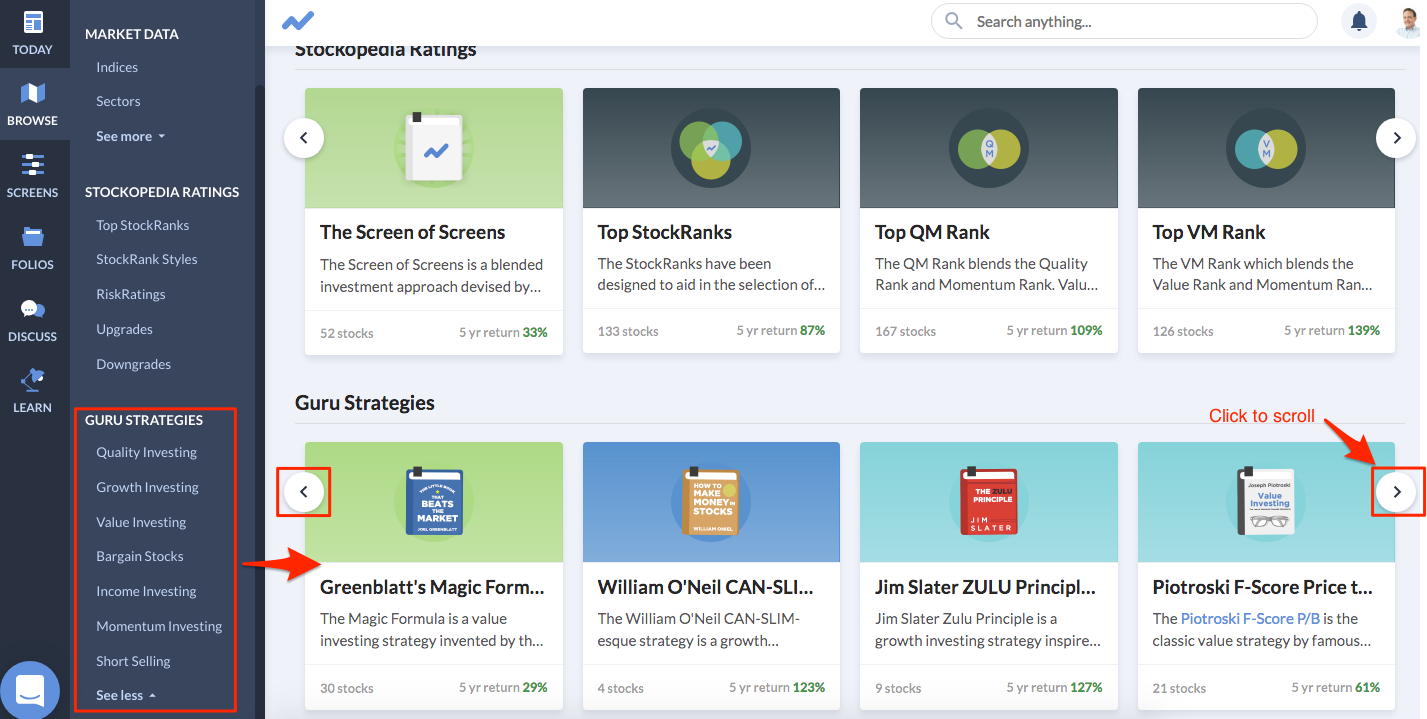
To begin exploring the full Guru Screens categories you first need to select an investing style from the menu. Here is a breakdown of those style categories and what they mean:
Quality Investing
The hallmarks of a high quality business tend to show up in consistently strong profitability, efficiency and financial strength. These shares can often be fully-priced, but they offer comfort to investors who prefer stability over speculation. The Buffett-Hagstrom Screen is a good example of this style of investing.
Growth Investing
Growth stocks are generally characterised as being in the early phases of their life cycles. It’s a period associated with rapid and increasing expansion in sales and earnings with still-reasonable profit margins. An example of a classic growth screen is theJim Slater Zulu Principle Screen.
Value Investing
Value investing is one of the most popular and profitable long-term styles. It hinges on finding shares that are misunderstood and mispriced by the market and holding them until the value of those shares rises. One example of a classic value screen is Joseph Piotroski’s F Score
Bargain Investing
Hunting for bargains is an extreme interpretation of value investing. It involves buying out-of-favour and potentially stricken shares in the expectation that at least some of them will recover and flourish. The classic bargain hunting style is epitomised in the Benjamin Graham screens.
Income Investing
Dividend investing targets companies that regularly return excess cash to their shareholders. These strategies range from high yield to long-term dividend growth. Perhaps the most famous income screen is known as the Dogs of the Dow screen, popularised by Michael O'Higgins in the early 1990s.
Momentum Investing
Momentum is one of the most powerful forces in the stock market. There are strong reasons why recent trends tend to persist, whether it’s a rising share price or a company that beats forecast expectations. An example Momentum screen is the 52 Week High Screen which selects the strongest stock performers over the last year.
Short Selling
Betting that a share will fall in price, rather than rise, is anathema to many investors. Yet professional short sellers are expert company analysts. Their red flags can point to particularly risky shares that might be worth avoiding. An interesting short-selling screen is the one outlined by James Montier.
Guru Screens lists
After clicking a Guru Screens category, you'll see a full list of strategies that fit with that investing style.
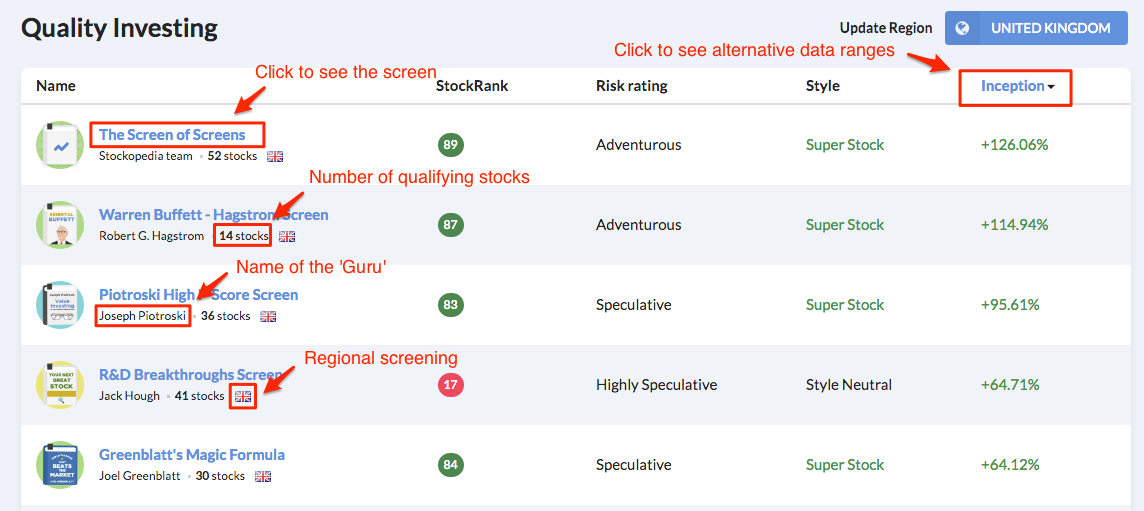
Each strategy listing includes various information about it, including:
- A link to the screen
- The name of the 'Guru'
- The number of stocks currently passing the screen rules
- Your regional screening setting
- Average StockRank, RiskRating and StockRank Style of the stocks currently passing the screen rules
- Performance history of the screen (which you can adjust at the top of the column)
Click here to see what you'll find when you start exploring a Guru Screen
Composite Performance
Rather than simply modelling the rules used by the legends of finance, we also track the daily risk and returns of these strategies, too. We build portfolios of equal weighted positions using the top 25 stocks qualifying for each Guru Screen and rebalance them quarterly. Frictional trading costs are not taken into account which allows clearer comparison of risk factors across screens.
Don't forget! Historical performance is not an indicator of future returns.
Tracking and Rebalancing the Guru Screens
The qualifying lists of stocks for each screen updates daily based on price movements and fundamental changes.
However, we also track all the 60+ Guru Screens available on Stockopedia as baskets. Some of these strategies may originally have been much longer-term buy-and-hold deep value strategies but - for tracking purposes at least - we rebalance all of them strictly every three months at the end of March, June, September and December.
The portfolios are checked every quarter to see which stocks are qualifying for the original screening criteria. We then sell any stocks that are no longer qualifying and replace them with stocks that are qualifying strictly according to the quantitative criteria, while reducing or increasing the position size for any stocks that are still qualifying.
All stocks become equal weighted in each portfolio at the point of each rebalancing date. Our tracked baskets are therefore snapshots of the constantly changing lists at a moment in time.
Why Quarterly?
This rebalancing is done each quarter as otherwise it wouldn't be very representative if it was done more frequently (i.e. daily or weekly), given that we don't factor in frictional trading costs. This would also increase the probability of a stray data error (e.g. a stock split) impacting the results.
In the real world, this level of trading activity may still involve significant trading and tax costs for smaller investors. Our original research into the cost effectiveness of "running your own fund" found that £50,000 fully invested in 25 stocks will cost around 1.96% annually to run. You can read more about that research here.
In the next section we’ll look at what you'll find when you start exploring a Guru Screen.
Using the Guru Screens
It is important to understand in depth the risk profile and return characteristics of any Guru Screen used to uncover investment opportunities. By reading the background and browsing through the screen lists generated, you can get a good sense for the kind of companies that a screen favours and any industry/risk concentration that a given screen may generate.
When determining which screen(s) you might want to follow, it's worth asking yourself the following questions:
- Does the screening approach match my individual needs and risk tolerance?
- Is this style of investing more suited to bullish or defensive market conditions?
- How is this strategy likely to react relative to the current market environment?
- What is the proper benchmark to measure the performance of this screen (in terms of market capitalisation, industry concentration, growth vs. momentum)?
- How frequently does the list of qualifying companies change?
Most importantly, remember that screening is just the first step on a journey. There are qualitative elements (such as the calibre and honesty of the management team) that cannot always be captured effectively by the quantitative screening process that we describe. Detailed fundamental analysis of any stock you are considering for purchase is important for successful investing.

