Reviewing a stock's essential statistics
At the top of every StockReport, before all of the deeper analysis and detail, is a horizontal row providing some key statistics required for rapidly vetting any share. It’s often possible to decide whether to continue researching a stock just by reading this section. It contains basic information about every listed company:
- Classification: Name, Sector, Industry, Style and Risk
- Size: Market cap, Enterprise Value, Sales and Position.
- Trading Details: Symbol, Price, exchange & liquidity.
- StockRanks: Quality, Value, Momentum and overall QVM.
StockRank™ Widget
Every company on Stockopedia is analysed for its Quality, Value, Growth and Momentum across hundreds of fundamental and technical metrics. They all come together in our proprietary set of composite StockRanks, the entry point to the StockReport found in the top right of every page. For many subscribers this is the first thing they eyeball on any stock.
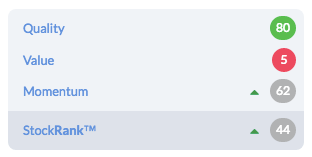
Every stock is ranked from zero (worst) to 100 (best) across each of these axes - Q, V and M. These are then combined into an overall Stockopedia StockRank™ that has regularly beaten the market both in backtests and in our live performance tracking.
Reading the Ranks
We have extensive learning resources about each of these rankings in other sections, but to understand them in brief:
Quality Rank - ’good stocks beat junk stocks’.
High scoring stocks by this measure will be profitable, cash generative, high margin, low debt businesses that rarely issue shares. Low scoring stocks will be speculative, cash consuming companies that often disappoint.
Q: Why do good stocks outperform?
A: They tend to be boring businesses, and most investors shun them as they prefer excitement - but paying for excitement tends to prove expensive.
Value Rank - ’cheap stocks beat expensive stocks’.
High scoring stocks will be cheap on a range of measures versus what they own and what they earn and often out of favour with investors. Low scoring stocks will be expensive and often adored by the market.
Q: Why do cheap stocks outperform?
A: Cheap stocks often have problems, and most investors shun them as they prefer the safety of consensus - but consensus rarely pays.
Momentum Rank - ’winning stocks beat losing stocks’.
High scoring stocks will have rising share prices, often at new highs, with brokers increasing their earnings estimates. Low scoring stocks will be trading at lows with brokers cutting their numbers.
Q: Why do winning stocks outperform?
A: Stocks at new highs are hard psychologically to buy, so most investors shun them, preferring the purchase of ‘bargains’ at lows - but trend following works.
QVM StockRank - good, cheap, improving stocks beat expensive, deteriorating junk.
This measure equally blends the Quality, Value and Momentum ranks into our core metric - the StockRank.
We recommend learning as much as possible about these incredibly useful statistics in these two other areas of the guide:
- the StockRanks Basic Definitions - where you can learn about how the ranks are composed and how to use them.
- the StockRanks Guide - where you can learn how to hunt for high ranking stocks and track the performance.
The StockRank Deltas
It’s always useful to know in which direction each of the StockRanks is moving. In the StockRank widget, next to each of the ranks there appear the occasional green or red 'arrow' showing the latest movement of the rank, up or down.
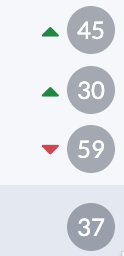
We call these the “StockRank Deltas” and in order not to overwhelm we've set this feature to only print on the page if the rank has moved by plus or minus 5 over the last 30 days. This gives a good indication of recent StockRank movement without being too noisy. You can hover over the arrow and see by how much the StockRank has changed over that time frame.
The picture above illustrates neatly how Value and Momentum can move in opposite directions at the same time without impacting the overall StockRank. The stock in question has got 'cheaper' (so the Value Rank has improved) but the stock has plunged to newer lows on the oil price collapse (so the Momentum Rank has fallen).
Classification
Risk Rating, Size Group and StockRank Style
Beneath the company quote is a set of three proprietary classification labels - the Risk Rating, Size Group and StockRank Style. These labels, in combination with the StockRanks provide an unparalleled instant insight into what kind of stock (and company) you may be dealing with.
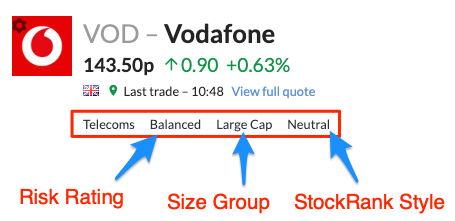
- Risk Rating - a five tiered rating of share volatility from Conservative, through Balanced, Adventurous, Speculative and Highly Speculative.
- Size Group - a four tiered rating of the company size from MicroCap through Small Cap, Mid Cap and Large Cap.
- StockRank Style - an nine tiered rating of stock archetype. Four winning styles coloured green (super stock, turnaround, high flyer and contrarian), four losing styles coloured red (sucker stock, value trap, momentum trap and falling star), and an unclassified/neutral style coloured grey. Learn more about the StockRank Styles here.
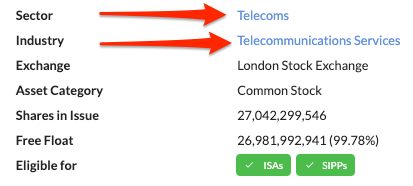
Sector & Industry
While a company’s name shouldn’t need any further explanation, its sector and industry classification probably will. At Stockopedia we lean on the Refinitiv TRBC classification, which is a 5-deep hierarchy of sector classifications. The TRBC method has been shown to be more ”objective and robust” than other popular classifications such as those promoted by FTSE, SIC or GICS. We provide a detailed explanation of how this classification works in Our Data guide.
At the bottom of the StockReport we show two of these sector classifications for the company. The first is the Economic Sector (one of 10 broad 1st level classifications) and the second the Industry Group (one of 54 3rd level classifications). These give an instant fix on what part of the economy the company’s activities lie in and they also act as hyperlinks to the relevant sector table listing pages in the Directory. There you can compare the essential statistics side by side with a broad peer group of stocks.
While the vast majority of companies in the world only have a single listing on a single stock exchange, there are many that have more. Some stocks may seek to raise capital on more than one stock exchange by seeking a ‘dual listing’. Others may seek to improve liquidity in their shares by listing “depository receipts” on a foreign stock exchange - e.g. US investors may be familiar with foreign stocks that trade in dollars as ADRs.
As a result of these multiple listings there can be more than a single StockReport on Stockopedia for each company. Where this may be the case we flag the type of share.
Trading Details
We publish the summary quote data underneath the company name.
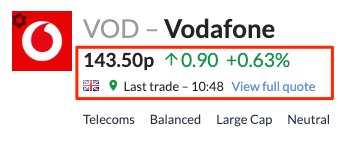
Reading from left to right this data provides the company Ticker Symbol, Exchange Country Flag, Price, Change in Price, Percentage Change in Price, Time of Quote and Exchange Market Size. Let’s take a look at these in a little more detail.
Ticker Symbol & Exchange Flag
The Ticker Symbol is a unique code of up to 5 characters which is used as a shorthand for trading the stock on a specific stock exchange. You’ll probably use this symbol to trade the stock at your brokerage. They’ve become known as ‘ticker’ symbols due to the old ‘ticker tape’ machines that were used to communicate prices in bygone days - they literally used to ‘tick’ out the prices one by one.
Ticker symbols are unique on each stock exchange but the same ticker can often be found for a different security on a different stock exchange. If you only trade a single market you won’t have many problems with ticker mismatches but if you trade on multiple exchanges at some point you might get confused by seeing the same ticker used for a different security. Try typing ABC into the Stockopedia search panel and you’ll likely find Abcam in London, ABC Data SA in Poland and Amerisource Bergen in the US all with the same symbol.
The Exchange Country Flag is a visual indication of the country in which each stock exchange is located. By hovering over the flag you can see the precise details of the stock exchange as there can be more than a single stock exchange in each country. We publish data from 9 consolidated US stock exchanges so it’s always worth checking which exchange a particularly stock is quoted on.
Quote Price, Change and Percent Change
Depending on the stock exchange we publish either real-time, 15 minute delayed or end of day pricing data. Please check the Technical Guide for details for the quote delay in each market.
The latest price, the change on the day and the percentage change on day are published. The time of the quote is also published. When markets are closed we publish the last close price. At the start and end of the day there can be unusual price movements - these are often due to ‘auction’ periods.
EMS - Exchange Market Size
Some stock exchanges (e.g. London Stock Exchange) set a minimum deal size that all participating market makers are obligated to quote to buy and sell shares on the stock market. This deal size is known as the ’exchange market size’.
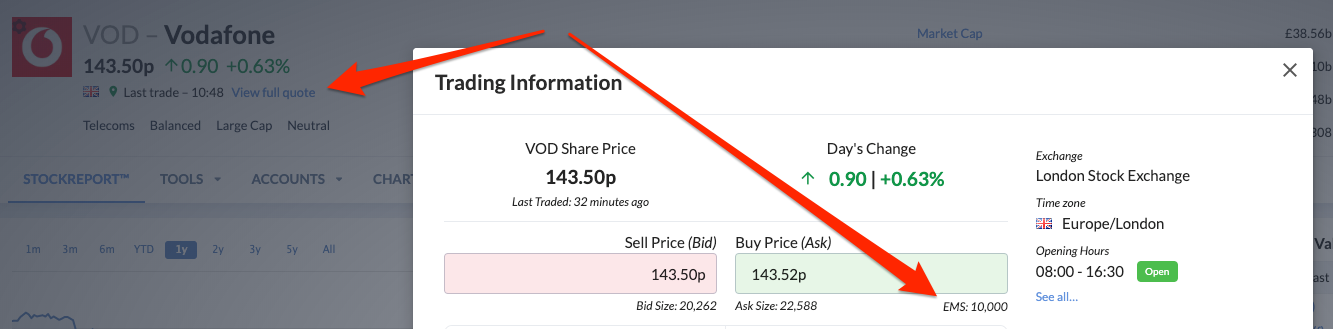
For individual investors this is a very important number because it indicates how much you can be guaranteed to trade at the quoted price. If your buy or sell order is larger than the EMS then you may find that you can only buy at a higher price than is quoted. It’s worth setting limit orders (rather than market orders) if you are worried that your deal size may exceed the EMS.
Size
One of the great advantages individual investors have over institutional investors is their ability to invest in smaller companies. While there are many standout examples of large companies that go on to become far larger, small caps as a whole tend to outperform large caps - and that gives you an advantage.
The legendary investor Jim Slater built much of his investment fortune on the theory that “elephants don’t gallop”, so learning to judge a company’s size is essential. We provide a few statistics to eyeball company size, each of which has its pros and cons.
The following three size measures - Market Capitalisation, Enterprise Value and Revenue - are quoted in the base currency of your choosing. You can choose whether to view these details in USD $, GBP £ or EUR € denomination on your site settings page.
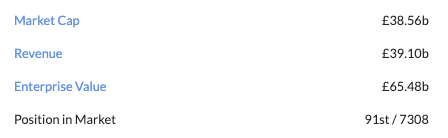
Market Capitalisation & Cap Rank
This is the classic measure of company size that all seasoned stock market investors know well. It is calculated by multiplying the number of ordinary shares in issue by the share price. All else being equal, the “market cap” as it’s known will rise and fall in line with the share price.
We also publish the relative size of a company versus all the other companies. The Mkt Cap Rank shows where the stock falls versus the rest of your subscription universe, with ‘1st’ being the largest company in the set.
Enterprise Value
The market cap is a useful rule of thumb but it only measures the value of a company’s equity, and completely ignores the value of a company’s net borrowings. If an investor wanted to buy out all of a company’s stakeholders they’d have to pay somewhere near the Enterprise Value - literally the ‘value of the enterprise’.
A glance comparing the the Market Cap vs the EV can tell you if a company...
- Has net cash (an EV less than its Mkt Cap),
- Is highly geared (EV far greater than Mkt Cap),
- Is currently worth less than the cash in their accounts (a negative EV)
Revenue
Another handy measure of company size, revenues in some geographies are known as Sales or Turnover. Some companies can have huge market capitalisations with very little in revenue (story stocks) while others can have huge revenues and low market caps.

