Investors hunting for income from stocks should pay attention to the frequency, consistency and growth of company dividends - all of which can be found in the dividends tab of each company’s StockReport. Using this information –alongside profitability figures which show how well covered and reliable a company’s dividend is– investors can decide whether a stock fits their investment strategy and is a positive contributor to their portfolio.
With that in mind, we wanted to let you know about some recent improvements to our dividend tool, following feedback from the community.
You asked to make it easier to read the bar charts
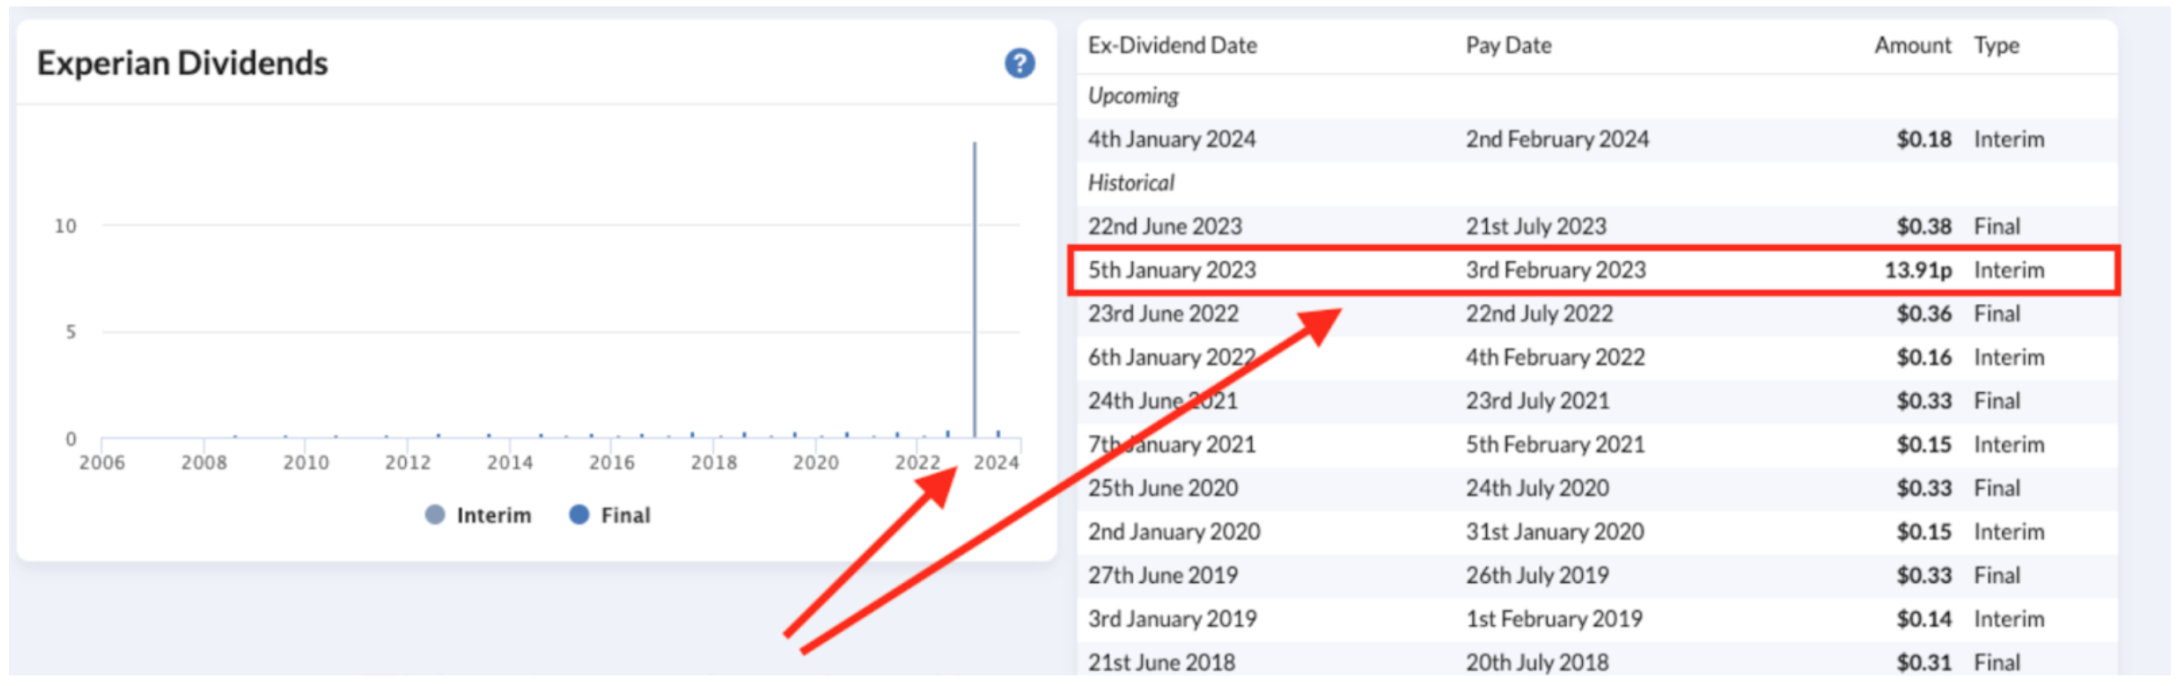
“The bar charts display varying currencies, showing dollars for certain payments and sterling for others. This inconsistency distorts the chart.”
Let’s take a look at Experian (LON:EXPN). The company typically pays dividends in US dollars, but occasionally pays them in UK sterling. Previously, this caused problems on the chart. The sterling amount was expressed in the pence minor unit (13.91p) whereas the dollar amount was expressed in the major unit ($0.18). The chart tool assumed both values to be in the same currency and this distorted the display. Notice how the pence value was unrealistically big...
We answered
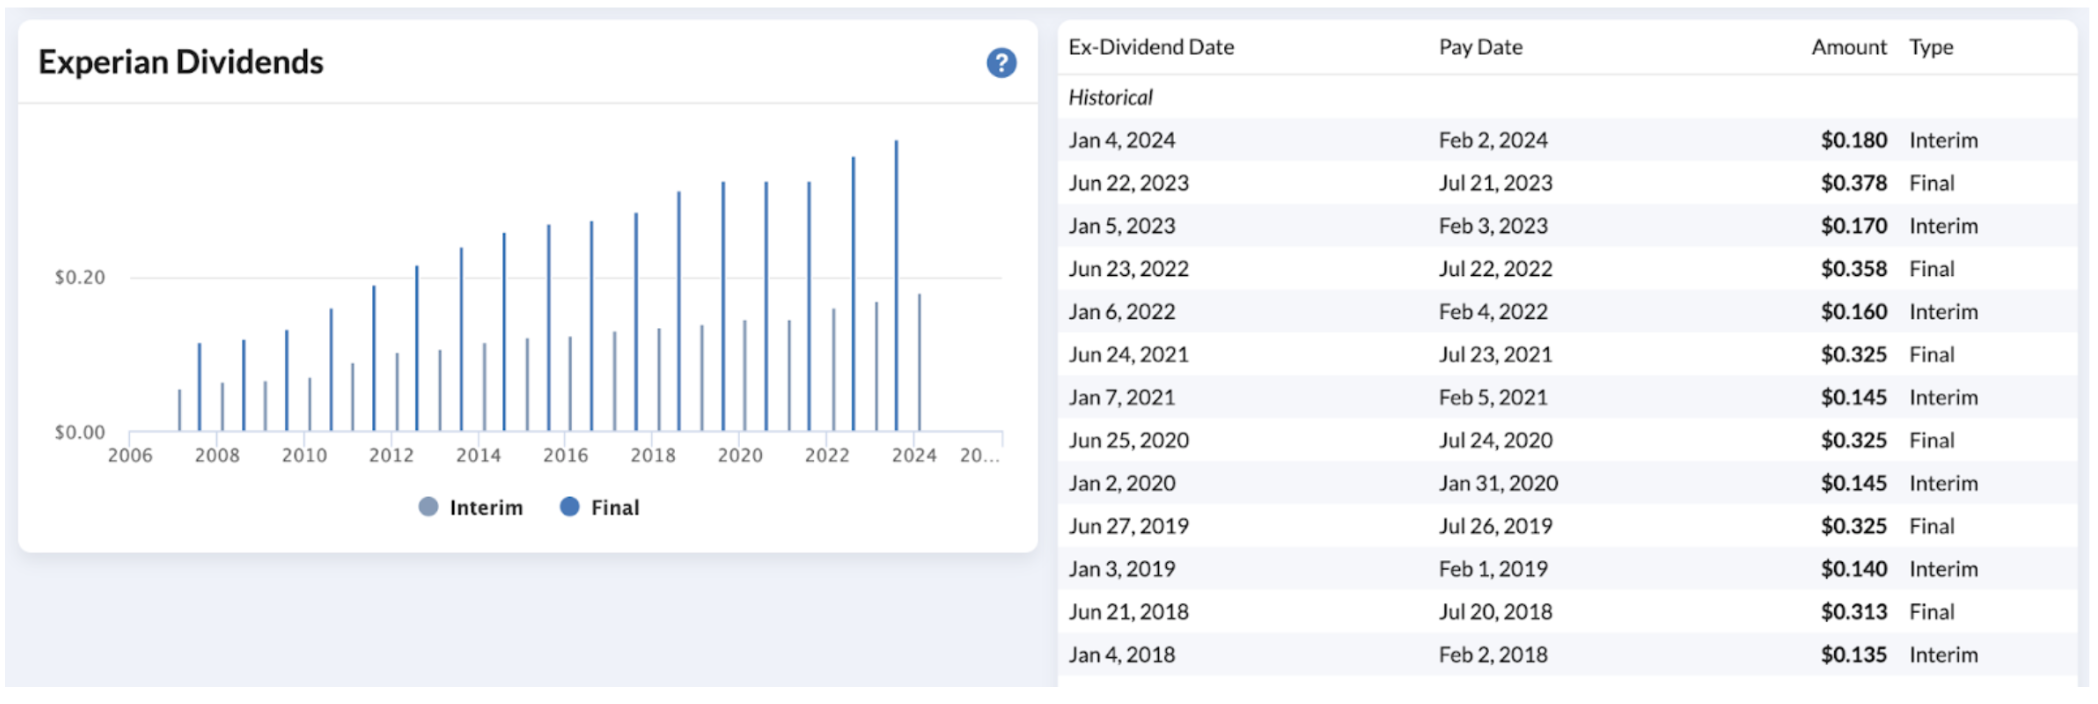
We now display the dividends in one consistent currency - i.e. the modal currency. If a company usually pays dividends in dollars, but occasionally pays them in sterling, then the chart will plot all values in dollars.
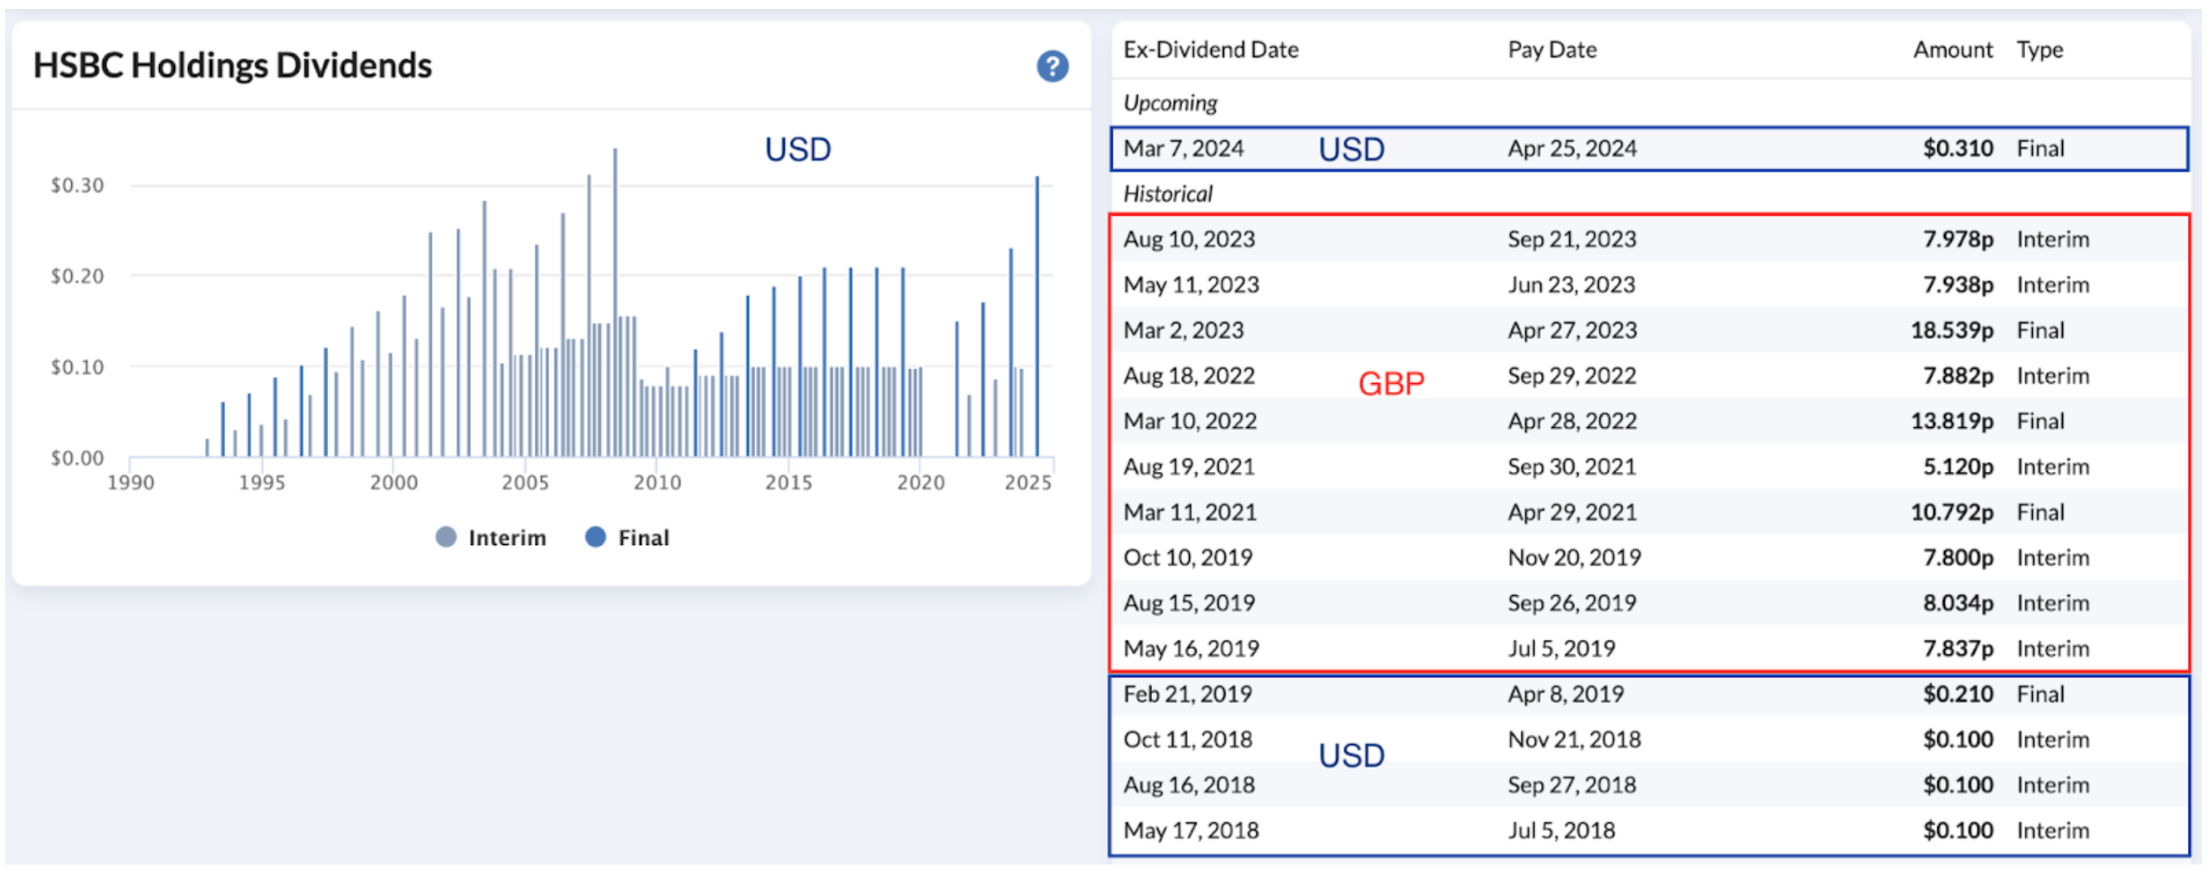
It’s also worth taking a look at HSBC (LON:HSBA), which reports dividends in three currencies, UK sterling, US dollar and Hong Kong dollar. Our table displays a mix of sterling and dollar, but the chart normalises all dividends to the same currency, for ease of comparison.
How to use this information
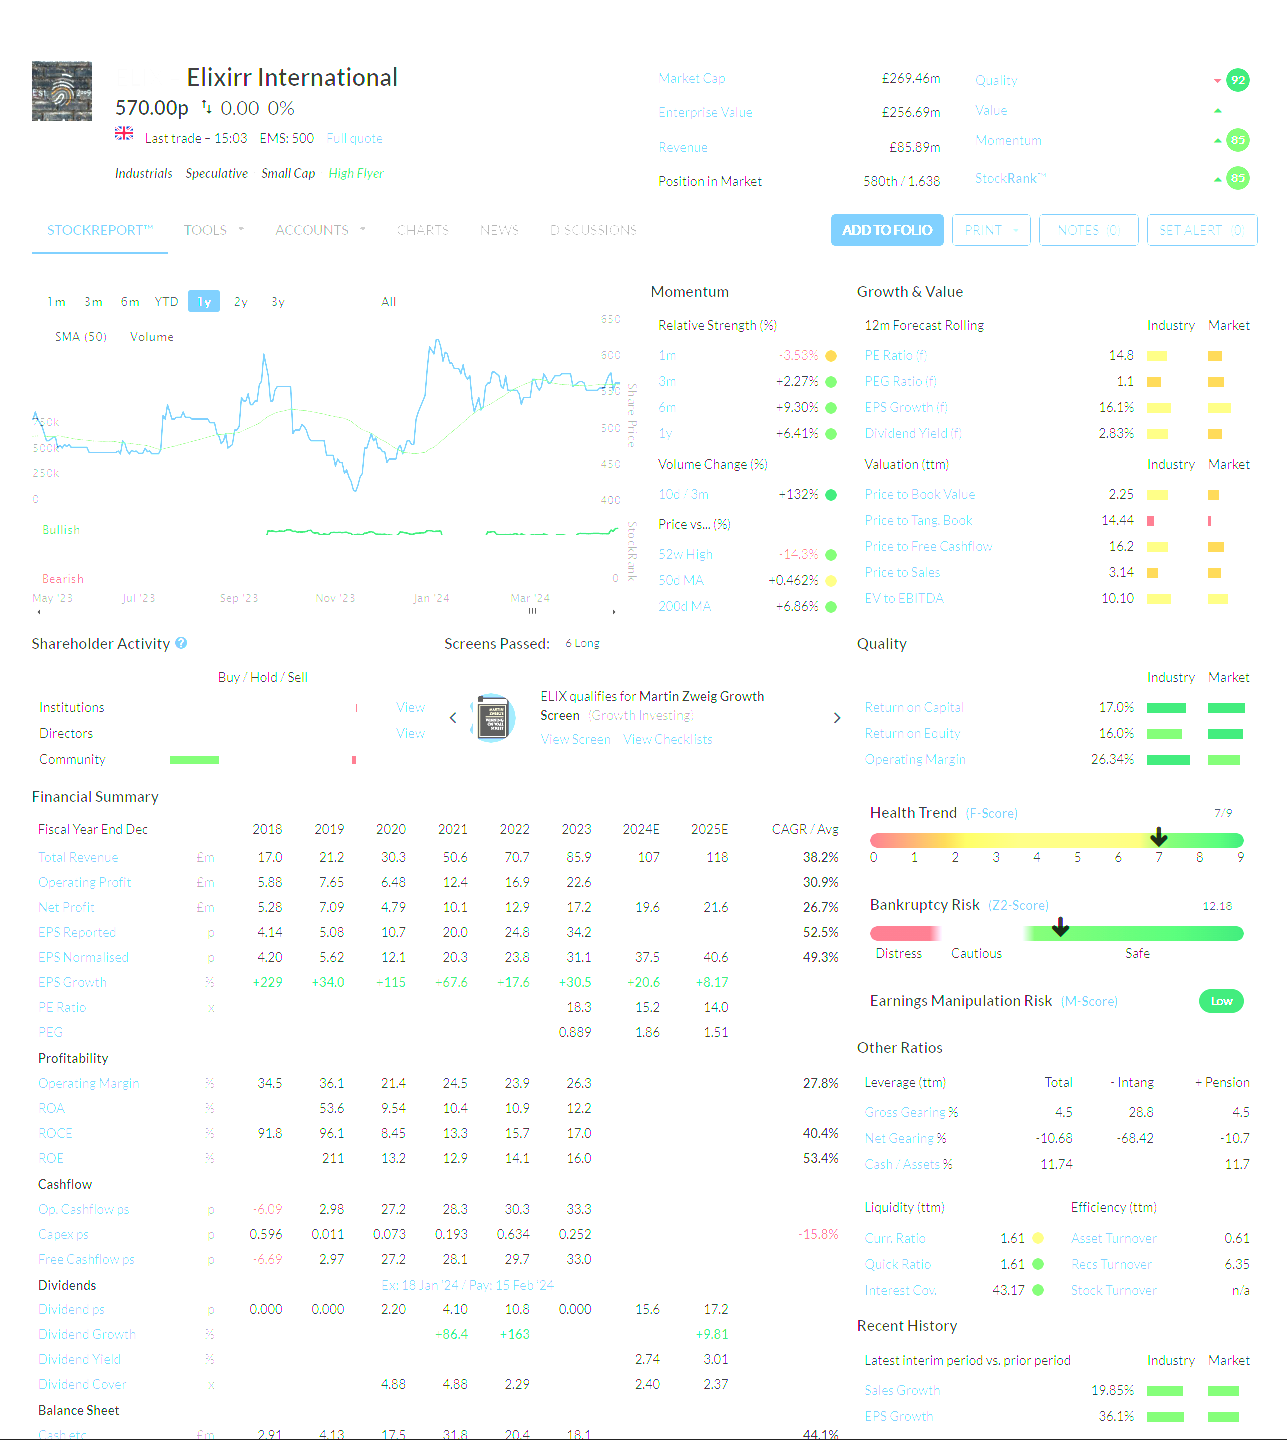
The dividend bar chart is best used in conjunction with the main StockReport. Whereas the chart helps investors analyse dividend trends over time, the StockReport can be used to ascertain how safe a dividend is. Let’s take a look at some useful metrics.
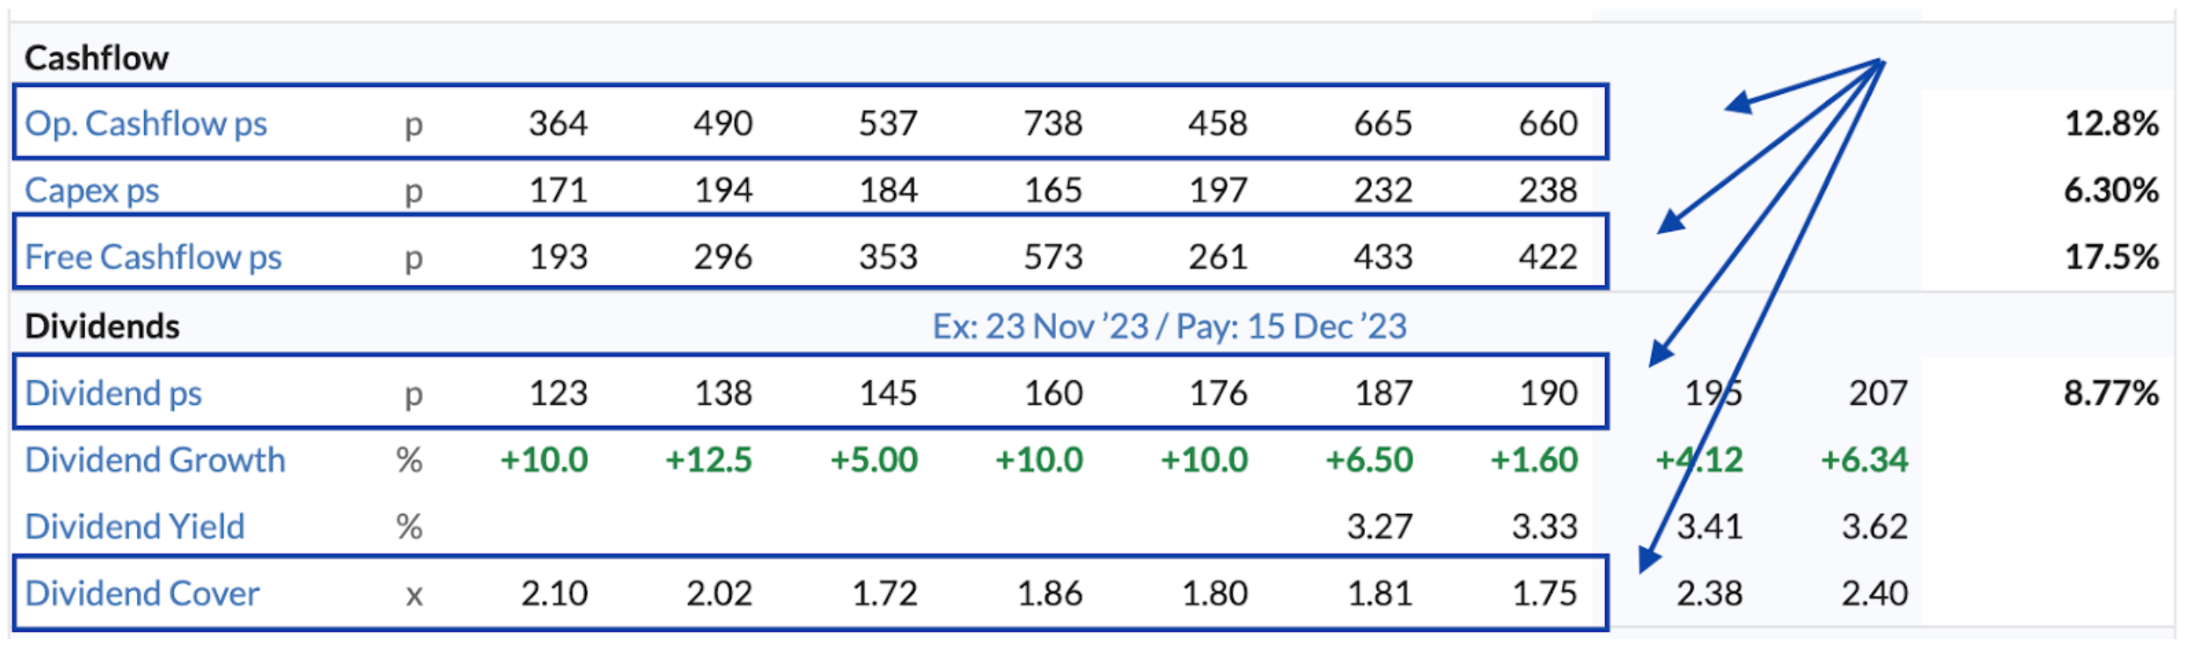
Dividend cover
Dividend cover is calculated by dividing the company's earnings by the dividends per share. A larger value suggests that the company is generating enough profit to comfortably pay dividends without relying on borrowing or depleting its cash reserves. Investors can also compare dividend values with cashflows. Again, a larger ratio of cash to payout suggests a safer dividend.
Fundamental momentum
Fundamental momentum refers to the direction or trend of a company's financial health over time. A fantastic paper by Bulan found that companies were more likely to cut their dividend if fundamental momentum was poor - i.e. dividend-cutting companies were more likely to have declining cashflows, lower profitability, lower sales growth and so on.
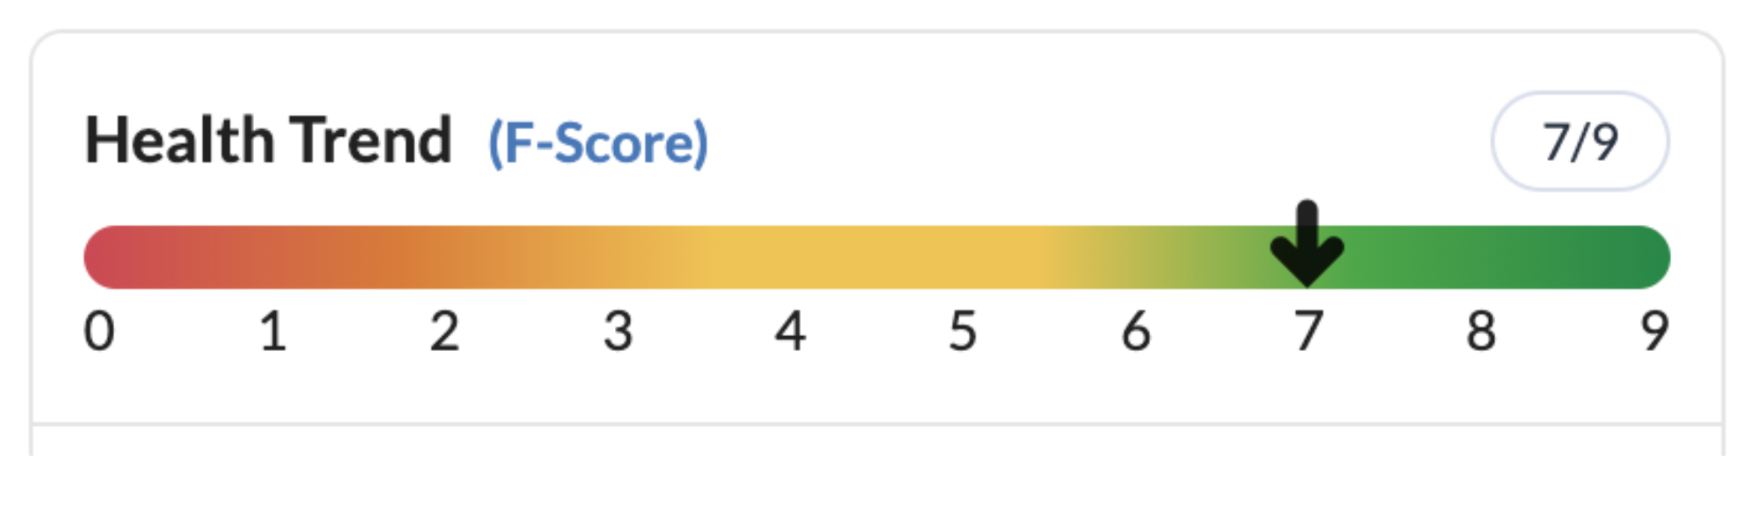
We have not incorporated Bulan’s metrics into our product, but the Piotroski F-Score can be used as a substitute. It is visible on the StockReport and analyses trends around profitability, leverage, liquidity, operating efficiency, and other aspects of a company's financial health.
Your questions:
How do you convert historic dividends to the same currency? Historic values will be converted using the foreign exchange rate on the payment date.
How do you convert future dividends to the same currency? Future dividends are calculated at the most recent foreign exchange rate.
Will these upgrades change the dividend tables? No. Tables will display the currency that the dividend was announced in (i.e. with no FX conversion). If our data suppliers edit the data, we will update the table to reflect this.
How can I tell which currency is used for the chart? We now display the currency on the Y-axis. Before this release, the Y-axis had no currency label.
What types of dividends do you show? Until this release, the chart showed interim, final and special dividends. Now, it also shows Extra dividends (another form of Special dividend).
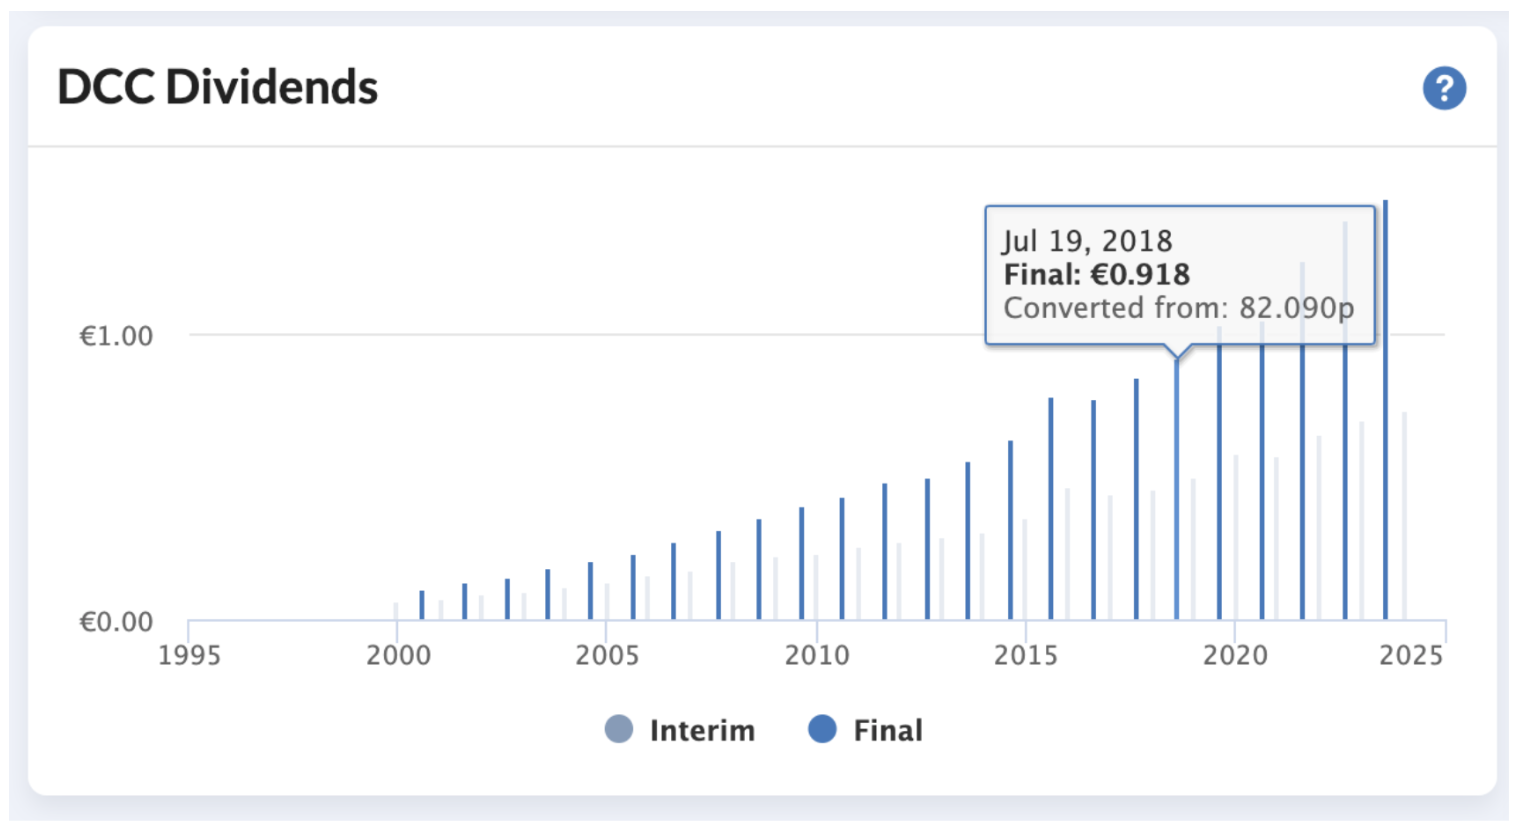
Can I see the unconverted values? Yes, in the tables, but also if you hover over the bar, you will see a pop-up with the original value, shown in the image below.
We appreciate your feedback
We recognise the significance of having accurate and timely data. As a result, we continuously seek enhancements to our data pipelines while prioritising the acquisition of top-quality data from our providers. As part of this effort, we've been encouraging our data suppliers to implement internal checks around dividend data. Let’s take a closer look:
A company’s financial statements – cashflow, income and balance sheet – must all be internally reconciled. It is therefore possible to catch data errors by comparing dividends on the income statement with dividends on the cashflow statement.
Comparing dividends from one year to the previous year can also help identify missing or irregular data.
Equally, when dividends are reported in different currencies, there is also now a process to reconcile this and ensure consistency across payments.
While there's still a manual aspect to this process, and some issues may slip through, our data suppliers are committed to addressing these concerns by providing more comprehensive quality assurance processes moving forward as a result of our work with their team.
Your feedback is crucial in ensuring that the Stockopedia service meets your requirements. For more detailed discussions regarding specific site issues, please feel free to reach out to our customer support team through the green Intercom button on the bottom right of your screen.