New Year NAPS - Top Stocks for 2023 - should intuition trump the model?

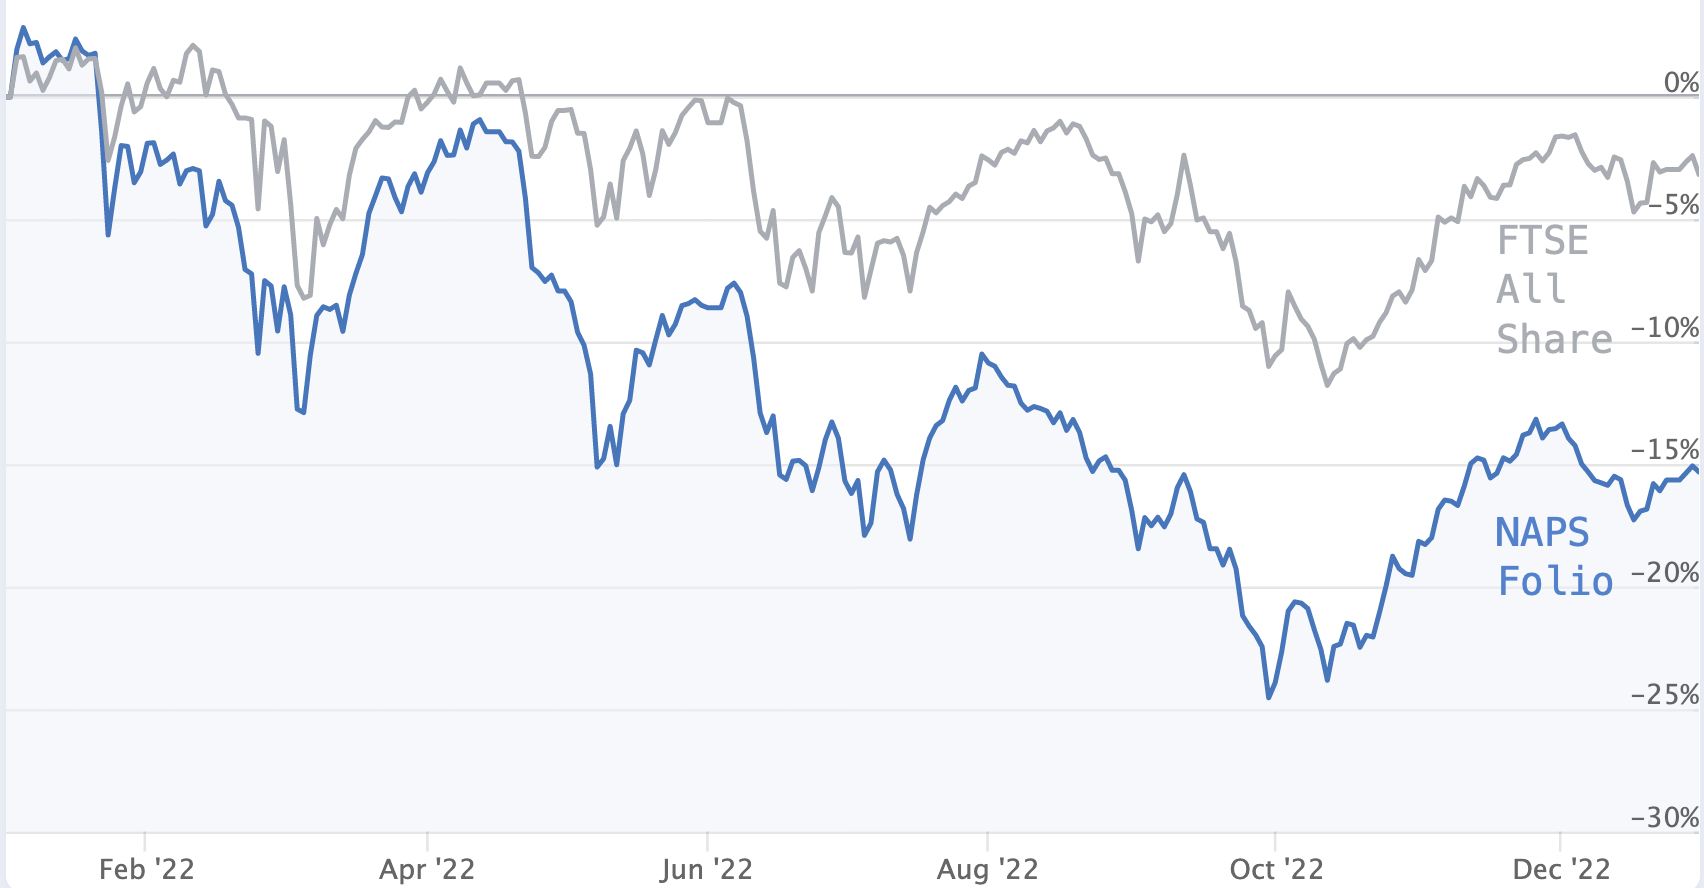
Bah Humbug. You'd have thought that after such a dismal stock market year, Santa could have brought a decent relief rally. Alas, no. Thus we cap out the worst year in an eight-year history for the NAPS Portfolio on the back of the worst year for stock markets for more than a decade. With the benefit of hindsight, I can now reflect on the 15% fall since the start of the year and torture myself over the actions that could have avoided this outcome.
The thing is, at the start of the year, I knew this would happen. My instinct told me to adapt the strategy ahead of a probable reversal. But I chose not to. If I had, the portfolio could have ended the year with better returns. Was I right to ignore my intuition? Should I allow myself more discretion going forwards?
Before I answer these questions, let's recap on the NAPS strategy, and explore its results in 2022 and over the long term. Let's see if there are any answers hidden within my regrets, before we reveal the 2023 portfolio.
This is a long piece at more than 6,000 words. If you would like to download it as a PDF to print and read offline - download it here.
2022 Performance
The NAPS Portfolio is my "No Admin Portfolio System" based on a remarkably simple approach. Buy the top two ranked stocks in each of ten sectors and hold for a year. Repeat on each anniversary. While I've adapted the approach more recently, it takes barely an hour or two to administer per year and has proven remarkably effective. You can read up on the history of the portfolio in the column archives here. I am likely to reprise a webinar on the topic in the next few weeks - so if you are interested in learning more, do keep your eyes open for a New Year invite.
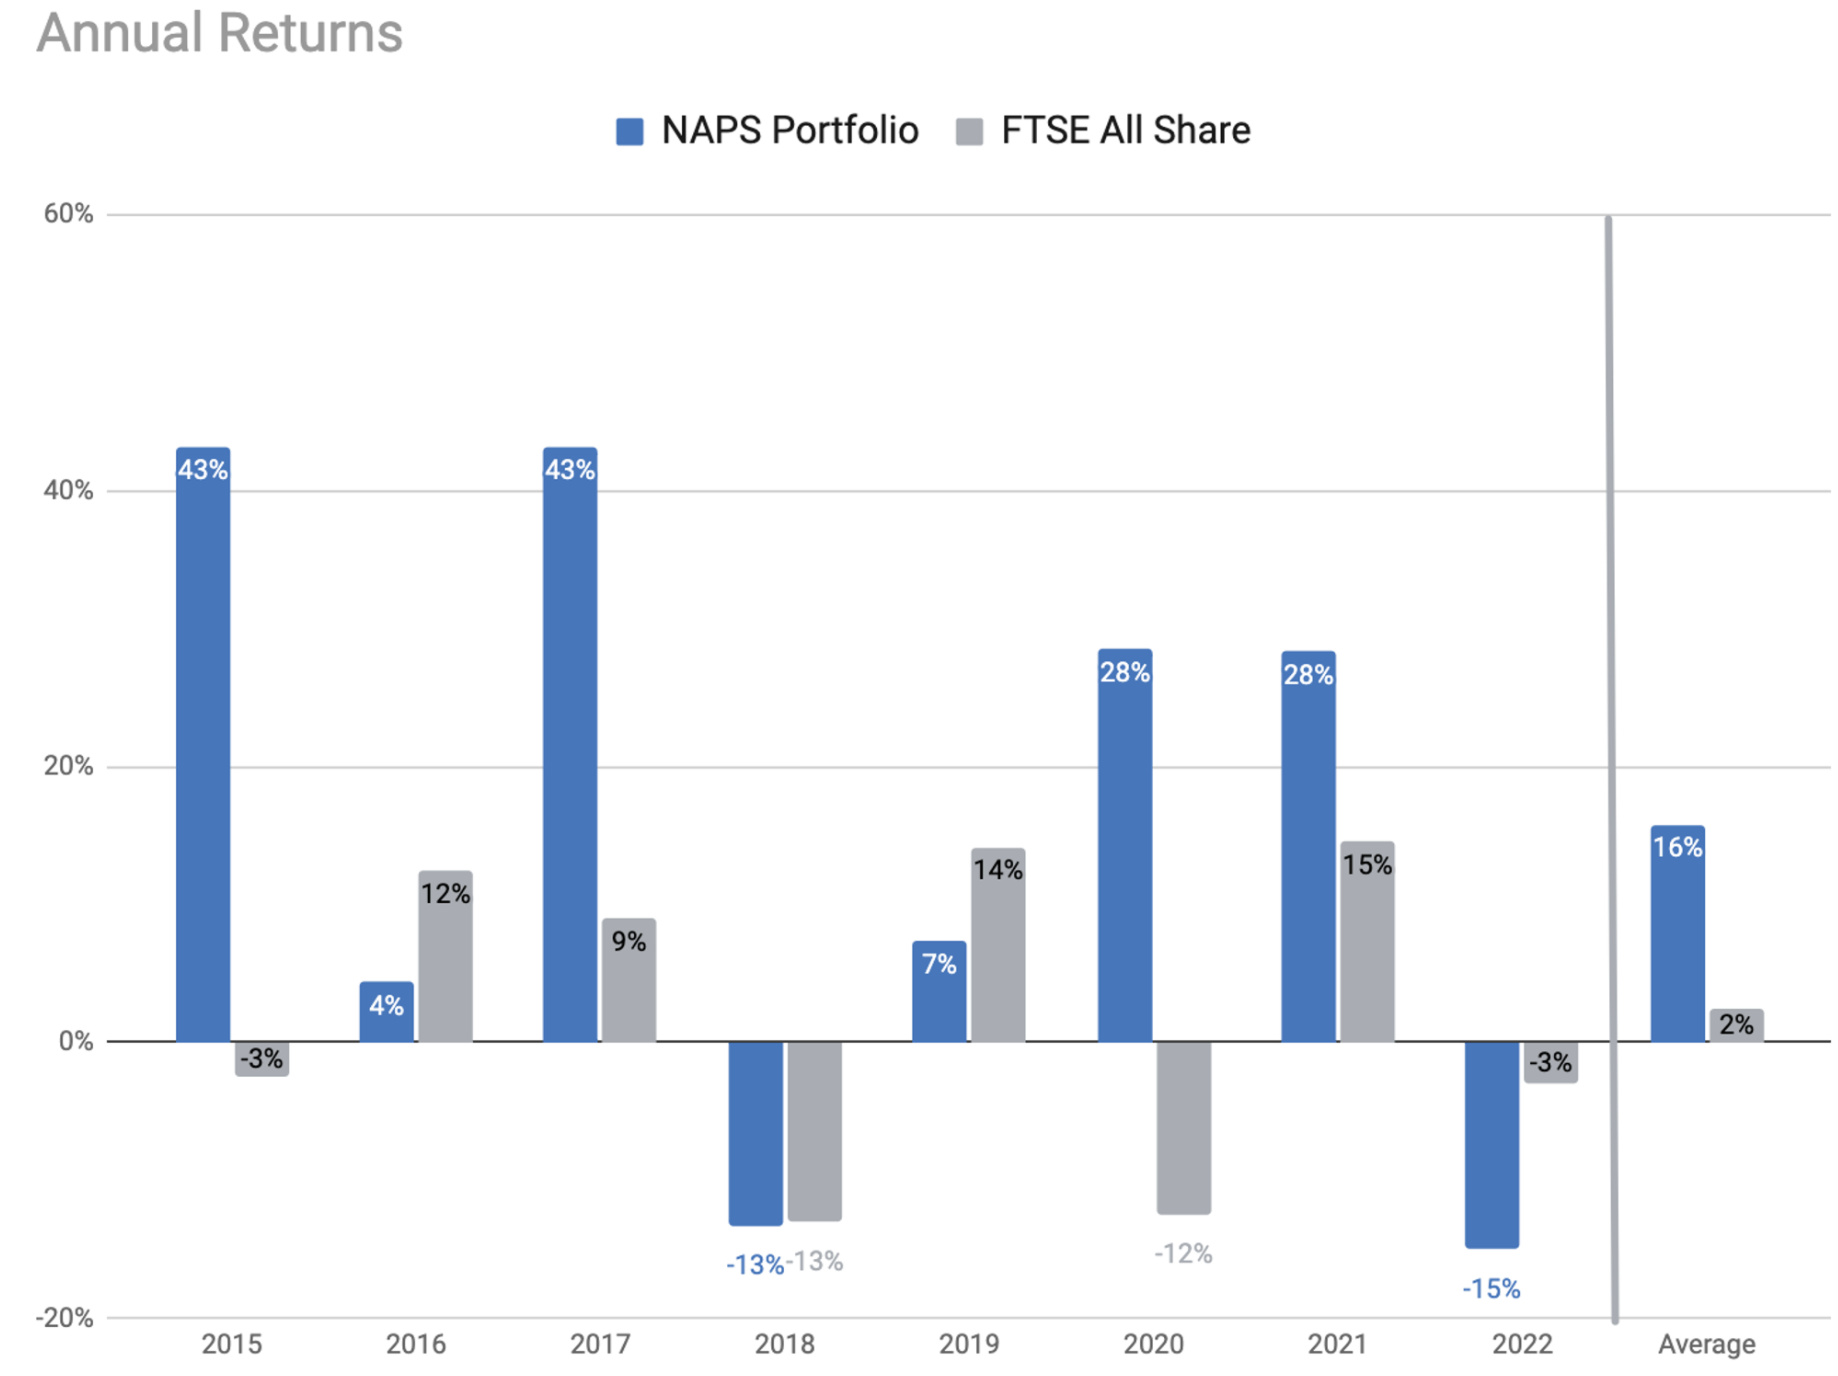
The Portfolio fell by 15% through 2022, which reflects poorly against the FTSE All Share, down 3%, but well against the FTSE AIM All Share - down a horrible 32%. As the AIM market is the favoured hunting ground of most UK private investors, the pain is very real for all of us.
On the other hand, over the longer term, the NAPS has performed superbly. Over a five year period, the simple NAPS approach has beaten 95% of the professionally managed funds in the "IA UK All Companies" sector. It has also dominated the FTSE All Share returns since inception as shown below.
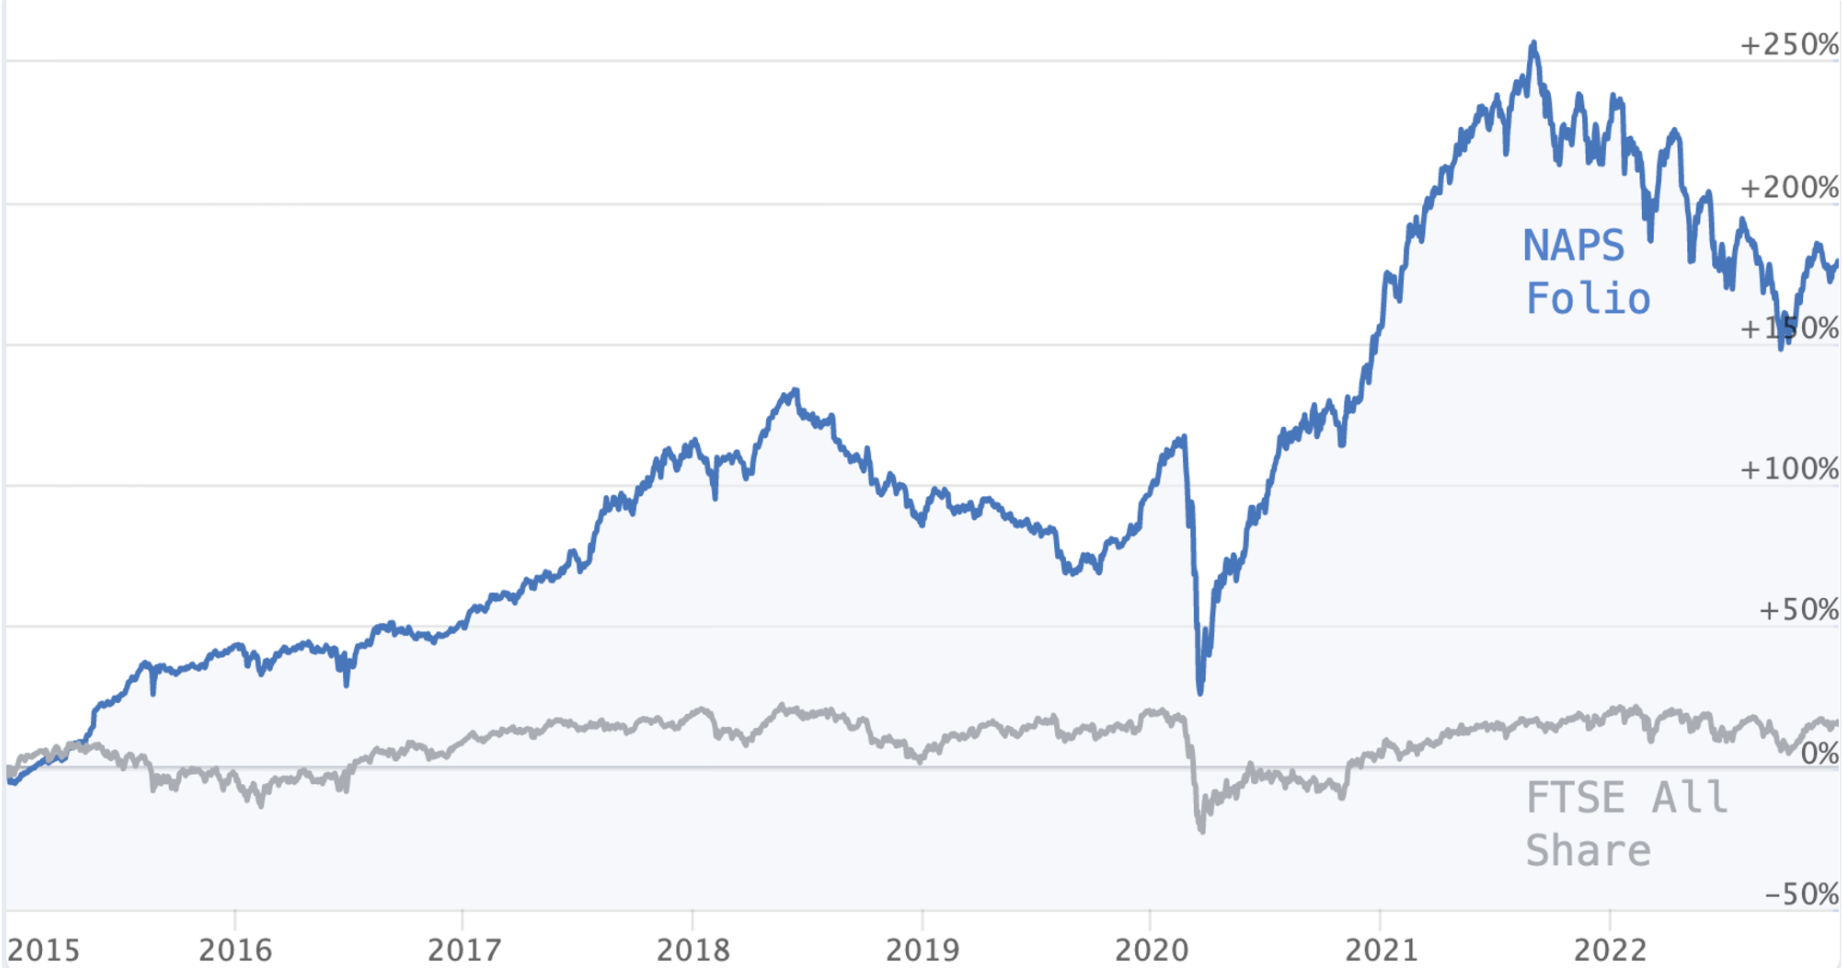
The above charts both exclude dividends, which does invite some criticism. But it's worth noting that the NAPS yield has averaged 2.7% annually since inception, while transaction costs have approximated 2.2% annually (including stamp duty). As dividends more than cover transaction costs, it's been reasonable (and conservative) to exclude both.
It's not unusual for the portfolio to underperform the index. In fact, over the eight-year period it's honours even. The difference has been that in certain market periods, the NAPS has significantly dominated the index. That outperformance has compounded over the longer term into some outstanding results.
What drove this year's results?
There are always some interesting underlying themes in each year's portfolio, so let's peel back the onion and do some contribution analysis.
1. Positions
First up, let's look at the individual positions. With so many losers, this is not an array that I've enjoyed reviewing:
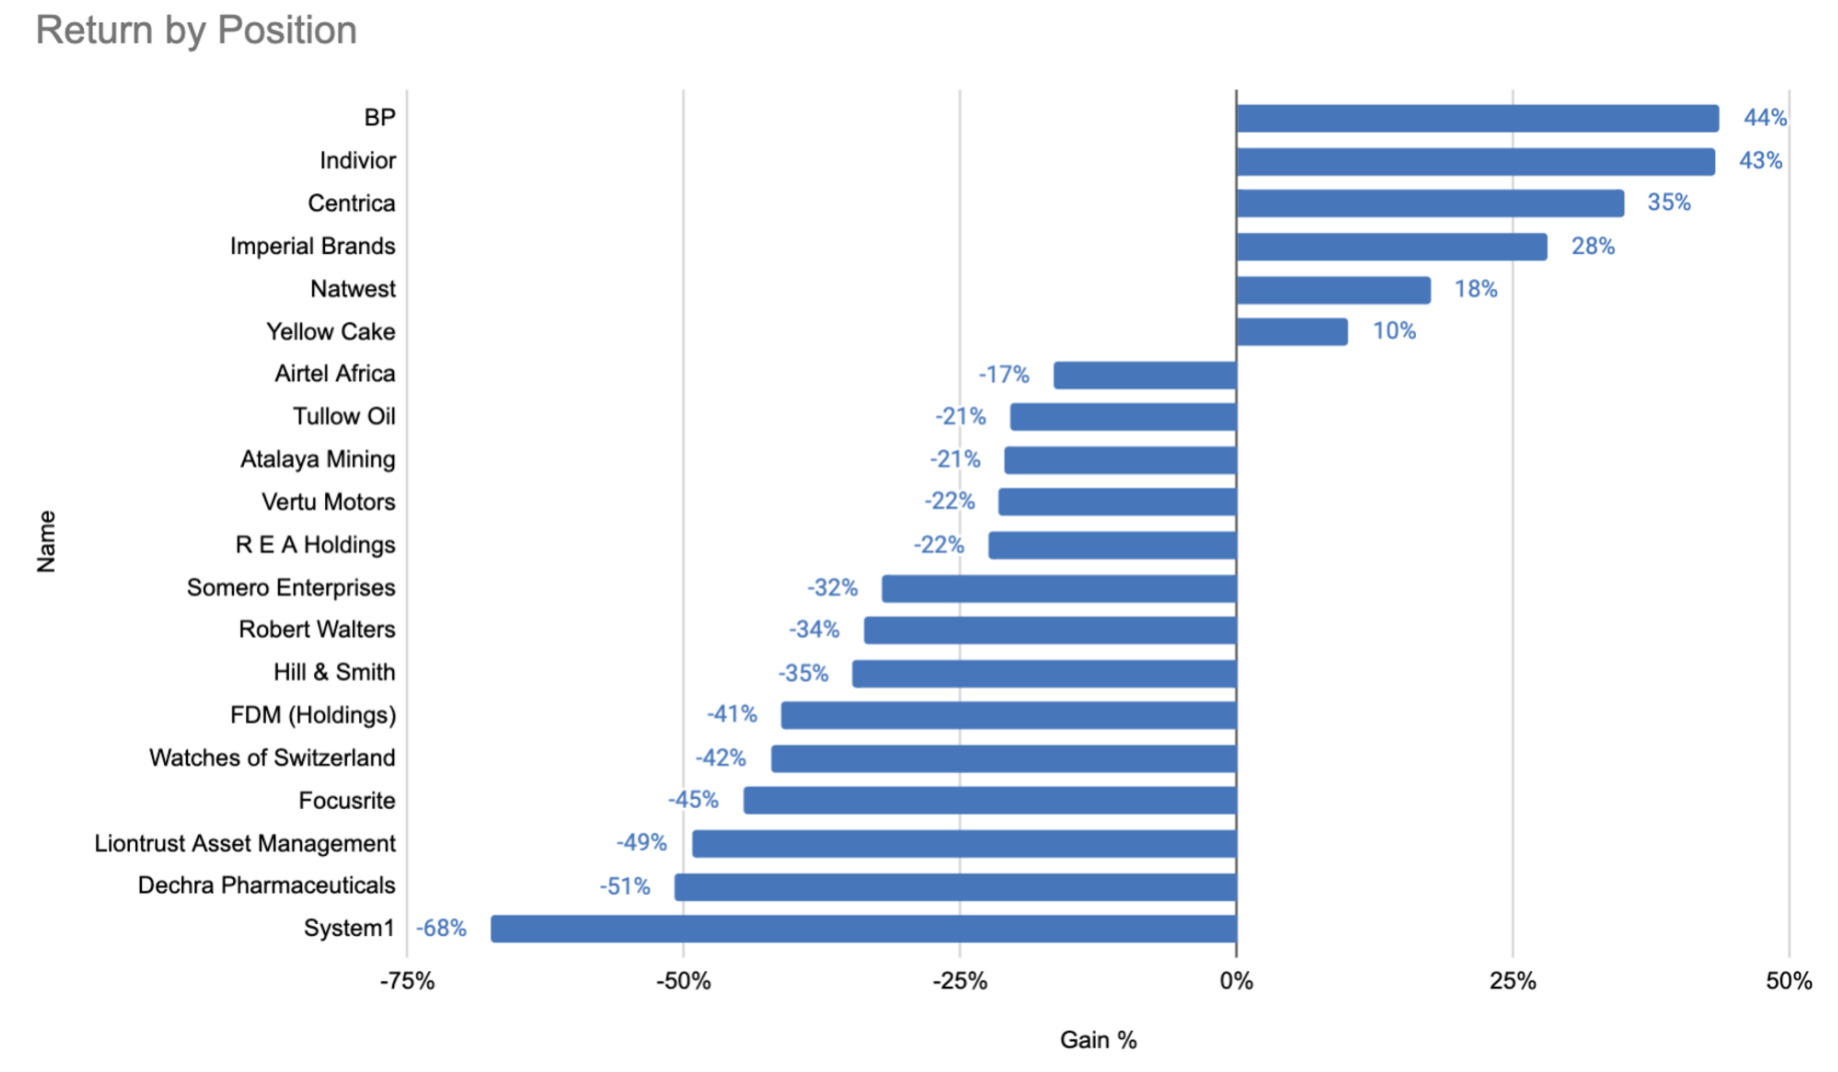
Only 6 winners out of 20. That's a 30% hit rate of picking winners, which is disappointing, but reflective of the 90+ StockRank set as a whole year to date. Over the last ten years we've seen a 65% hit rate of picking winners in the 90+ ranked set in the typical year - so 2022 has definitely been atypical.
In terms of names, there were some pretty disappointing returns from what had been strong pandemic winners ( Watches of Switzerland (LON:WOSG) , Focusrite (LON:TUNE) , Liontrust Asset Management (LON:LIO)) , while a better showing from more stable, large caps like BP (LON:BP.) , Centrica (LON:CNA) and Imperial Brands (LON:IMB.
2. Sector & Size Breakdown
The picture is made clearer if we break the returns down by sector and size. The sectors that gave spine to the portfolio this year were utilities, energy, consumer defensive and healthcare stocks.
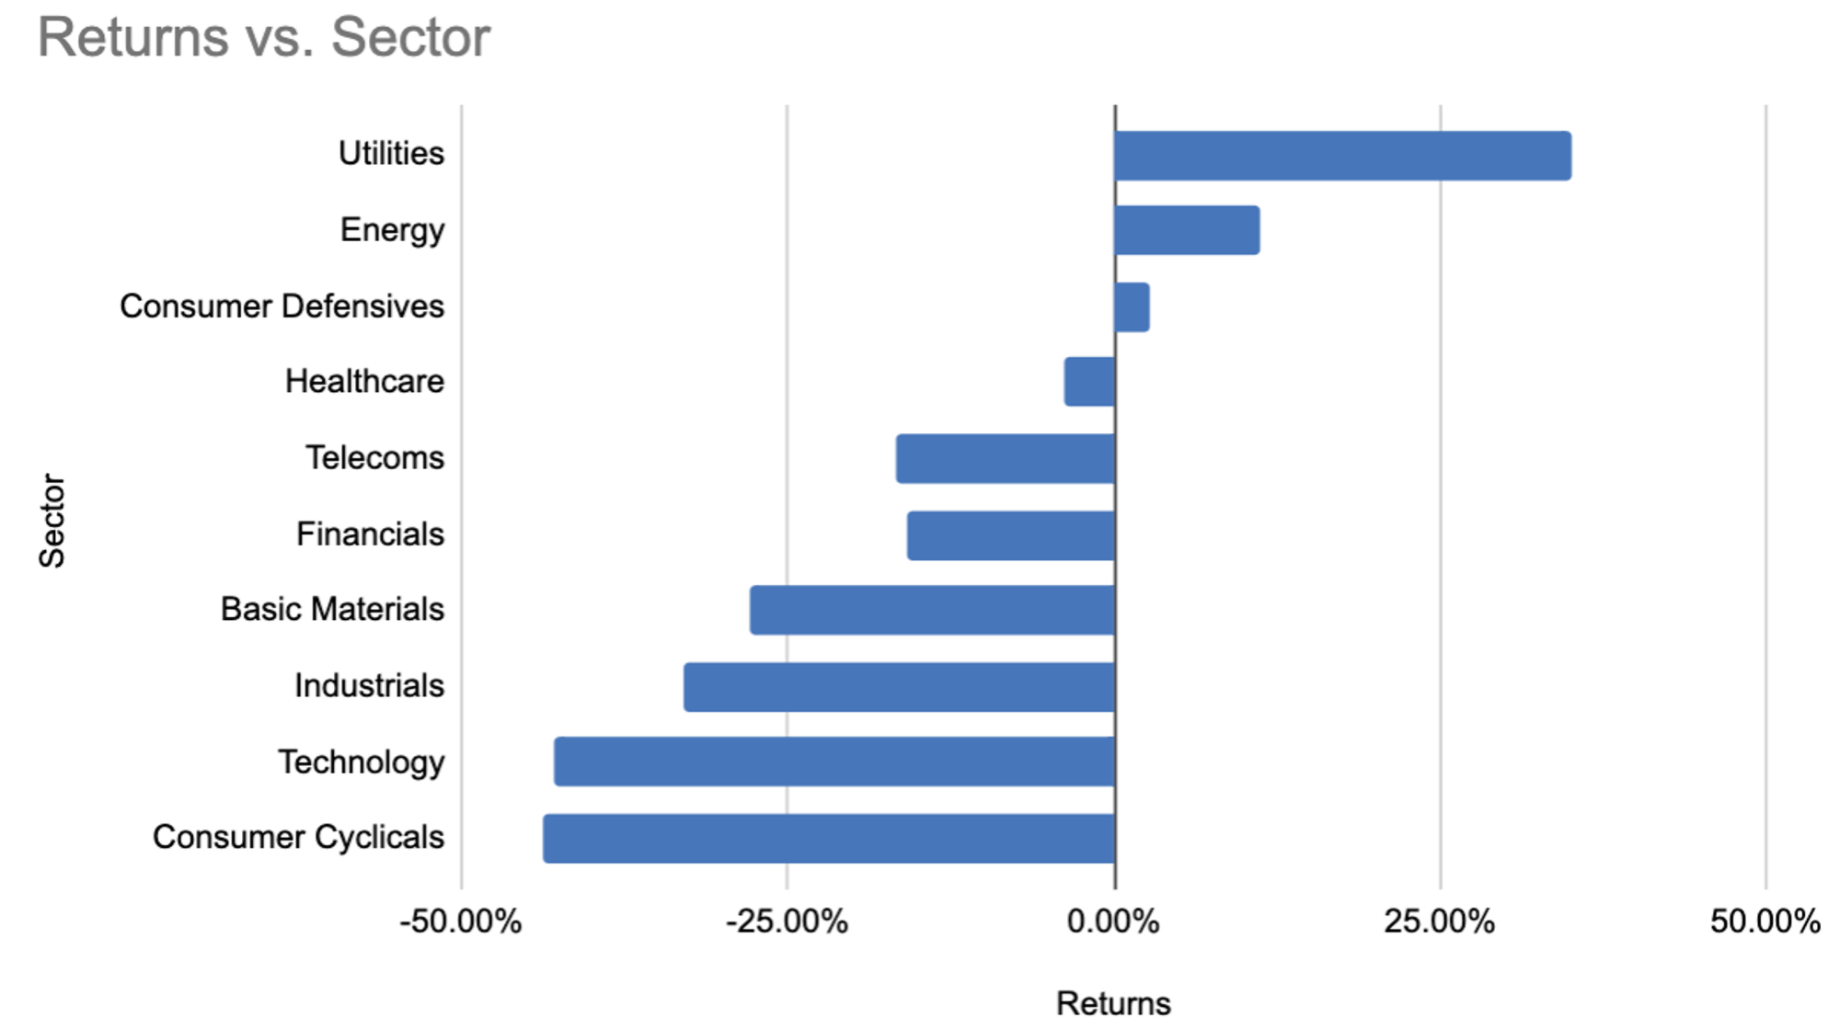
The real pain this year was in consumer cyclicals, technology and industrials. These sectors tend to be extremely popular with private investors, including all of us using Stockopedia. There's often a tendency for us all to be biased against defensive sectors as we like to take on some risk. But markets like 2022s have been brutal for more cyclical sector investors.
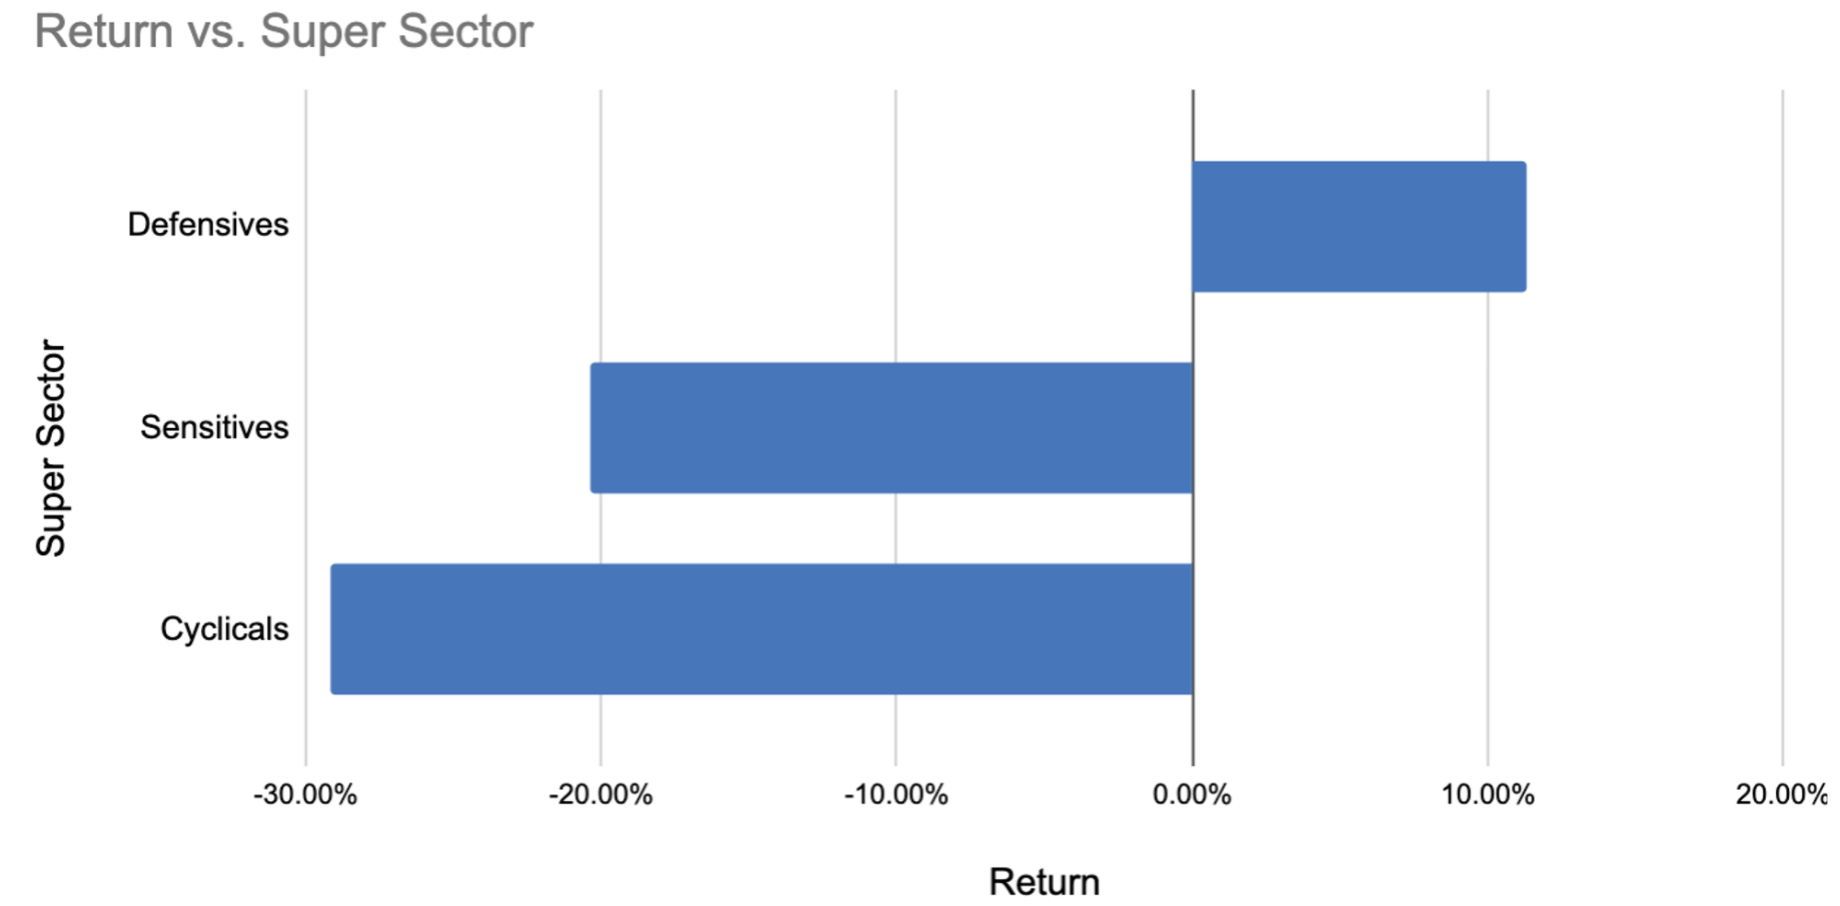
Take a look at this chart which aggregates the sectors into 'super sectors' for even more clarity. Defensive sectors have dominated the portfolio returns.
Beyond sector charts, I also like to look at how the different size groups have performed - check this out. Large caps have dominated mid-caps have dominated small caps have dominated micro caps. For small and micro-cap investors, 2022 has been a year to forget.
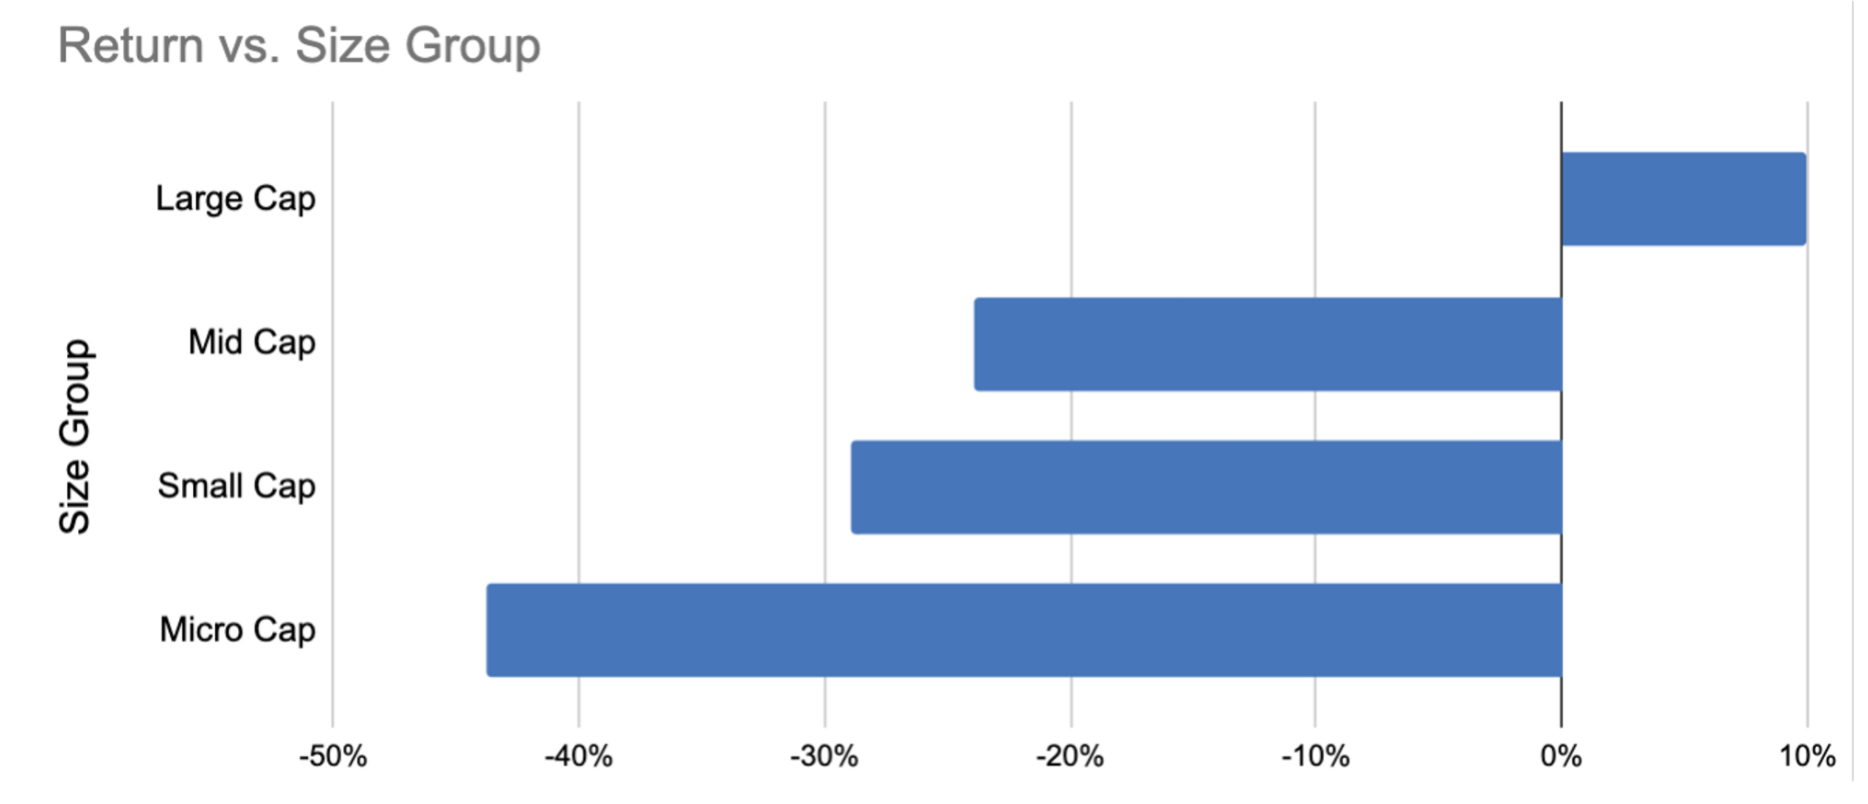
If there was ever an advert for sector & size diversification as a core part of an investment strategy it's these charts. As has been quoted a thousand times "diversification is the only free lunch in investing".
I've always liked to think about portfolio construction as building a football team. You can't win without a good defence. Large caps in defensive sectors provide ballast in weak markets. The portfolio would have been down a huge amount more than 16% if we hadn't had this spine.
3. Factor Breakdown
If you've been following the portfolio closely, you'll know that I've shifted to a "half-and-half" approach. Half the portfolio is invested in “growth” stocks (top ranked by quality and momentum) and half in “value” (top ranked value and momentum). Here's the most eye-opening chart of them all, and the one that causes me the most regret:
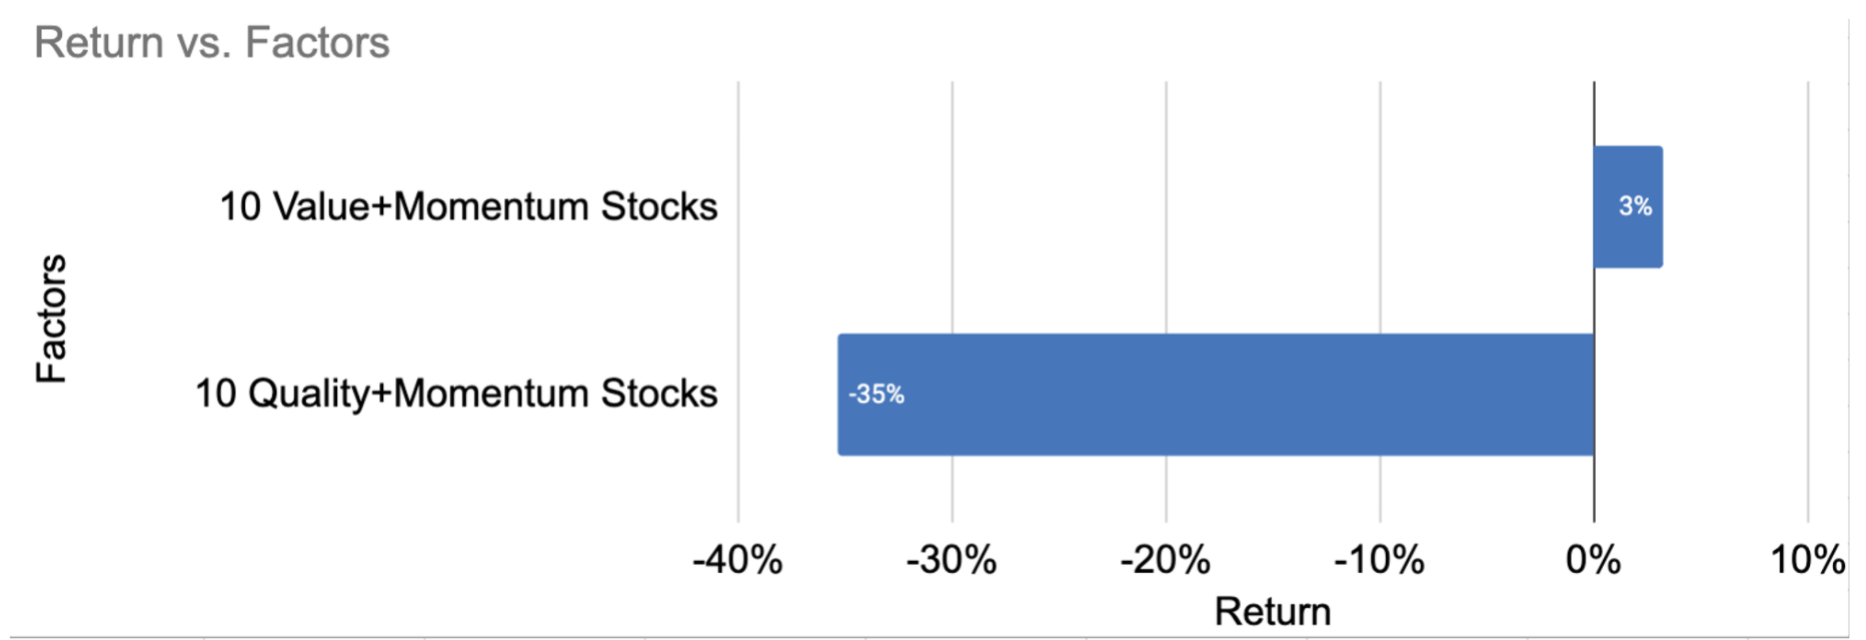
The instinct I had at the start of 2022 was that growth stocks had become too expensive. Their PE Ratios had stretched to an extreme. They were overdue a reversal.
This reversal came to pass. A 35% loss for the growth half of the portfolio versus a 3% gain for the value half.
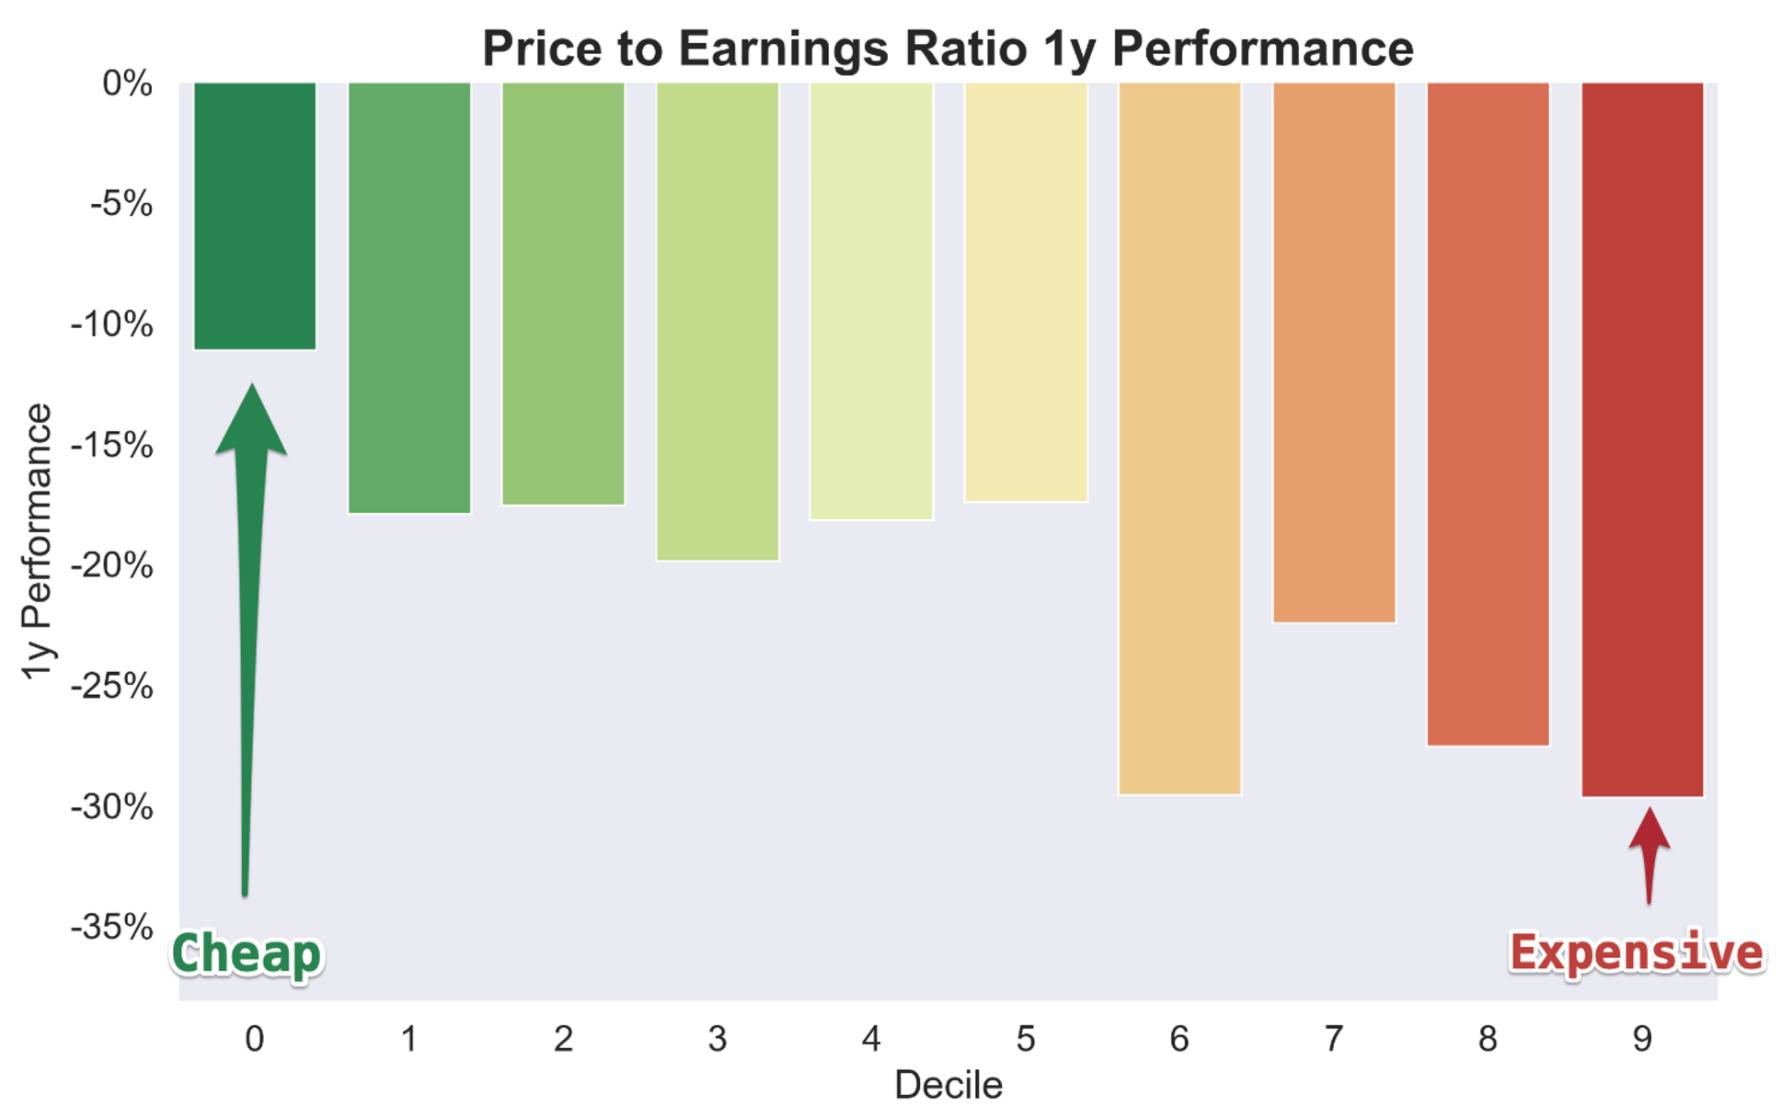
The chart below shows the performance of the entire UK stock market over the last 12 months split into buckets by the Price to Earnings Ratio (PE). The most expensive shares (on the right) corrected the hardest, while cheaper shares (on the left) held up the best.
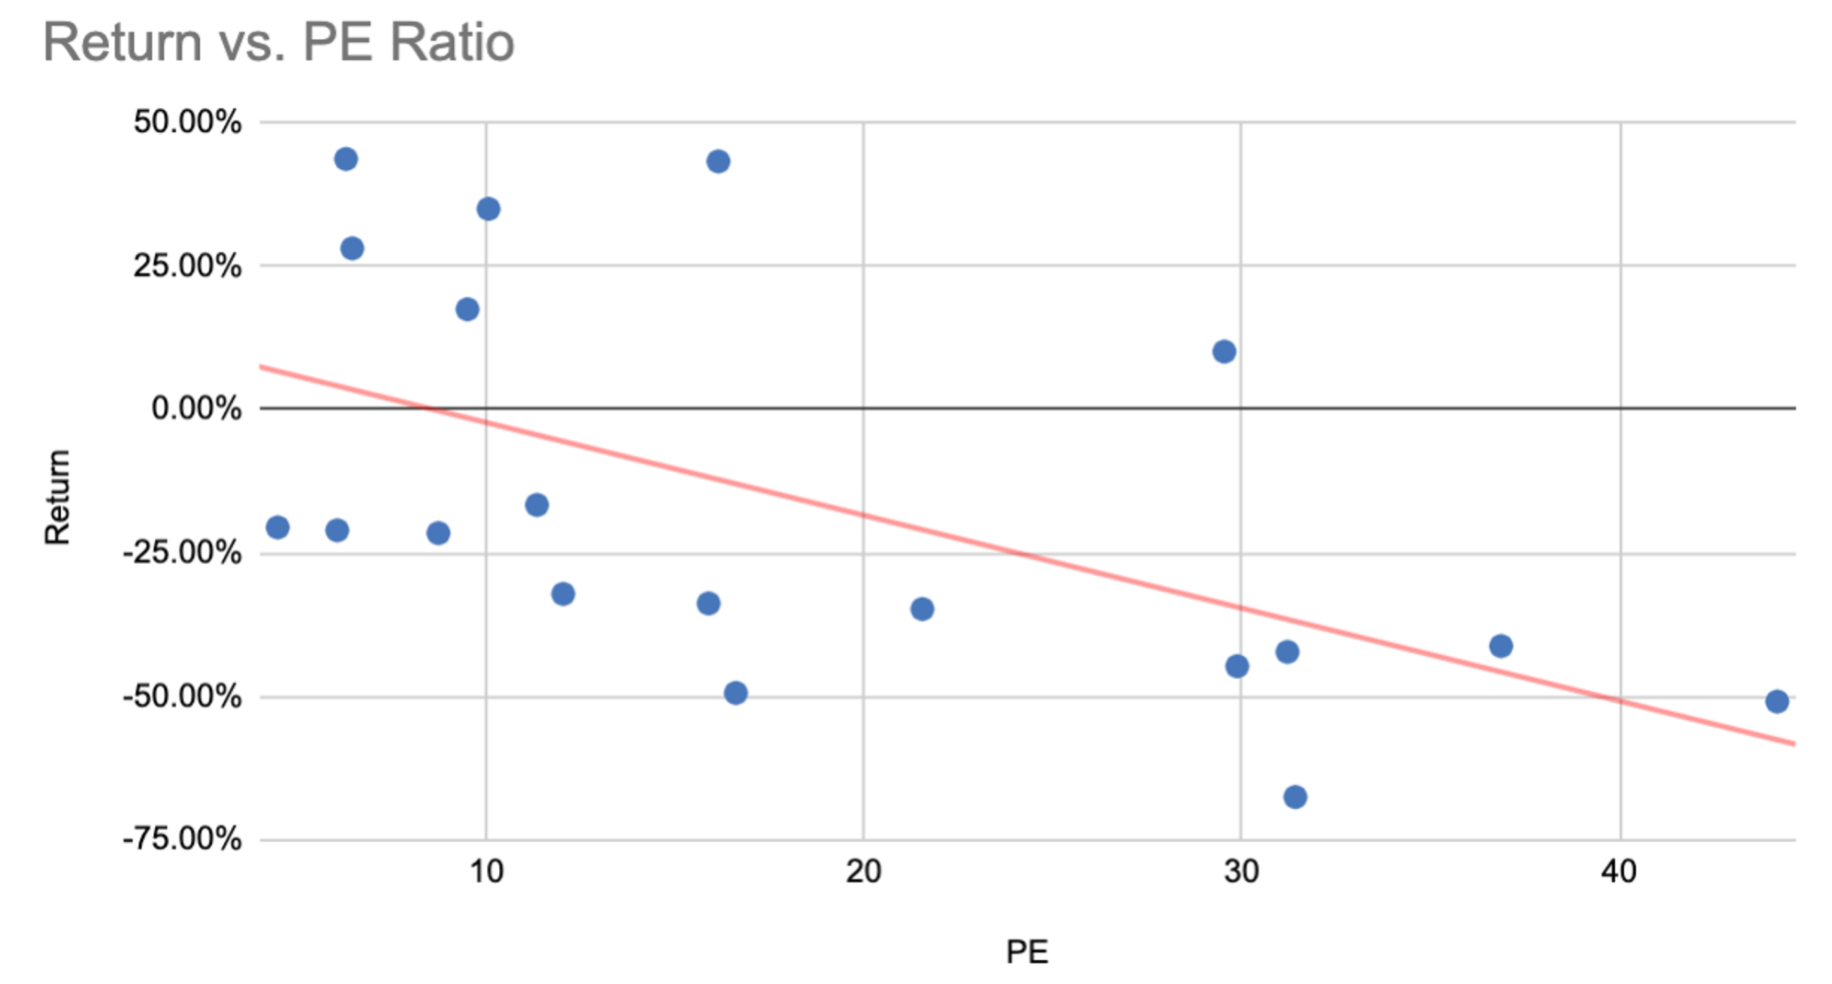
It's not that low PE ratio stocks were immune to the bear market, but they did hold up better. The chart below plots each portfolio holding's realised return on the vertical axis against their PE Ratio at the start of the year on the horizontal. Almost every stock above a PE ratio of 20x was absolutely hammered, whereas two-thirds of the shares that turned a profit on the year began with a PE of 10 or less.
If only I had trusted my instinct and put the entire portfolio into value stocks - I'd have been in a much better position.
Right?
Why trusting your instincts in hindsight can be a bad idea...
The problem is, I'm suffering from hindsight bias. Of all the psychological biases, this is one of the more damaging. It's so easy to convince ourselves that the probability of an event happening was higher than expected after the fact.
We now know with certainty a few things. In the West the pandemic is behind us, and in China they remained in lockdowns through much of 2022. The War in Ukraine began in February and has continued all year. Supply chains are impaired. Inflation has soared. Interest rates have rocketed. Political instability ensued in the UK. The stock market has corrected.
But we didn't know any of this at the start of the year. Could all of that really have been predicted before the fact? Some of it yes, but much of it not.
Investing is about managing in uncertainty, and the NAPS has always been a deliberately hedged approach to "long only" investing. It has never been about taking strong opinions on market direction, or market intent. It's never been about second guessing market conditions.
It's a simple approach designed to be "less wrong" in the majority of market environments. By being less wrong, it's generally been more right - to the tune of 14%+ annualised through a very low return decade in the UK.
So if I change the strategy based on high conviction that I was "right" in hindsight then I'd be in danger of over-weighting my predictions. Given I thought Atalaya Mining was a no-brainer for 2022 and it's ended up down 24% in part due to an energy crisis - I have plenty of ongoing evidence that my personal predictions are poor.
It ain't what you don't know that gets you into trouble. It's what you know for sure that just ain't so. Mark Twain
Models tend to beat expert intuition
There was a great study published in 2000 by William Grove which illustrated the power of 'mechanical' predictions over expert judgement (Clinical Versus Mechanical Prediction: A Meta-Analysis). His team aggregated 136 published studies where predictions were made by both experts and models across a broad range of domains. He then compared the results.
On average, expert predictions underperformed mechanical predictions by 10%. In about 40% of cases the models outperformed significantly. These were predictions across a wide range of domains including medical diagnoses, academic performance, startup success rates, marital satisfaction, parole success and so on. Granted, stock market prediction was excluded from the study, but it's well known that expert share tips in the press are rarely worth the paper they are printed on while analyst recommendations aren't much better.
Why are experts so poor at prediction? According to Grove, they are generally weak at statistics, overweight prominent inputs (like the news), and rarely get feedback on the accuracy of their predictions to improve them in future.
It's scary when you think about it. We often put our life outcomes in the hands of experts when expert intuition has been called into question.
Now I've got no idea what 2023 will bring. I'm still bearish, but not as bearish as this time last year, while my rudimentary sentiment timing model has not yet turned bullish. For all I know, things could get worse, but then again inflation may drop, supply chains may repair, Brexit may work, and roaring twenties may begin. Who knows.
As a chap called Paul Slovic once said in another hard to read study in 1973:
"Faithful adherence to (investment) policy appears to require a degree of skilled thinking that often exceeds the capabilities of human intuition".
So I'm sticking to the road less stupid and changing nothing for 2023.
The 2023 NAPS Portfolio
While the simplest NAPS-esque approach is just to select the top 2 highest ranked shares by StockRank in each sector, I changed the process for my NAPS model portfolio at the beginning of 2021. It's now half growth, half value - using the QM Rank and the VM Rank. The principles of the NAPS can, of course, be adjusted according to personal circumstance and preference.
For publishing reasons, I created this year's portfolio on December 27th, so if you run the process today you are very likely to see some different results. You can read up on the specifics of the process in the 2021 article here.
Here’s the list
| Name | Mkt Cap£m | Stock Rank™ | P / ETTM | Yield% TTM | Sector |
|---|---|---|---|---|---|
| AstraZeneca (LON:AZN) | 173,826.1 | 78 | 33.4 | 2.13 | Healthcare |
| Bank of Georgia (LON:BGEO) | 1,237.3 | 96 | 4.0 | 5.67 | Financials |
| Capricorn Energy (LON:CNE) | 824.9 | 93 | 8.2 | 0.00 | Energy |
| Central Asia Metals (LON:CAML) | 450.4 | 99 | 5.2 | 9.47 | Basic Materials |
| Compass (LON:CPG) | 33,630.3 | 88 | 29.5 | 0.00 | Consumer Cyclicals |
| DS Smith (LON:SMDS) | 4,428.5 | 98 | 10.3 | 5.04 | Basic Materials |
| Fonix Mobile (LON:FNX) | 217.5 | 74 | 27.2 | 2.99 | Telecoms |
| Imperial Brands (LON:IMB) | 19,421.9 | 94 | 8.8 | 6.82 | Consumer Defensives |
| Indivior (LON:INDV) | 2,527.8 | 88 | 24.5 | 0.00 | Healthcare |
| Keywords Studios (LON:KWS) | 2,120.7 | 76 | 46.7 | 0.09 | Technology |
| Mears (LON:MER) | 230.9 | 98 | 10.4 | 4.21 | Industrials |
| Netcall (LON:NET) | 154.1 | 80 | 63.1 | 0.55 | Technology |
| Shell (LON:SHEL) | 162,844.7 | 99 | 5.7 | 3.52 | Energy |
| Smiths News (LON:SNWS) | 110.2 | 99 | 3.9 | 8.88 | Consumer Cyclicals |
| Steppe Cement (LON:STCM) | 102.9 | 99 | 5.9 | 0.00 | Basic Materials |
| Telecom Plus (LON:TEP) | 1,742.7 | 87 | 39.5 | 2.92 | Utilities |
| Vesuvius (LON:VSVS) | 1,096.2 | 98 | 6.9 | 5.32 | Industrials |
| Virgin Money UK (LON:VMUK) | 2,502.9 | 89 | 4.5 | 0.00 | Financials |
| Warpaint London (LON:W7L) | 136.2 | 83 | 25.0 | 3.44 | Consumer Defensives |
| Wilmington (LON:WIL) | 273.3 | 94 | 15.7 | 2.65 | Consumer Cyclicals |
It's a more conservative portfolio, with a median market capitalisation of £1.2bn. The momentum weighting means that stocks that have 'held up well' through the bear market are selected. The typical share price across the list is up quite strongly in the last 12 months. This does mean the portfolio could lag if we see a ripping market recovery. I'm comfortable with that. Of course, if the bear continues, we could see more PE ratio compression at the premium end of the list. So be it.
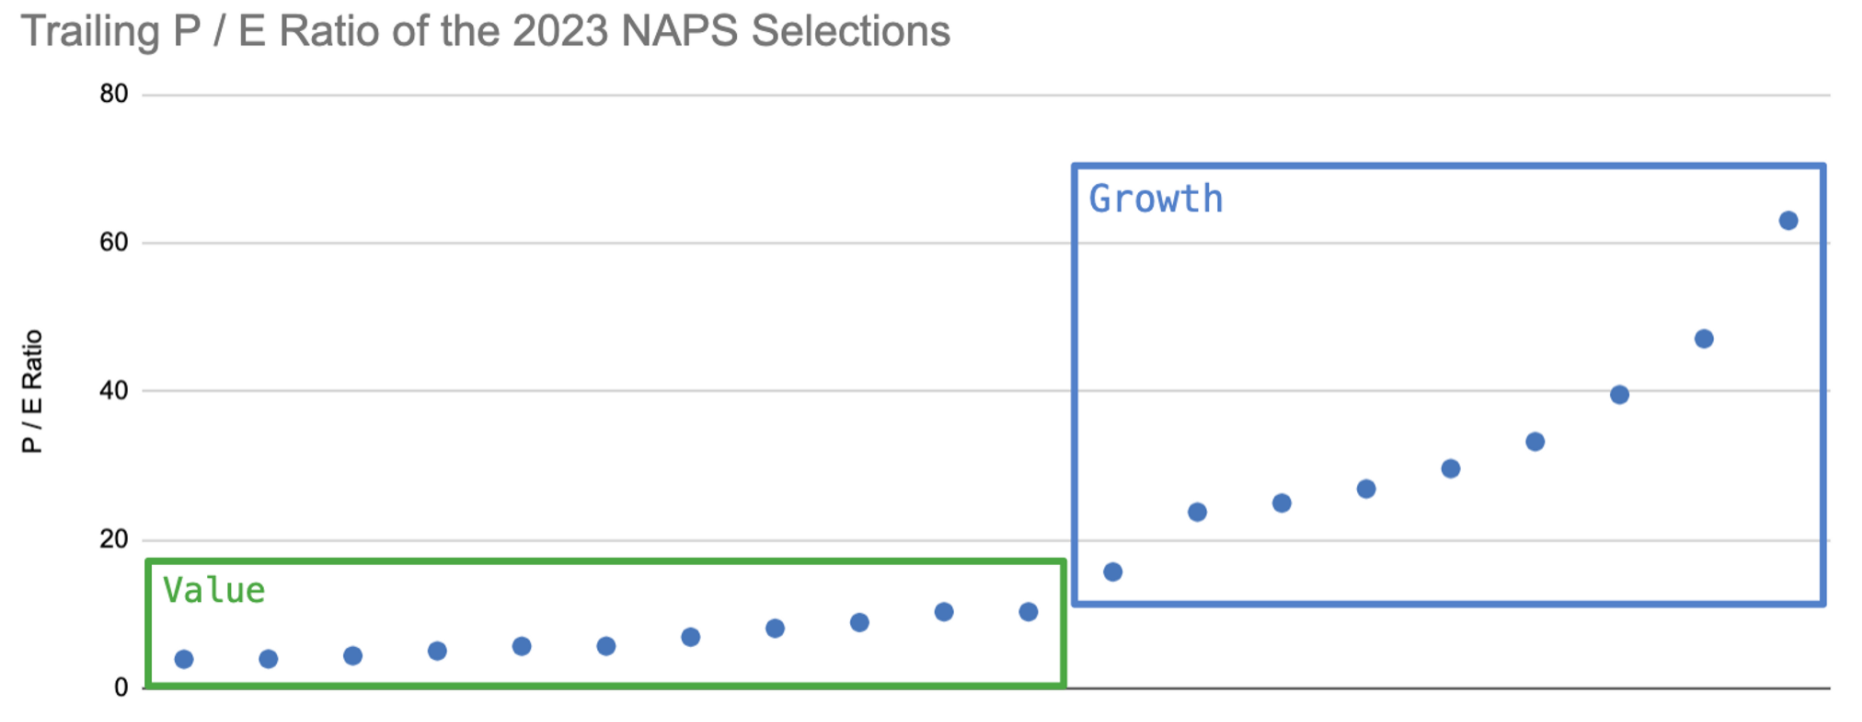
The thing I like about this approach to investing is that the portfolio is exposed both to value stocks (VM) and to growth stocks (QM) which means it should do fine no matter what style the market rewards - and it's doing fine over the long run that matters most. The median PE Ratio of the portfolio this year is 12 versus last year's 16 (the yield is 4.4%) but the spread of holdings is right across the range. You can see how the portfolio valuation splits down the middle.
2023 NAPS Portfolio Writeups
Thanks to Megan and Keelan who have done a fabulous job of writing up all the portfolio selections for 2023. We have published a nice, glossy version of this portfolio in a separate publication which you can download here.
AstraZeneca (LON:AZN)
In December, AstraZeneca’s chief executive Pascal Soriot was knighted for his company’s work in developing a Covid-19 vaccine. That vaccine generated $4bn of revenue for Astra in 2021 - a figure which is unlikely to be repeated in the upcoming 2022 numbers. Instead, Astra’s growth has been driven by higher margin oncology medicines - testament to the company’s heavy investment in research and development in recent years.
Strong profit growth and a string of positive clinical announcements helped Astra’s share price defy the weak trends in the wider healthcare market in 2022 and the company outperformed its sector by 36%.
Unsurprisingly, the shares now don’t come cheap, trading at more than 18 times next year's earnings. But in the context of forecast earnings growth of more than 30%, that valuation doesn’t look too unappealing.
Astra is one of the biggest spenders in the big pharma industry with an R&D to sales ratio of more than 20%. This expenditure served the company well in 2022 and will continue to fortify the company's economic moat moving forwards.
Bank of Georgia (LON:BGEO)
Georgia’s proximity to Russia (both geographically and politically) is a valid concern for Bank of Georgia’s potential UK investors. As is the company’s Belarussian retail banking subsidiary Belarusky Narodny Bank (BNB), which accounts for about 6% of operating income. The company has never been an especially popular stock, but the ongoing war in Ukraine has added further risk to the outlook. Shares are currently trading on just four times forecast earnings.
But for investors willing to stomach the risks, Bank of Georgia does provide access to a rare spot of economic strength. Georgia’s GDP grew 10% in 2022, supported by high consumption and strong investment demand. The company, which provides loans to consumers and businesses and operates a brokerage division, is forecast to deliver earnings growth of more than 40% in the year to December 2022. That earnings momentum has been matched by share price appreciation of more than two thirds over the course of the year.
And it’s not just share price growth which should satisfy investors. Bank of Georgia pays an annual dividend which is currently yielding 7.8% and is committed to buying back GEL112m, or £34.4m, worth of shares.
Central Asia Metals (LON:CAML)
Copper, zinc and lead producer, Central Asia Metals, has continued its strong operational progress by delivering record profits in the first half of 2022. Free cash flow from its mining operations in Kazakhstan and North Macedonia reached $52.1m for the period, allowing the company to repay the entirety of its corporate debt facility, whilst simultaneously raising the interim dividend to 10p per share.
Central Asia Metals’ focus on operational excellence and maintaining costs in the lowest quartile of the industry, has allowed it to effectively grow revenues and profits at a compound annual growth rate of 27.3% and 28% respectively, over the last six years. The company’s quality characteristics are exemplary, with a ROCE of 29.8% and ROE of 26.8%, ranking it among the top decile of its industry.
However, in the mining industry, the good times don’t last forever. Even if base metal prices remain elevated for the foreseeable future, Central Asia Metals revenues from its assets are expected to fall in future years, as mining resources are depleted. Management are now considering acquisitions to reignite future growth, but this will also inevitably carry its own risks.
Capricorn Energy (LON:CNE)
Shares in UK based oil and gas producer Capricorn Energy have notably outperformed the wider market in 2022, on the back of higher oil and gas prices that continue to mark a change in fortunes for the company.
Producing over 35,000 barrels of oil equivalent per day (boepd) in the first half of 2022, has contributed to an ever growing cash pile for Capricorn. Net cash now sits at $631m, even after $511m was returned to shareholders over the last six months. Indeed, when factoring the net cash position into account, we get an EV/EBITDA of 0.21, ranking the company as one of the cheapest in not just the oil and gas sector, but the entire UK market.
Capricorn’s wide range of exploration and production assets across the UK, Egypt, Mexico, Mauritania and Suriname puts the company in good stead to capitalise on the current elevated oil and gas prices. However, given the volatile macro-economic outlook and share price reaching multi-year highs, Capricorn’s management team may need to be more cautious in their capital management moving forward.
Compass (LON:CPG)
Catering giant Compass is a stalwart of the ‘classic quality’ family of companies in the FTSE 100. It consistently ticks the boxes for profitability and cash conversion, enjoys a market leading position and (outside of Covid-times) pays a well covered dividend. But rarely does its valuation or growth trajectory cause excitement for investors.
2022 was an exception on the momentum front. After shaking off the shackles of covid-enforced lockdowns, revenues bounced back above £20bn for the first time since 2019 and earnings more than doubled. The share price outperformed the FTSE All Share by more than a fifth.
But the valuation remains resolutely untenable. In the last five years shares have rarely traded under 20 times forecast earnings and the dividend (when paid) offers a yield akin to that of a bond at 2.23%.
In 2023, revenue growth is forecast to return to the characteristically steady low-single digit rate that long-term investors will be used to. Earnings will likely climb back to their pre-covid levels and are forecast to grow at an equally steady percentage. Shareholders typically receive half of those earnings back in the form of dividends and the cash from any surplus profits will be used to enhance shareholder returns via buybacks. Compass is back to being the company investors know: predictable, reliable, average.
DS Smith (LON:SMDS)
Packaging products specialist DS Smith ended 2022 strongly. A robust set of half-year results were announced in early December, with operating profits rising by 51% to £418m, on the back of higher box prices and resilient demand for products from consumer goods companies.
Manufacturing, collecting and recycling cardboard and paper-based packaging may be a mundane business activity, but DS Smith consistently generates enticing returns for its shareholders. It has demonstrated a unique ability to navigate the economic cycle, turning a profit every year over the last decade.
DS Smith, whose clients include giants such as Amazon and Unilever, has been a beneficiary of the global growth in ecommerce and this is feeding through to the company’s financials. Despite a 34% rise in the company’s share price since its October lows, the shares trade on a cheap forward P/E ratio of 8.5. This is even more impressive when you factor in EPS growth forecasts of 13.9%.
A strong fundamental backdrop has led management to raise the company’s interim dividend by 25%. However, management has also warned of an increasingly difficult macroeconomic outlook, with industrial sector demand particularly affected in recent months.
Fonix Mobile (LON:FNX)
In the year to June 2022, 18.4m people made over 700m payments worth £259m on their mobile phones, which were processed by Fonix Mobile. The company generated £53.6m of revenue from these payments which primarily relate to competitions, voting and charity donations organised by big media companies. And in 2023, most of that custom will be repeated - 99% of the company’s income is recurring in nature.
Fonix listed on the London market in October 2020 and was quickly embraced by British investors seeking high quality, growing revenues. In the six months immediately following its IPO, the share price doubled. Momentum has continued since then and in 2022, the company’s share price outpaced its peers in the uninspiring UK telecoms market by more than 30%.
But while repeat revenue is an attractive quality, sticky customers are hard to win. Most of the Fonix revenue growth (25% compound annual rate in the last five years) comes from increased spending by existing customers and now management is having to work harder to seek out opportunities in new markets. To justify a price to earnings multiple of more than 20 times, the company will have to prove it can attract international customers of the calibre (and stickiness) that it has done in the UK.
Imperial Brands (LON:IMB)
In February 2016, Imperial Tobacco changed its name in an attempt to distance itself from its smokey image. Six years on the turnaround plan that was promised at the time finally seems to be creaking into gear. In 2022, Imperial Brands managed its first net gain in market share since the name change. The share price outperformed the FTSE All Share by more than 30%.
But the company and its management don’t deserve all the credit for this shift in momentum. Imperial stock fits the profile that investors yearned in 2022: generous, reliable income (Imperial’s dividend is currently yielding 7.1%), defensive (people don’t stop buying cigarettes in a recession), and previously overlooked (the P/E ratio has barely risen above 5 in the past few years as investors avoided ‘sin’ stocks).
There are still concerns about the growth profile. Revenues in the year to September 2022 fell, despite an 11% rise in ‘next generation products’ - these products, which centre around the Blu Vape brand contributed less than 1% of revenue, and therefore failed to offset falling demand for the company’s tobacco products.
Indivior (LON:INDV)
Financial reports from Indivior make some investors rightly queasy. As of September 2022 the company had 73,800 patients on its injectable opioid addiction treatment Sublocade, up 72% on the previous year. The strong underlying market, which the company is benefiting from is a reflection of the crippling opioid epidemic sweeping North America and creeping into the UK.
Like most development stage pharma companies with significant spending requirements, Indivior is hard to value on any traditional metrics. But unlike its peers, the company spends more money on administrative (read legal) fees than it does on research and development.
The legal and competitive environment has hung like a black cloud over the Indivior investment case for many years. But there is no denying the demand for the company’s medicines is growing. Revenues are forecast to rise 14% to £900m in 2022 and 7% to £960m the following year.
Keywords Studios (LON:KWS)
In the last decade, video game developer Keywords Studios has provided a masterclass in growth by acquisition. When the company listed in 2013, annual revenues were €16m and the company was barely profitable. In 2022, revenues are expected at €668m (a 10-year compound annual growth rate of almost 40%) and net profits are forecast to be 63% higher than last year at €76m.
About half of that growth has been organic, the rest generated by the 59 acquisitions completed since IPO. Still, Keywords has kept a very clean balance sheet and despite increased borrowings, has never been in a net debt position. At the half year point, the company was sitting on €121m of net cash and since then has announced a further two acquisitions to be almost entirely funded with existing cash reserves.
The company’s growth profile and leading position in the fast-growing video game market has made it a popular stock in recent years. Shares have rarely traded under 20 times forecast earnings and yet the price has kept climbing. Now, with a trailing free cash flow yield of less than 3%, Keywords will need to keep delivering impressive growth to justify its lofty valuation.
Mears (LON:MER)
The outsourcing sector is no stranger to corporate scandals. Companies providing services to the under-funded social care sector are particularly closely scrutinised and in recent years, Mears has not been immune to negative press. Add in the fact that margins in the housing management division have weakened alongside the social care budget, and the collapse in demand for maintenance projects during the pandemic and it’s hardly surprising that Mears’ shares are trading on less than 10 times forecast earnings.
But compared to the wider housing sector, Mears’ 2022 was surprisingly positive. Revenues and margins recovered from their post-pandemic lows and the group is forecast to report normalised earnings of 23.2p per share in 2022, more than double last year. The pipeline for new contracts is also looking healthy, especially in the higher-margin housing management division of the business.
The company’s decision to exit the housing development market and sell its land assets has helped shore up the balance sheet and improve the management of working capital. But Mears remains a volatile stock and share price turbulence should be expected to continue. The well covered dividend which is currently yielding almost 5% should provide investors with some comfort through the volatility.
Netcall (LON:NET)
Shares in software products and services provider Netcall hit an all time high in December, after management confirmed increasing demand for its cloud solutions and a surge in new customer wins.
High growth tech companies can be hard to come by on the London markets, so it is unsurprising that they often command high valuations. Netcall’s shares currently trade on a forward price to earnings ratio of 30.5, and price to sales ratio of 5.
But management appears increasingly optimistic about the future, citing an exciting pipeline of growth opportunities. The company’s Liberty platform, designed to enhance digital transformation through automation, supports an ever expanding range of customers.
Forecasts back this up, with earnings per share growth of 44% expected in the coming year, and brokers repeatedly revising their forecasts upwards. Steady revenue and profitability growth, a solid balance sheet, and a growing market are all highly sought after traits for tech companies. Nevertheless, management will be under pressure to continue surprising the market as the shares push to achieve new record highs in 2023.
Shell (LON:SHEL)
Energy giant Shell has been a great beneficiary of the surge in the price of oil and gas in the last year. Earnings of $30bn from the first nine months of 2022 were only just shy of the all-time record for annual company profits set in 2008, leaving Shell on track for a spectacularly strong year. Consensus analyst forecasts are for normalised earnings to be twice as high as the previous year when management announces its annual results in February.
Accusations of profiteering from the war in Ukraine and the newly imposed windfall tax on big British energy businesses have tempered the upward march of the share price in recent months, but Shell remains one of the top performing stocks in the FTSE 100 in 2022.
There is still a hint of scepticism levelled at the shares, owing to their tight relationship with the energy price. If we’re at the peak of the cycle, Shell’s run of good fortune may be over. If we’re not, a price to earnings ratio 5.5x looks decent value.
Shell is seeking a greater balance between high carbon energy and renewables and is deploying some of its considerable cash profits into the latter. With supply constraints continuing to support the oil price in 2023, those cash profits should keep flowing.
Smiths News (LON:SNWS)
Smiths News has long held an attractive valuation. Distributing newspapers and magazines in the era of digital media is a tough business and as high growth stocks have soared, Smiths’ shares have been overlooked. A price to earnings ratio of 4.3x is roughly in line with the company’s recent history.
But in 2022, as value stocks have garnered attention, Smiths News has enjoyed a run of positive momentum not seen for many years. Since the announcement of an expectation-beating trading update in September, the share price has risen almost 50%.
Smiths’ convenience store McColls hasn’t survived the fallout from Covid-19 lockdowns and its insolvency left the company with a £4.4m liability payment in FY2022. But other solvency concerns have been removed: Smiths’ pension liability swung into a surplus in 2022, bringing with it a cash inflow that helped to reduce net debt to well within the agreed covenants.
Wafer thin operating margins and a slowing end market mean that Smiths is never going to grow at pace. But the print media industry isn’t going to disappear completely and as long as Smiths can outlast its peers, it should have some life left in it.
Steppe Cement (LON:STCM)
Malaysian-incorporated, Kazakhstan-based cement producer, Steppe Cement, is one of London’s more unique listings, but its impressive financial performance continues to defy market expectations. In the first half of 2022, the company shrugged off inflationary pressures and rising production costs to report a 65% increase in profits to $10.2m.
That momentum has continued in the second half of the year. A third quarter trading update (bizarrely released just one week after the half year numbers) revealed that revenues rose 13% in the first nine months. In the second half of 2022, Steppe’s shares outperformed the FTSE All Share by 35%.
Steppe Cement boasts a strong track record of profitability: the average ROCE and ROE over the last 5 year period stand at 18% and 15.8% respectively. Those profits are efficiently converted to cash which has historically been distributed to shareholders in the form of a generous dividend handout.
But Malaysia’s new regulation on foreign sourced dividend income forced the company to withhold its dividend payout this year and evaluate other means of returning capital to shareholders. This has since been resolved, but it highlights the risks involved with investing in foreign domiciled companies.
Telecom Plus (LON:TEP)
In 2022 multi-utilities company Telecom Plus enjoyed the dual benefit of rising demand (its bundles mean it can offer lower prices than its competitors) and rising prices (as the underlying cost of energy soared). Revenue rose 52% in the first half of the year, thanks to the addition of 170,000 new energy contracts. The growth in cheap energy tariffs has hurt margins, but Telecom Plus’ ability to squeeze profits from its assets has improved; ROCE and ROA were 19% and 10% respectively in the last 12 months.
Strong growth from such a high quality operator has unsurprisingly sent the share price up. Telecom Plus was among the top performers in the FTSE 350 in 2022, its share price outperforming the FTSE All Share by 47%. Shares now trade on 24 times forward earnings - well ahead of the company’s historical average..
It’s not unfair to argue that 2022 presented peak market conditions for Telecom Plus and the recent growth will be tough to replicate. But the company rewards loyalty and has a strong track record of customer retention. If the cohort of customers added during 2022 are tempted by higher margin telecoms contracts, revenues and profits should remain enticing.
Vesuvius (LON:VSVS)
Anyone who attempted to buy a new car in 2022 will be aware of continuing supply chain disruptions in industrials. Vesuvius’ attempts to help deliver components to its customers on time saw the company increase working capital substantially in the first half of the year. Investors weren’t impressed, especially amid fears of weakening demand owing to inflation. In July the share price dipped below 300p for the first time since 2016.
Since then, Vesuvius’ management has managed to reassure investors that the increase in the underlying price of raw materials is being passed onto customers and the group’s differentiated products and services have helped the company gain market share despite weak end markets. The company now expects to report earnings growth in 2022 and the share price has recovered strongly, outpacing the market by 24% in the last six months.
The investment case still has a value argument to be made. Shares are trading on 8 times forecast earnings, which is ahead of peers and in line with the company’s recent history. The dividend - which has grown at a compound annual rate of 5% over the last five years and is well covered by earnings - is currently yielding just under 6%.
Virgin Money UK (LON:VMUK)
Created through the merger of Virgin Money and CYBG in 2018, Virgin Money UK, was loss-making when the pandemic hit in 2020 throwing global markets into turmoil. Confidence in the company has taken a while to return, but shares enjoyed strong momentum towards the end of 2022 after pre-tax profits for the year ended 30 September reached £595m, a notable 43% increase on 2021.
Virgin Money benefits from a higher interest rate environment, as it generates more income from its lending than what it pays out on deposits. With the strong market tailwind adding to confidence, management have resumed dividend payments to shareholders over the past year, and announced additional share buybacks worth £50m in November 2022. This takes total buybacks for 2022 to £125m.
But the market remains cautious of the increasingly bleak global economic outlook. The potential threat of missed interest repayments, higher loan defaults, or mortgage delinquencies that could take a toll on a bank’s income might help to explain the lowly forward price to earnings ratio of 6.1. Virgin Money UK has set aside £52m to prepare for such risks. Should these not come to fruition, it could be set to enjoy another robust year in 2023.
Warpaint London (LON:W7L)
The absence of an expected pre-Christmas trading update has taken some of the wind out of Warpaint’s sails in the final month of 2022. Still momentum is certainly with the cosmetics group’s shares, which outperformed the FTSE All Share by more than 50% in the second six months of the year.
This momentum can be partly attributed to a very strong first half, which saw the company win new accounts with overseas retailers. International sales now contribute more than half of the top line. Warpaint’s house broker (the sole analyst to cover the stock) has also been raising expectations for earnings in both 2022 and 2023 periodically throughout the year, unsurprisingly creating more demand for the shares. If the company can continue to outpace its analysts expectations, it could justify its price to earnings multiple of 17.5 times.
Investors have long been sceptical of Warpaint’s potential market size. Cosmetics is a highly competitive industry dominated by well established brands housed within US and European conglomerates. But perhaps Warpaint’s budget-approach to the make-up industry will serve it well as recession looms in many of its key markets.
Wilmington (LON:WIL)
In 2022, the financial performance of business-to-business publisher Wilmington was flattered by two key factors. First, the resumption in physical events helped lift revenues across all divisions. Second, the disposal of subsidiaries for £23.4m lifted operating profits and allowed the company to pay back all of its debt. Investors liked what they saw and sent the share price up by almost 50% over the course of the year.
Disposals and acquisitions are not new for Wilmington. Like many companies which produce journals, books and events for other large industries, the titles in its stable are chopped and changed regularly. That makes historic profitability metrics quite hard to gauge. But, on average, Wilmington generates double-digit operating margins, a ROCE of around 15% and is highly cash generative.
Going forward, Wilmington’s performance should become more reliable as more of its publications shift online. Recurring revenues now represent over a third of the top line and should continue to climb. This outlook is reflected in strong analyst forecasts which have been upgraded three times in the last 12 months, going some way towards justifying a price to earnings multiple of 15 times.
Safe investing for 2023.
Disclaimer
This is not financial advice. Our content is intended to be used and must be used for information and education purposes only. Please read our disclaimer and terms and conditions to understand our obligations.
53 comments
Is there a ready made folio for these shares?
Thank you Ed. I’m a great fan of Stockopedia and really can’t imagine trying to invest in stocks without it now. I normally stock-pick, but in common with others that have posted here, I thought I would try the NAPS approach for the first time in 2022 (influenced also by having read the Magic Formula) …. and felt the pain!
You mention stop losses in one of your replies earlier. I have always used stop losses in the past but for some bizarre reason, I abandoned that last year, and then paid the price.
I suppose the risk with stop losses is that you miss out on a “bounce”, or try to have to time the market to buy-back in. But with so many of the 20 stocks down >30%, I think in retrospect I should have stuck to my rule.
Looking at this year’s portfolio, there are clear risks which need to be considered eg. geopolitical risk for Central Asia Metals (LON:CAML) and Steppe Cement (LON:STCM). It seems sensible therefore to apply a stop loss on at least some of the stocks.
Has any analysis been done into whether stop losses have any negative impact on performance? Or in fact, would if be possible to assess what the NAPS result would have been over the past 5 last years if a stop loss had been in place on the whole portfolio at different levels (eg -10%, -20%, -30%)?
Thanks again.
Stop losses of course would have worked last year but I did some analyst a few years ago and they would have had a negative impact on some years.
In 2020 there were some big winners, 4 were over 150%, 20% stop losses would taken you out of all of those. So not only would you have had a 20% loss but also lost over 150% gains.
In 2021 there were only 3 losers over 20% and then over around 30% at year end, so no real impact, about 1.5%.
If there is a market fall early in the year and then a recovery then stop losses may well have a negative impact.
Rusty2 - thank you very much - that’s really interesting - especially the 2020 analysis. That’s what I wondered. That highlights the importance of Ed point about having a re-entry strategy. Eg at the point a stop loss kicks you out at -20%, set an alert for if/when the price rises back to the original purchase level, buy back in and re-set the stop loss for -20%? I guess you might spend more on transaction fees but at least you would benefit from the bounce back. Thanks again.
@amshaw - in answer to your question:
Has any analysis been done into whether stop losses have any negative impact on performance? Or in fact, would if be possible to assess what the NAPS result would have been over the past 5 last years if a stop loss had been in place on the whole portfolio at different levels (eg -10%, -20%, -30%)?
No - I haven't analysed this, but it's a good one to add to my list. I'm keen to find the answer to this too.
On a more general basis though, I would say the following:
Personally - I use stop losses in my leveraged long-short NAPS system. I do this manually, but generally edge out of losing positions. It's always worked to minimise volatility so I have anecdotal evidence rather than data-driven evidence.
Much appreciated, thank you Ed. I think my comments on Rusty2’s post apply here as well - as you say - the question is if/how/when to re-purchase. I know the point of NAPS is to minimise effort so it has to mechanistic. I think your approach re edging out is something to consider. Thanks again.
Some quick calculations, with a 20% stop loss, 2022 year would have saved around 10%, so -5% instead of -15%, as long as Indivior (LON:INDV) was not stopped out, if it was then only save around 6.8%.
2021 save about 1.5%
2020 very roughly lose about 35%, but l need to check the shares more.
2019, gain about 1%.
2018, gain around 5%, not a good year.
2017, gain about 3%.
These figures may well be on the generous side, as the stop loss may have taken out shares that broke even or had small gain or losses, I have not checked every single one. These are only rough, as I don't have the exact lows for each share, the charts can be misleading.
Hi Ed. Last year was the first year that I invested in NAPS so this section of my portfolio has been really poor since Feb 2022 but I have stuck with the process probably to my cost. My question is what do I do now. Sell? Sit it out in hope that I get something back? Or what?
Thanks
Ed/Megan, I too would appreciate clarity on this. I guess the cue is in the process, i.e. sell at the end of each calendar year regardless, but it would be good to get your take on it as normally my investment policy outside my NAPS portfolio would be to sell if they drop 10% and sell 50% if they rise <20% (giving me a risk/reward of 2.5). But for NAPS 22 I haven't done that. I already hold STCM, INDV, SHEL, IMB. Should I sell all the 16 other stocks and buy into the new list, whilst topping up at this year's price for the ones I hold? I hope that's not asking the bleedin' obvious :)
This is a tough call, in theory the new NAPS should outperform last years, but there is no guarantee of that, so you could sell everything and use the money to invest in the new NAPS. 2022 was an unusual year, I'm not sure 2023 will be much different.
NAPS is set up to run for 1 year and start afresh at the end.
I have last years and this set up in my folios and I will run them to see which performs better. Note my NAPS are different from Ed's ones, I exclude certain stocks such as tobacco and palm oil.
We have now published the full portfolio and strategy in a detailed (colourful) PDF. Click here to download if you would rather read all about our 'Top Stocks' offline.
Megan, that link just takes me to the Today screen.
Hi Ed, many thanks for the article. I love the NAPS for its sheer simplicity and long term sensible approach. An interesting point is that if you look at the selections for the NAPS portfolio from 2021 the gain of 27% made in that year turns into an overall loss of around 7% by the end of 2022. This is greater than the loss on the 2022 portfolio and may contradict the argument to buy and hold.
@danviewstock - just to clarify your point:
"if you look at the selections for the NAPS portfolio from 2021 the gain of 27% made in that year turns into an overall loss of around 7% by the end of 2022"
I guess what you are saying is this: If you bought the 2021 NAPS and held them for 2 years, the entire gain in the first year would have been wiped out in the second year. I haven't calculated it myself, but I wouldn't be surprised if that's the case.
You actually gain in 2 ways from rebalancing. Firstly, you roll into higher ranked stocks (higher factor exposure), but you also earn what's known as a 'rebalancing premium'. I'll go into that at some point in a future piece.
The rebalanced portfolio earned a gain of 8.8% over 2 years versus the 7% lost through 2 years of buy and hold.
Hi Ed, thank you for the NAPS Portfolio report. I'm a newbie and would like to build a folio to track the NAPS initially before considering investing in it. Where can I find out the proportions (i.e. %) each of these shares that make-up the NAPS Portfolio so I can track it as accurately as possible.
Hi gweinstein, To answer your question The NAPS portfolio has equal investment in each stock.
Happy new year Ed,
It’s always a pleasure to read what you write.
I find the new year share reviews an enjoyable read along with the usual quizzes.
It’s entertaining as well as an intellectual exercise .
Investment is my hobby as I have other sources of income.
I don’t know much about screening or charts but follow the news and read everything as I am 71 and retired.
Interesting to know that my portfolio is better than the ftse all shares over 1,3,5 years.
For this year I have chosen a few which are not in your NAPS : some housebuilders, a few investment trusts (SMT, GROW), and two financials.
I think one year performance is too short time period and five years is too long!
Thanks Ed. Very insightful as ever.
My thought and very much request for you and wise people to comment is around whether after the mad 2022 that things like NAPS will struggle from that effect after a train strike where "all the trains are in the wrong places" leading to a second day of delays. By that I mean that the candidates for this year are the 2022 "survivors party". That may mean that their very strength in surviving 2022 means they are unlikely to be beneficiaries of whatever this year holds.
The fact that the previous 10-12 years were sort of "steady state" meant that this type of rolling strategy worked, but I wonder if in turbulent times, you need to pivot a bit more in the choice of systems like this.
@TherealTim - it's true that with a momentum loading most of the stocks in the NAPS this year had positive returns over the last 12 months (as they will have had in any year). I guess what you are implying is that you think shares that have risen in the last 12 months may have a tendency to mean-revert this year?
That could be the case. Though it might not. There isn't much historical evidence for higher momentum stocks to underperform through bear markets - they can be quite resilient. There is though evidence that they can lag the rise in the recovery from bear markets.
It's worth remembering that half the portfolio is in quite deep value stocks - while they are on the rise, there's no reason to presume they won't keep rising. Value sectors (like Energy) have been out of fashion for years - hence the single digit PE ratios. Here's a slide from a recent webinar I ran. It's from AQR - a factor focused hedge fund in the US. It shows the spread between the valuations of cheap (value) stocks versus expensive (growth) stocks.
It may be that the structural shift to value has just started, in which case the "VM" part of the portfolio may continue to outperform.
Of course, it might not. What if inflation has peaked, what if the fed pivots within 6 months. Growth stocks may have some pain relief - and fund managers do like to roll into high beta names. That could benefit the high QM half of the portfolio.
I can't predict the future, it's not a game I like to play. But if I had to place more concentrated bets, I'd probably load 75% into value & momentum stocks. It's the most perennial strategy of all.
Here's an old article I wrote on value & momentum everywhere.
Ed Croft, please
you need to consider fixed income.
For almost a year now there has been an opportunity in falling bond prices, the possibility of a real yield and maybe a capital gain. Higher rates for longer, inflation and reduction of earnings estimates are deadly for stocks.
It is about order flow. Where do you think all the buyers have gone? The fixed income market is much larger than the stock market.
A few simple tables giving the issuer, coupon and maturity will do it.
You have all the computer capacity, it just needs to follow the trend.
You had the intelligence to recruit Edmund Shing who has written several times about ETFs that can capture the move but we need more than that. More than the ORB too (Order book for retail bonds). There are minimum investment requirements but quality information will attract big hitters. For some time I have been looking for the sites that flourished in the aftermath of the Great Financial Crisis when bank preferred shares sold as junk but they seem to have disappeared with the relentless flood of easy credit.
You had the intelligence to recruit Megan Boxall who tracks the smart money moves in the large cap space.
Yet subscribers still flock to the UK small cap forum.
Of course the odd take-over from the U.S. with sterling so low will add spice but in general the discount rate of future cash flows has killed growth.
Stockopedia was a phoenix in a risk-on revival. NAPS results are the writing on the wall.
If you heed me you will not have to worry about Share-Pad-Scope-Vector-Vest competition.
I have been following this project for the past few years, and always makes for very interesting reading. Seems like a pretty decent set of companies selected this year. I am tempted to invest for real with this portfolio as an invest and forget till 2024.
Hi Ed.
A fascinating article. I already had a number of these companies in my portfolio. However, I am underweight in Healthcare, Telecoms, Tech and Utilities so I will have a good look at your stock picks in these.
Have a great New Year and thank you for Stockopedia ( and the Naked Trader who recommended you). It has made my life so much easier.
Hi Ed, would be very helpful to see the stats if the PI rebalanced using your half year NAPS, and whether this improved the performance.
Yes i am also interested in a half year rebalance.
Thanks so much for this Ed. I have found Stockopedia fantastic over the three years I have been a member.
Naturally I'm pleased to see a few stocks I already own (BGEO, CAM, IMB, SHEL, STCM) in the NAPS 2023.
The strong momentum bias continues, and some of the Growth shares are bold picks - its hard to imagine many people feeling confident about high PE ratio stocks for the coming year. This group of shares is up 20% in 2022 - can it really outperform again in 2023?
That's the magic of NAPS though - everyone will have their view, but ultimately the system makes the picks and avoids cognitive biases as the year progresses. And it has done pretty well for 8 years!! But as usual I will pretend that I can do better, and will pick and choose from this group! I'm adding SNWS but nothing else....
Happy New Year to all, and keep posting, its educational.
Dr Dave - yes I have to admit I have my own anxiety about the list being “up 20%” in the last year. That’s the nature of momentum - you are always buying shares stronger than the market and it feels doubly wrong in a down market. You feel that you should be bottom fishing instead.
There is evidence that momentum “crashes” at the bottom of bear markets (in long/short portfolios). What that means is that it’s the very worst momentum stocks that end up dramatically outperforming when bears turn. But that doesn’t mean that good momentum stocks don’t show positive gains too - just not as much.
The good thing is that much of the portfolio is trading at low single digit PE valuations. That value bias should give stability. We shall see.
Brilliant. Thank you.
Ed, how who do you do it at 01.48 on New Year's Day?
Also, the stock profiles reflect sound judgement and in-depth
knowledge. I'm ashamed to say I learned someting new about
several shares ( AZN, BGEO, SMDS, INDV, SHEL) that have been
in my portfolio for a year or two, or more!
Hayton - good spot. I’m in Australia till 7th January (am married to an Australian) … so am posting at some upside down hours.
Nice one Ed, I love your NAPS's . Having pulled this 2023 NAPS to pieces I note 2 holdings that I have, Central Asia Metals (LON:CAML) and Shell (LON:SHEL) are QV which is encouraging for me. I'll continue to monitor the NAPS 2023 and also my virtual My Naps which I set up in July 2022. You might be interested to know that this one stands at a 1 percent loss as of now and the share with the greatest gain is standing at plus 41.9 percent and the greatest loser at minus 37.4 percent with the median right in the center. I like your vertical bar graphs with losses on one side, gains on the other, how I wish I could make one of these up. My portfolios have lots of ground to catch up on worse luck but at 78 I may have more time than the well-respected Johnylaz.
Great Stuff! Using a VM / QM strategy is really about managing volatility not necessarily maximising profits. Over a 10 year period would you get a better absolute return picking only Super Stocks in Cyclicals rather than mixing stocks in Cyclicals and Defensives? I spreadbet on US market, restricted to large stocks and am always roughly 70% long on high ranking stocks and 30% short on low ranking stocks and the shorts have saved my bacon this year. The payoff is I get reduced return in good years but the lower volatility keeps me solvent and the shorts let me sleep at night in case Putin turns off the oil taps and everything goes pear shaped....
Wishing I possessed you skills, good luck in 2023.
I think your approach is interesting and I have created a new post about it to avoid cluttering up this one with a side issue. If you have time I would appreciate your thoughts on the new thread. Thanks
I have used the same criteria as you but focused on the UK plus US market. Why cut out the largest market in the world? So, one screen with both QM and VM > 90. In addition I have added Q>90, V>90 and M>90. Very few UK stocks appeared so I ended up focusing only on US stocks. The portfolio that emerged had a 39% increase over the last year compared with -20% for the S&P500. Every stock emerged with a SR>95.
I then downloaded on to a spreadsheet with
P / E, Yield, ROC, NET Gearing. Etc. Etc as you suggested in your midyear SNAPS article
% TTM. %TTM. %TTM
The whole folio came within the limits set by you for these criteria as well as most of the stocks.
So I am thinking of investing in this portfolio but at 85 I can’t afford for it not to work as I may not have enough time to recover. It won’t take you long to replicate what I have suggested and I would be interested to hear what you think of the above.
Happy New Year from my home town, Cape Town.. Absolutely beautiful weather today so I aim of tom the beach while I wait for your reply.n. Cheers. John
John, I've always said that the NAPS process is like a jazz chord sheet to improvise from, rather than a classical score to rote learn and recite.
The principles are what I believe work (over the long term) - expose to factors, diversify, rebalance.
The implementation comes down to personal situation, tax, portfolio size, geography, income preference and so on. Some use other regions, some use other rules, some use different holding periods, some use stop losses etc etc.
When you say "I can't afford for it not to work"... I presume you mean that you want to guarantee gains for the next 12 months . The problem with equity markets in general is that they tend to decline once in every 3 years, and the sequence of that is pretty random. So there's no guarantee of good results in the short term.
There's also no guarantee of good results in the long term. I do though know my market history, and all I try to do is align my own portfolio with the principles of what's worked in the past. The rest is left up to the whims of Mr Market.
Thanks for your response, Edward.
I am aware of the problem with equity marketsis that one cannot guarantee gains for the next 12 months, or any length of time. It is a probability game.
However, you did not respond to the interesting fact that the UK 2022 NAPS Portfolio fell by 15% through 2022 while the US (slightly modified) NAPS increased by 39%. during the same period. And my screening, despite being for both UK and US stocks, produced virtually no UK stocks. I'm not sure why this should be so. Maybe because the number of US stocks is many times the number of UK stocks.
This all seems to indicate that one should invest exclusively in US stocks and forget about UK stocks. Yet you restrict the NAPS portfolio to only UK stocks. Why?
Johnylaz... you are making a common mistake in your calculation.
"I have added Momentum>90. The portfolio that emerged had a 39% increase over the last year compared to -20% for the S&P 500."
The list you've generated has "high momentum" today - by definition all those stocks would have dramatically beaten the market over the last year. You can't compare that with a list of high momentum stocks generated a year ago.
A comparable USA only NAPS list generated 1 year ago is down 20% in 2022.
---
On a different note - my NAPS list is a UK-only portfolio. That's for historic consistency. The NAPS portfolio has been running longer than we've had international data on the site.
Using VM > 90 and QM > 90, I looked at only UK I stocks and came up with a portfolio similar to yours, obviously not exactly the same, probably due to the time lapse.
I then did the same thing with both UK and US stocks and the resultant portfolio had very few UK stocks and those few stocks could easily be exchanged for US stocks.
So I had two portfolios a NAPS UK and a NAPS US which I could compare
One year Increase for NAPS UK = 20.36% compared with -33.89 % Nasdaq composite Index
One year Increase for NAPS US = 58.53% compared with. -19.95% S&P 500 Index
Indecently both portfolios had M scores of virtually all the shares >90.I then compared each the two portfolios according to your criteria in “The perfect stock does not exist... stop searching for it” Jul 29, 2022
P / E TTM
Yield TTM (%)
ROCE TTM (%)
Net Gearing Latest (%)
Op Mgn TTM (%)
Rel Strength 1y (%)
EPS Growth TTM (%)
EPS CAGR 3y (%)
CRITERIA
<15
>0
>15
<50
>3
>0
>15
>15
NAPS UK
18.93
3.18
27.39
-21.88
38.39
25.36
53.70
15.45
NAPS US
6.54
0.46
30.75
-43.47
22.68
101.67
152.20
18.08
Here is the NAPS US portfolio.
Ticker
Name
Sector
SWIOU
Southwest Iowa Renewable Energy LLC
Basic Materials
RFP
Resolute Forest Products
Basic Materials
HCC
Warrior Met Coal
Basic Materials
ETD
Ethan Allen Interiors
Consumer Cyclicals
BCC
Boise Cascade Co
Consumer Cyclicals
JAKK
JAKKS Pacific
Consumer Cyclicals
PRDO
Perdoceo Education
Consumer Defensives
SDSYA
South Dakota Soybean Processors LLC
Consumer Defensives
WTI
W&T Offshore
Energy
CEIX
Consol Energy
Energy
PMTS
CPI Card
Financials
ENVA
Enova International
Financials
ASRT
Assertio Holdings
Healthcare
VASO
Vaso
Healthcare
ATKR
Atkore
Industrials
LMB
Limbach Holdings
Industrials
PERI
Perion Network
Technology
VIPS
Vipshop Holdings
Technology
TKC
Turkcell Iletisim Hizmetleri AS
Telecoms
GNE
Genie Energy
Utilities
My plan is to invest equally in both portfolios.
Hi Johnylaz
Thanks for posting the US NAPS, very interesting.
I hope you don't mind me making a small suggestion.
I tried to find the first company on your list - Southwest Iowa Renewable Energy LLC - on both HL.co.uk and degiro, without any success.
So perhaps upping the lower market cap threshold might give a more realistic buy list for UK/European-based subscribers.
Thanks again
A
HI Abtan, good suggestion. I shall do it. Cheers
.
Hi Johnylaz
Sorry to throw another spanner in the works, but I've just noticed that the second company on the list - Resolute Forest Products - is currently being bought by another company.
The deal was announced in July 2022, but is only expected to go through in 2023.
Upside here will, or rather should, therefore be limited.
A
Is this portfolio wef 1/1/2022 or 2023?
Picked some real US small caps with little to no coverage.
Why have all my posts gone into threaded mode when I had unthreaded selected?
For about a year and a half I've been combining Nicolas Darvas types charts with the NAPS, they complement each other quite well as they both have momentum at their core, NAPS for the stock picking (i dont always go for the top two) and Darvas for entry and exit. So far, touch wood, its been going very well and I'm strongly up, but I must confess using this system meant a high percentage of my portfolio was cash during 2022
Hi Ambrosia, Sounds interesting! Could you explain what are “Nicolas Darvas type charts” are, or where we can find out more? Many thanks
@amshaw
This is Nicholas Darvas's famous book - https://www.amazon.co.uk/How-M...
I'd recommend watching a YouTube video on Darvas, his charts are quite simple and easy to implement, but beware, what I'm advocating rips out the fundamental attraction of the NAPS, you can't leave it and come back in a year, I go through the charts once a week and trade as and when
Thank you - I’ll take a look
If you are interested in my rudimentary market timing indicator - I mentioned it in the half year NAPS article. I track the 120 day Moving Average on the FTSE AIM All Share. It's been an extremely good barometer of changing private investor sentiment in the UK, and has led to strong trend following returns.
The index came close to breaching the 120d MA, but still no joy.
Great article, but a little depressing for me as an addicted UK small cap stockpicker to see how badly AIM and small cap stocks performed, at least based on the performance of the relevant indices. Made me wonder how much time one should justifiably spend on small cap stockpicking, as part of a rational investor strategy (building a well diversified international portfolio without too much risk etc).
However, as a stockpicker, it is always rewarding to find 'big winners' and I was reassured to find that out of 27 UK stocks which were up by 100% or more in 2022, 25 were in the AIM Allshare (out of a total of about 760 stocks) and only 2 in the FTSE Allshare (out of about 520 stocks) and none in the FTSE100. So the chances of finding a big winner were actually higher at just over 3% in the AIM Allshare population than in the FTSE Indices despite the overall disastrous AIM index performance. Of course there were no doubt more big losers, but the point remains that in principle you had a roughly 1 in 33 chance of finding a big winner.
If one was less greedy/ambitious and settled for a 50% gainer, then there were 61 in the AIM Allshare, 11 in the FTSEAllshare and 2 in the FTSE 100, so relative to the Index populations, the AIM index was again the best hunting ground.
Even if you just wanted to exceed a cash return of about 0% or avoid losses, the 140 AIM Allshare stocks which did so (18%) were not too far behind the 104 or 20% of the FTSE Allshare which managed it, but well behind the 27 in the FTSE 100.
So, all in all, it was theoretically possible to do ok or even better in AIM stocks than in larger caps, assuming you did some excellent stockpicking. Of course, stockpicking smallcaps is rather time consuming (and heavy, not to say boring) work if it is to be done well (lots of dyor as Paul says,) even with the fantastic support of Paul and the smallcaps team and the many Stocko tools, and even then results are not guaranteed. In conclusion, I have reassured myself its worth carrying on with the addictive AIM/smallcap hobby for another year but I appreciate your work in designing a solid performing 'No Admin Portfolio System (Naps)' which I can turn to one day. My wife will also be grateful to you.
Sorry for going on so long and thanks for another good job done. Happy stockpicking to all in 2023. Cheers Prof O-M.
Not sure if this is 120 trading days or 120 calendar days?
It's 120 trading days.
Thanks, so about 6 months.