SIF portfolio H1 review: when above average isn’t good enough

2026 has been a mixed year for my rules-based SIF portfolio. While markets have remained relatively strong, my rules left the portfolio positioned for more bearish conditions. As a result, I’ve underperformed slightly on both income and capital returns.
SIF generated a total return (including dividends) of 3.9% during the six months to 30 June. This compares to an equivalent figure of 7.2% for the FTSE All-Share Total Return index, which I use as a benchmark.
I’m hopeful that this gap may narrow by the end of the year. But in any case, no strategy can outperform every year. As I highlighted in my 10-year review in April, SIF has only outperformed the market in five of the last 10 years, but has still outperformed overall since 2016.
I’ll look more closely at the portfolio’s performance below and explain the issues that have been highlighted so far this year. I’ll also summarise the trades I made during the second quarter, with a review of each new buy and a summary of stocks sold.
First, here’s a brief reminder of how the strategy works:
I select new shares from my SIF stock-buying screen in a weekly review, adding new shares when possible, while taking into account diversification by sector and the number of existing holdings;
Shares are held for a minimum of nine months. However, if a stock issues a profit warning or falls by more than 25% below the portfolio’s cost price, it’s sold at the next weekly review;
After nine months, I test shares against my SIF stock-selling screen. If they pass all the rules, they remain in the portfolio subject to a rolling monthly review. If they fail, they’re sold.
SIF is a model portfolio, but I invest a portion of my own real-money portfolio in the same shares.
SIF Q2 2026 performance: cash drag
The average long-term annualised return from the UK market is about 7%. So in an average year, a total return of 3.3% in one quarter wouldn’t be a bad result:
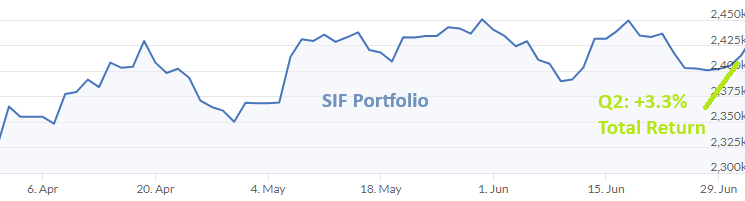
Of course, the average year doesn’t exist. Each year is either better or worse than average. So far, 2026 is shaping up to be a better-than-average year for the UK market. If this continues, then the portfolio’s high cash weighting could continue to drag on performance.
At the end of June, more than 40% of the portfolio was in cash – and this proportion was even higher at the start of Q2:
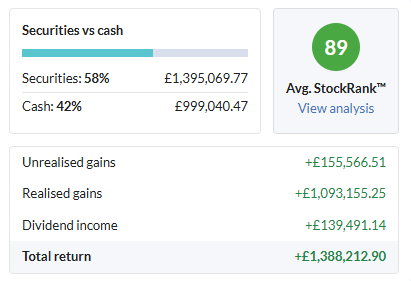
If markets had turned south in Q2, a big cash weighting would probably have given me a relative advantage. But that didn’t happen. Instead I was left with a situation where only half of the portfolio’s capital was deployed during a period when markets were rising.
The high cash weighting has hit income too, as I don’t model any interest income from cash held in the portfolio (in real life, I use money market funds to mitigate this issue).
Here’s a more detailed overview of the portfolio’s performance for both the second quarter and the first half of the year:
Q2 2026 | Price Return | Income | Total Return |
SIF Folio | 2.3% | 1.0% | 3.3% |
FTSE All-Share | 3.8% | 0.9% | 4.7% |
H1 2026 | |||
SIF Folio | 2.5% | 1.4% | 3.9% |
FTSE All-Share | 5.3% | 1.9% | 7.2 |
Zooming out to take a longer view, here’s how SIF has performed against the All-Share TR index since the start of 2025:
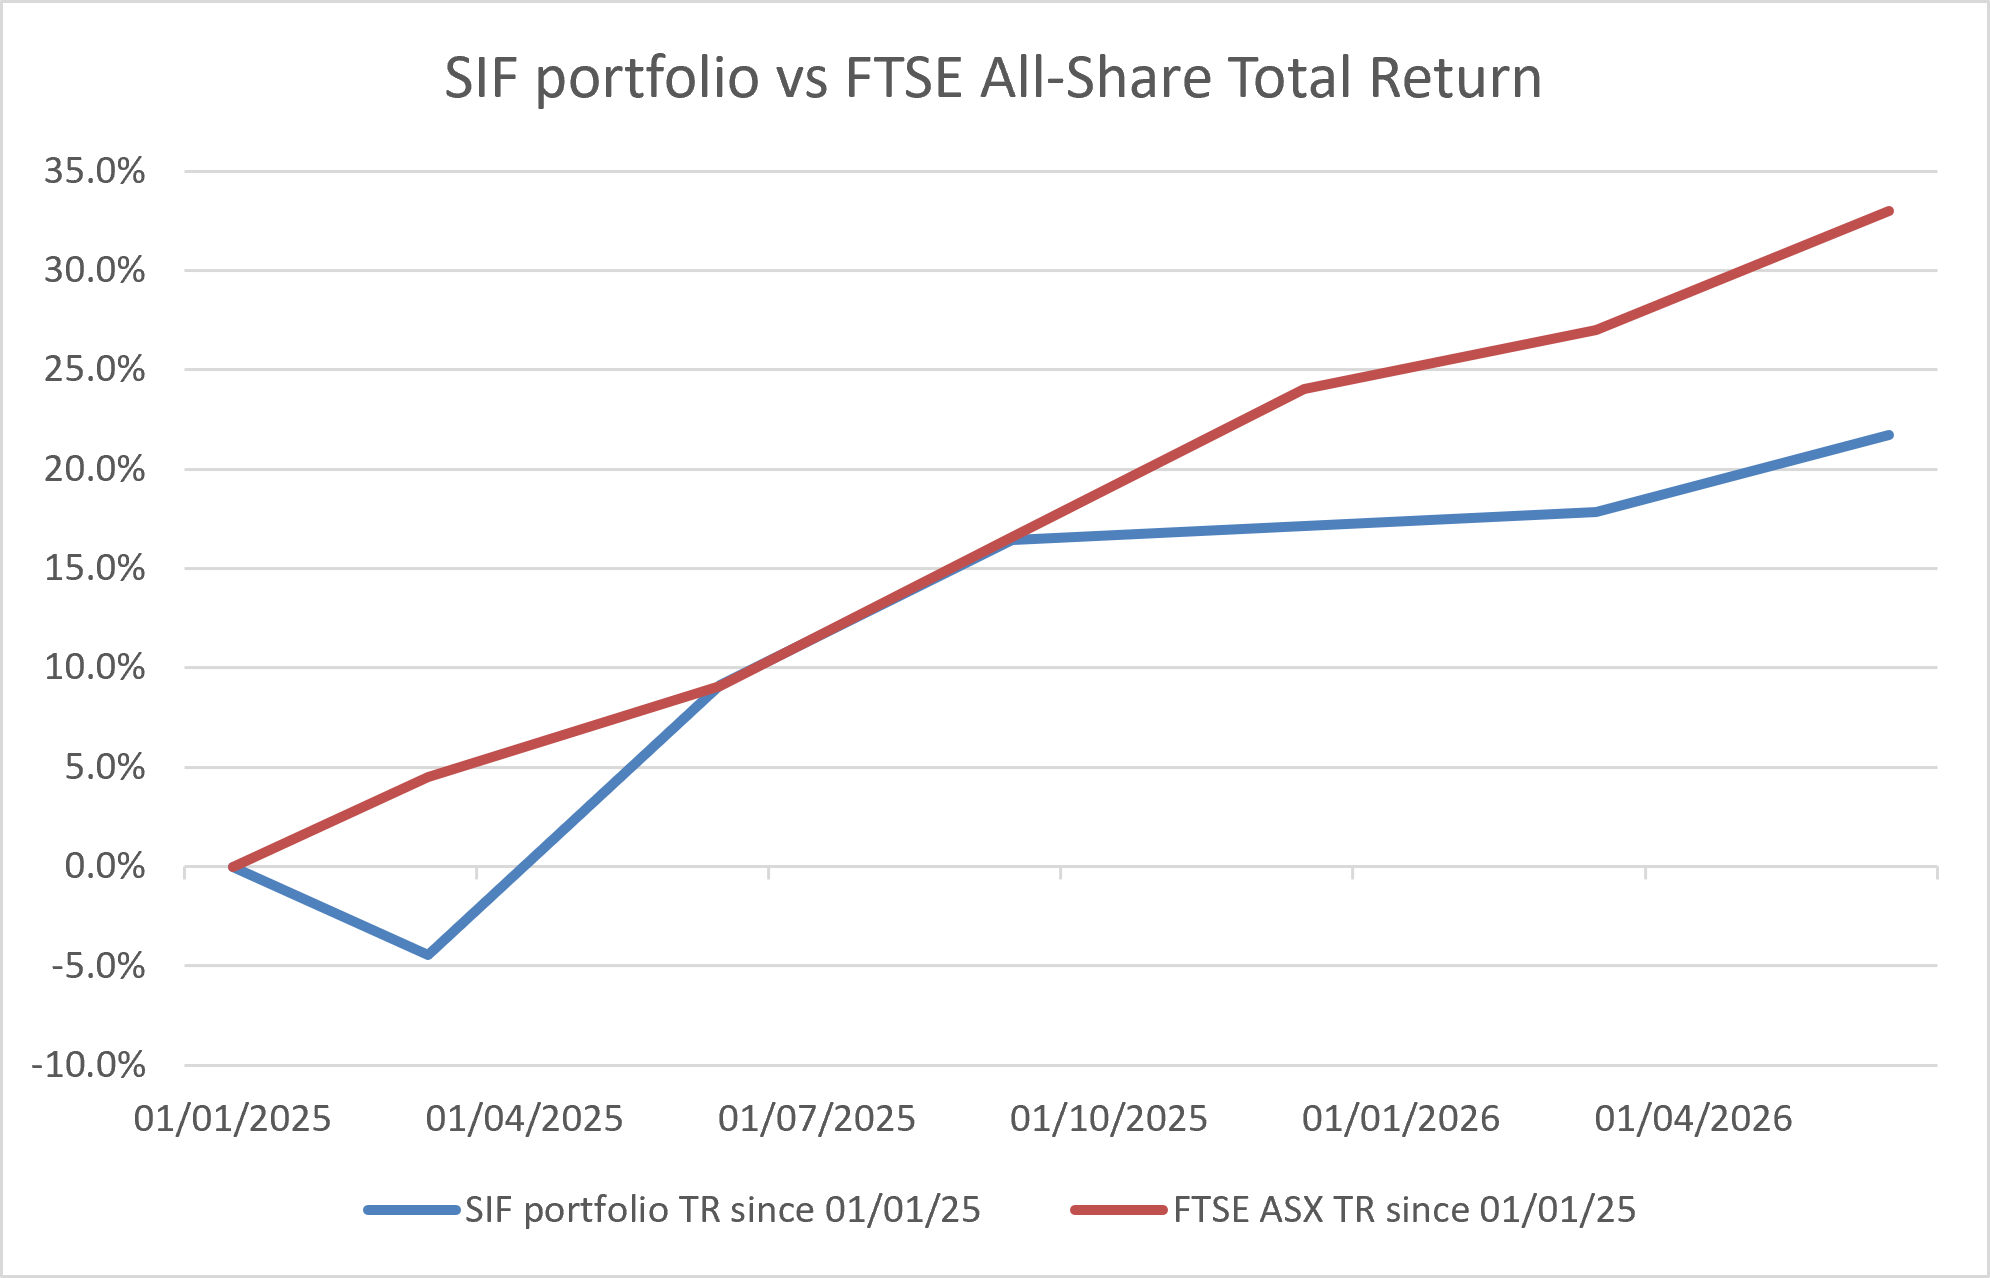
A 22% total return in 18 months would generally be a good result, if it wasn’t for the 33% gain achieved by the market over the same period!
The lesson from 2026 to date is that I may need to reconsider how much cash I allow to accumulate. This would be a fundamental change to the strategy, so I’m not going to rush any changes. I will revisit this topic in my year-end review.
Note: I’ve presented performance from the start of 2025 because that’s when I switched the portfolio’s strategy to include dividend returns. Prior to 2025, I didn’t include dividends, so performance was measured differently. I’ll produce a blended chart showing the portfolio’s full history at the end of this year.
SIF Q2 portfolio review
The portfolio is sized to support c.20 equal-sized holdings, with a cash buffer to preserve liquidity in the event of a market crash.
The actual number of holdings at any one time is dictated by the output of my buying and selling screens, not by me.
My buying screen became more prolific during Q2 and the last three months have been a period of net buying for the portfolio. At the end of June, SIF had 14 holdings, up from just nine at the end of March:
Q2 Buys: 8
Q2 Sales: 3
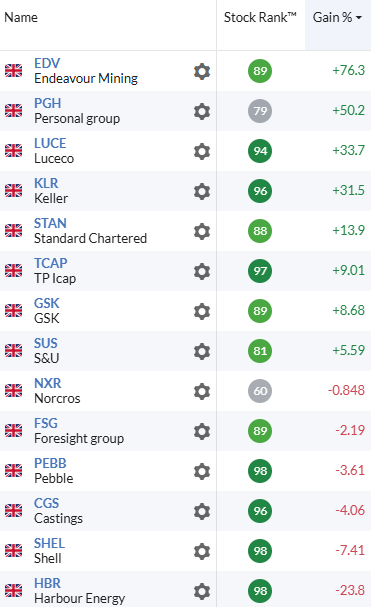
Portfolio snapshot
Here’s how the portfolio looked at the end of June 2026, after any month-end sales:
Portfolio metrics
The evolution of the portfolio over the last 18 months can be seen more clearly with the aid of this table below. I started tracking this set of metrics at the start of 2025 to give me a clearer understanding of how the aggregate characteristics of the portfolio were evolving:
Period | P/E rolling 1y | Div yield rolling 1y | PEG rolling | Cash weighting | No. holdings |
Q1 2025 | 9.7 | 5.3% | 1.0 | 13% | 18 |
Q2 2025 | 10.2 | 5.0% | 1.9 | 5% | 21 |
Q3 2025 | 10.3 | 4.8% | 0.8 | 13% | 20 |
Q4 2025 | 9.8 | 5.3% | 0.9 | 30% | 16 |
Q1 2026 | 8.6 | 6.1% | 0.8 | 56% | 9 |
Q2 2026 | 10.6 | 4.8% | 0.9 | 33% | 14 |
While the stocks in the portfolio remain relatively cheap, the increase in P/E and falling dividend yield suggest valuations did rise in Q2. This is in keeping with what I’d expect, given the wider market backdrop.
The wide swings in the number of holdings in the portfolio is also highlighted here. I’m hoping for a further increase in Q3, which should also boost income performance.
In the remainder of the article, I’ll provide a summary of the changes to the portfolio during Q2 2026.
New stocks in Q2 2026
Keller (LON:KLR)
I bought Keller in April thinking that I might already be too late. After all, this was a low-margin civil engineering group whose share price had already tripled over the previous three years.
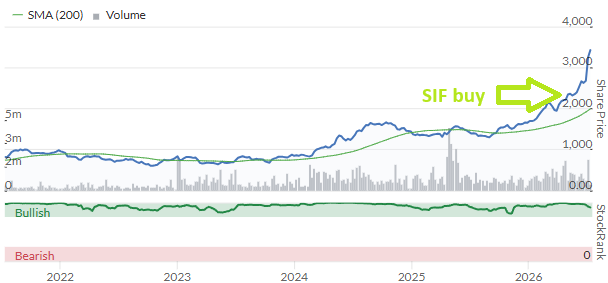
I’ve always had plenty of respect for Keller’s market-leading expertise in complex groundworks for major infrastructure projects. But I hadn’t appreciated the current momentum in the business. This is being driven by the US market, where the combination of the AI data centre buildout and some major infrastructure projects has caused demand to surge.
Earnings forecasts have continued to edge higher and the stock has continued to motor. The shares then exploded upwards earlier a week or so ago, when the company advised investors to expect full-year profits “materially ahead” of expectations.
Updated consensus estimates haven’t yet filtered through to the StockReport, but I think it’s reasonable to budget on a c.10% increase to previous consensus, given use of the word material:
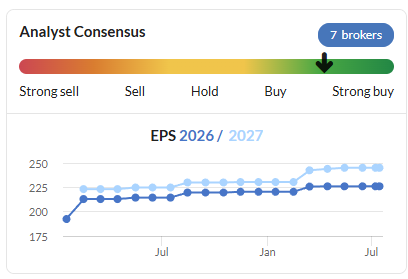
I can’t deny a lingering feeling of nervousness, though. This can be a cyclical business and the current level of demand may not last indefinitely – in the DSMR, James highlighted a large, potentially one-off highway project in North America as an example of this.
The shares aren’t obviously cheap anymore, either:
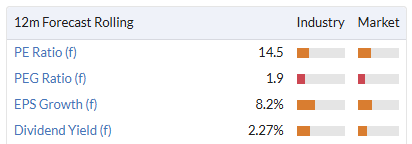
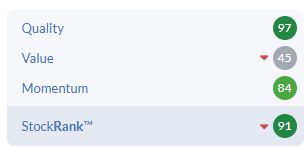
Ultimately, Keller’s High Flyer styling and falling ValueRank probably tell the story. While the going is good, the shares could rise further. But if momentum flags, then investors may need to watch out below…
I added Keller to SIF at 2,008p on 7 April 2026.
Luceco (LON:LUCE)
Ed’s latest article highlights the outperformance of StockRank ‘Jumpers’.
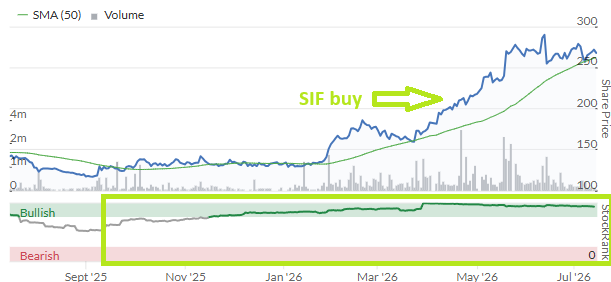
Luceco’s recent StockRank jump wasn’t quite large enough to meet Ed’s criteria. However, the algorithms have turned steadily more positive on this supplier of electrical parts this year and this has been mirrored by the share price:
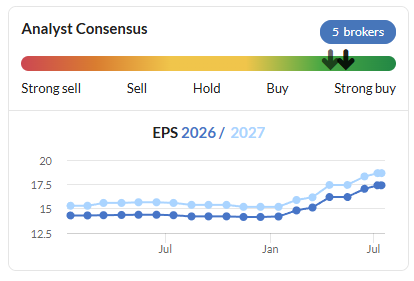
Scrolling down to the analyst consensus trend chart on the StockReport explains the rapid improvement in sentiment.
Earnings forecasts have risen by more than 20% this year as Luceco has reported rapid growth in demand for its EV charging products:
What could go wrong? I’m fairly sure that structural demand for EV charging will continue to increase. Competition may also get tougher, though, and I think it’s interesting that long-serving CEO John Hornby has decided to retire this year.
Hornby has been in charge for 21 years and is also a 15% shareholder in the group. As Mark highlighted on the day of the announcement, he’s also been an astute judge of when to buy and sell shares in the company. Most recently, he’s been selling:
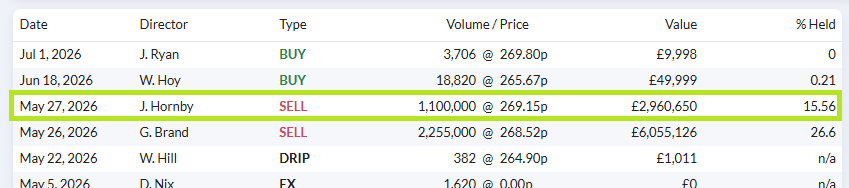
I’m not worried about Luceco’s near-term performance, but I do wonder if Hornby’s departure and the stock’s High Flyer styling could be a clue that a cyclical peak is approaching.
I added Luceco to SIF at 202.4p on 14 April 2026.
TP Icap (LON:TCAP)
TP ICAP is a business I see as a countercyclical hedge to the wider equity markets. As a leading interdealer broker, it’s heavily wired into the global currency, interest rate and commodity markets. When market conditions become more volatile, TP ICAP’s institutional clients often become more active, driving higher revenue and profit for the business.
We’ve seen this recently, prompting the company to upgrade its financial guidance:
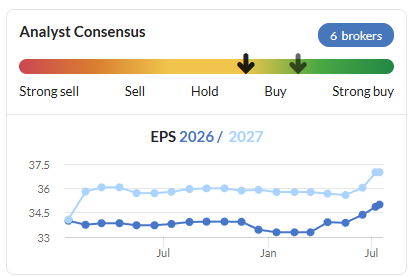
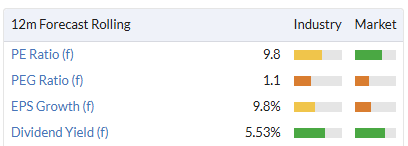
I’ve held this stock profitably in SIF once before and am hoping for a repeat performance in 2026. For now I’m happy to collect the 5%+ dividend yield, which looks well-supported by cash and earnings.
I added TP ICAP to SIF at 310.4p on 21 April 2026.
Shell (LON:SHEL)
A number of oil and gas companies have appeared in my screening results in recent months. Shell was among the first and highest-ranked, hence its addition to the portfolio.
The shares have retreated from the highs seen earlier this year after worst-case predictions about the potential consequences of the Middle East conflict failed to materialise.
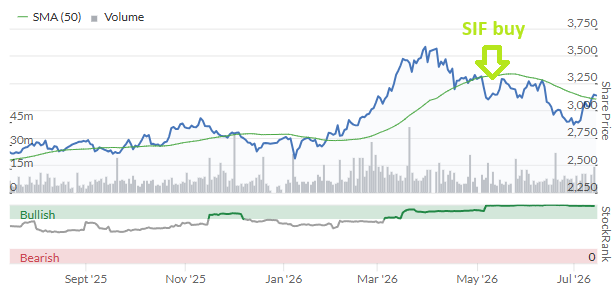
While I’m no expert, my impression of the global situation is that oil and gas prices could remain firm for some time even if the Strait of Hormuz truly reopens.
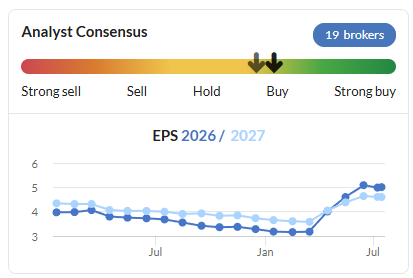
Of course, if market conditions do become more difficult again, there could be further upside to current forecasts:
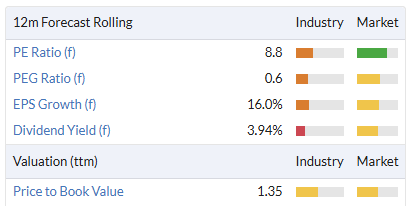
In either case, the current valuation doesn’t seem unreasonable to me, on a near-term view:
At the risk of tempting fate, I think a serious slump is unlikely within my nine-month timeframe for this holding.
The StockRank algorithms appear to concur, with Super Stock styling and a StockRank of 99:
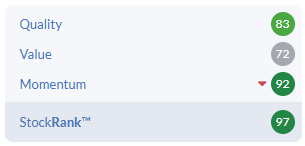
I added Shell to SIF at 3,151p on 12 May 2026.
Pebble (LON:PEBB)
I bought and then quickly sold this promotional merchandise supplier in March when it issued a profit warning. At the time I recognised that this might have been a false alarm, as there was a corresponding increase to earnings forecasts for the following year. However, my rule is to sell on a profit warning, so that’s what I did:
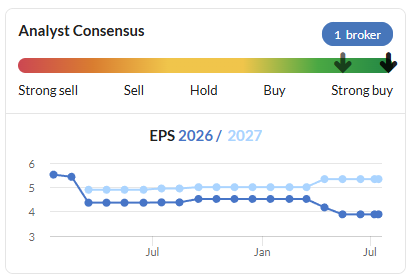
Sure enough, Pebble rapidly reappeared in my screening results. After an in-line trading update in April, I eventually conceded defeat in June and added the stock back to the portfolio.
Mark covered the company’s recent half-year update in the DSMR and concluded that there were reasons to expect revenue and earnings growth, “at least in line with broker forecasts”.
I’m reasonably sanguine about this situation and am encouraged by Pebble’s Super Stock styling and StockRank of 98, at the time of writing.
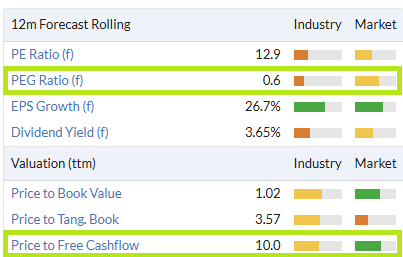
A PEG ratio of just 0.6x and a 10% trailing free cash flow yield also seem to suggest positive foundations for improved equity returns:
While I don’t know that much about this business, I’m hopeful my second attempt at this trade could be successful.
I added Pebble to SIF at 61.2p on 2 June 2026.
Harbour Energy (LON:HBR)
Adding a second oil and gas producer to the portfolio less than a month after buying Shell was perhaps a little rash. While I allow myself some flexibility on diversification, I wouldn’t always choose to have two companies from the same sector in the portfolio.
In this case, two factors tipped the balance and persuaded me to increase the portfolio’s exposure to fossil fuels:
I was keen to add holdings to the portfolio to boost income returns – Harbour’s c.7% yield looks pretty safe to me on a near-term view.
While this position probably carries greater downside risk than Shell, it could also perform better to the upside if oil and gas prices remain high/rise further.
It’s too soon to know how this decision will work out. What I do expect is that the dividend should be amply supported by free cash flow this year, with surplus cash also available for debt reduction.
The recent placing of the final tranche of shares owned by long-time private equity backer EIG may also help to relieve pressure on the share price:
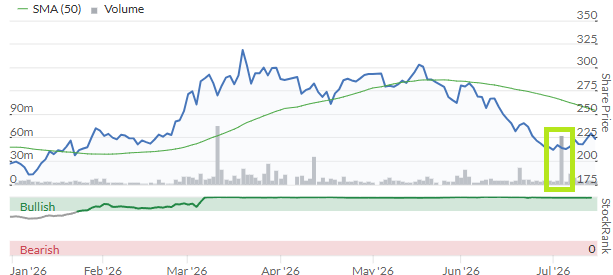
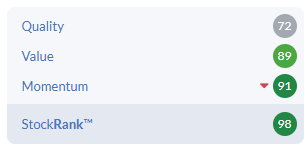
Harbour’s StockRank also remains very favourable, despite recent share price weakness:
I added Harbour Energy to SIF at 280.8p on 2 June 2026.
Standard Chartered (LON:STAN)
This FTSE 100 bank is focused on Asia, the Middle East and Africa. It can perhaps be loosely described as a smaller and slightly less China-centric alternative to HSBC.
I was interested to see that StanChart has outperformed HSBC, Lloyds and Barclays over one, two, five and 10 years:
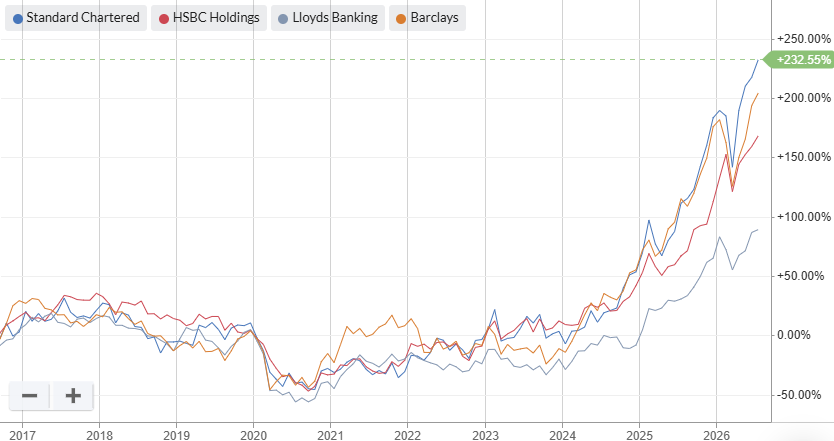
This reality is at odds with my previous perception that the bank was a laggard that’s been in turnaround mode for a long time. It just goes to show that it’s easy to form misconceptions based on secondhand data and insufficient context.
Standard Chartered’s share price performance may help to explain why CEO Bill Winters has been in the role since 2015. HSBC has had four CEOs over the same period.
In May, the bank issued new medium-term guidance targeting an 18% return on tangible equity (RoTE) by 2030, aided by a 15% reduction in back office headcount as thousands of staff are replaced by AI. (Speaking to journalists, Winters infamously described those targeted in planned job cuts as “lower-value human capital”...)
Analysts have translated the bank’s plans into a relatively upbeat outlook for earnings, with 22% growth forecast for 2027:
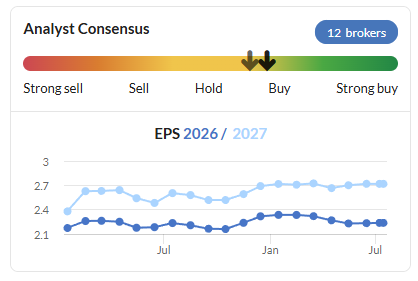
I think the key point is that a further improvement in returns on equity could justify a larger premium to book value. That could drive the shares higher – Standard Chartered currently trades at a lower multiple to book value than HSBC, despite both banks reporting similar levels of profitability in 2025.
I added Standard Chartered to SIF at 1,783p on 10 June 2026.
Castings (LON:CGS)
This foundry business generates nearly three quarters of its revenue from making parts for European heavy truck manufacturers. It’s a cyclical sector that’s seen a slump in demand over the last couple of years:
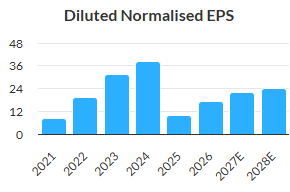
However, Castings’ latest results suggest a pick-up in order volumes for the year ahead. They also confirmed that efforts are continuing to diversify the company’s customer base to reduce future cyclicality. Targets include the renewable energy market.
Recent foundry upgrades and an opportunistic acquisition have left the business with increased production capacity and the ability to create larger castings than in the past. This has the potential to increase the group’s addressable market.
My main concern is that low returns on capital are a perennial issue here. I’m not yet convinced this can be solved: foundries are capital and energy-intensive and the UK’s high electricity costs make things even harder.
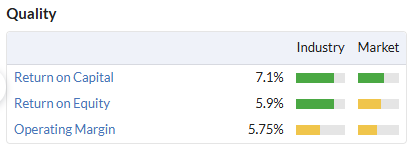
However, Castings has a strong balance sheet with a consistent net cash position and generates plenty of free cash flow. The stock featured in Ed’s StockRank Jumpers article and still offers a useful 5.6% yield, even after its recent re-rating:
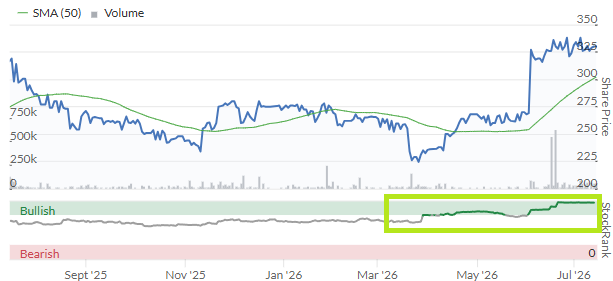
I added Castings to SIF at 336p on 30 June 2026.
Sold Stocks in Q2 2026
Here’s a summary of the stocks I sold from SIF during Q2 2026:
Name | Bought / Sold | Income Return | Total return | Reasons for sale |
Kier (LON:KIE) | 154p on 18 Feb 25 | 6.4% | 35.6% | Failed multiple momentum rules, including modest downgrades to EPS forecasts. |
Lancashire Holdings (LON:LRE) | 624p on 12 Aug 25 | 17.8% | 19.7% | Failed PEG rule and EPS downgrades. From a pure income perspective it would probably have been attractive to keep this stock. |
Sylvania Platinum (LON:SLP) | 80p on 16 Sept 25 | 5.0% | 8.2% | Failed multiple momentum rules. |
Disclosure: At the time of publication, Roland owned all the shares shown in the 30 June 2026 portfolio snapshot.
Disclaimer
This is not financial advice. Our content is intended to be used and must be used for information and education purposes only. Please read our disclaimer and terms and conditions to understand our obligations.

14 comments
Hi, new here, this looks very interesting. The screen links don't work though, is there a way I can view them?
Stockopedia has moved from app to www in the url. But the links still seem to contain app. Hopefully it will get fixed but in the meantime as a work around you could when you get an error message, overtype 'www' with 'app' and press enter and it finds the screens ok.
Thank you, sorted now!
Here's an updated link:
https://www.stockopedia.com/a/screens/buy-stock-in-focus-sif-113218
Many thanks for the information. Will tip toe back in.
Great article thank you, I have been using SIF for my SIPP and its done well over the last 3 years. I sold everything 5 months ago into cash due to a potential issue, which has not happened. Im now looking to buy again, the current SIF screen is 9 stock, 6 are oil, gold etc. Your current portfolio looks much more spread so not sure which way to go, any thoughts.
Hi MDJ043,
My strategy for SIF is to add new stocks on a rolling basis. I check for new stocks each week, but generally only buy one at a time. Sales from the portfolio also take place in a similar way, typically with a small number at the end of each month (sometimes none).
Because the screen results evolve over time with changing market conditions, the portfolio tends to be more diversified than it would be if purchased all at once.
Of course, none of the above is advice - this is just the way I run the portfolio.
Roland
Use of ASX_TR as your benchmark might be appropriate on the basis that an alternative to actively managing your own portfolio is to buy a low-cost All-Share tracker. It has several advantages over you however: its constituents are periodically adjusted cost-free, whilst your portfolio bears trading costs; in a bull market, the concentration risk of an orthodox market-capitalisation-weighted index confers a performance advantage over your equal-weight portfolio - the most successful companies in the ASX_TR are 'over-weighted' in the index - that situation might work against it, and in your portfolio's favour in a bear market?; the ASX_TR include investment trusts, some of which use leverage - again giving it a performance advantage in a bull market, and perhaps a performance disadvantage in a bear market relative to your portfolio (unless your rules allow investment trusts to be held which, if memory serves, it doesn't).
A fairer direct performance comparison might be to benchmark your portfolio against an equal-weight version of the ASXX_TR (total-return FTSE All-Share index excluding investment trusts); else you might feel that since your alternative to active self-management of a portfolio is to buy an ASX tracker, that consideration is more relevant than ensuring a direct performance comparison, despite the performance headwinds to which this subjects your portfolio during a bull market.
Hi Ed, and thanks for your comment.
I'm not sure there is a perfect benchmark. As you identify, most indices have some weaknesses and are not constructed in the same way as a typical stock portfolio.
My approach to benchmarks is to try and choose something that's broadly appropriate and is also widely used, with ready access to the relevant data. Equally-weighted indices always seem promising as a fairer benchmark, but they're not generally available.
I think the FTSE All-Share index is a fair choice in the circumstances as it's a fair approximation of my investment universe (albeit excluding AIM).
You're correct to suggest that it can be difficult to beat a market-cap weighted index when its largest constituents are performing strongly, but that this dynamic can reverse during a bear market. In my view, these factors usually even out over time; I would argue they have done with SIF.
For some context, here's a shot of the portfolio's performance against the standard All-Share index from 2016 to the the start of 2025 (i.e. excluding dividend returns). SIF is the blue line:
Cheers,
Roland
Hi Roland thats still not a bad return just under doubling your money in nine years just roughly what extra percentage do you think dividends would have added on top over that timeframe ?
Thanks The Phoenix, based on the data I have, I think dividends would have added about 2% per year.
While the SIF screen has always required a minimal yield from stocks, I didn't previously focus on higher yield, so income levels were lower historically.
Roland
Have not had time to fully study this but a couple of things immediately strike me - First that all but one of the losers are actually very highly rated by Stocko. What rank were they at the time of sale ? Second - Foresight group (LON:FSG) - its been on the up for the past 3 months wiping out the losses earlier in the year.
Hi bohenie,
When you mention losers I'm assuming you mean the stocks I sold during the period (not those I still hold that are running losses).
Of the three stocks sold in Q2, the StockRanks at the time of sale were (approximately):
Kier (LON:KIE): 81
Lancashire Holdings (LON:LRE): 70
Sylvania Platinum (LON:SLP): 67
These are all above-average StockRanks, but my system doesn't use the StockRanks for any decision making. This was a deliberate decision on my part when I setup the portfolio to ensure I didn't create a 'closet NAPS tracker'!
I have indeed been happy to see Foresight group (LON:FSG) reversing its losses recently and improving its position in the portfolio. Having bought in January, I'm now back to where I started!
Roland
Thanks Roland - FWIW I have held onto Kier (a long term hold) and just the other day bought back into SLP ( I know its risky but seems in good financial health) and topped up FSG in April. But am nursing a tidy loss on Harbour!