Stocks at 52-week highs: buy the winners?

I recently shared a screen to use to find potential bargain buys among stocks trading at 52-week lows. This week I want to flip this idea on its head and look for shares trading close to their 52-week highs that may offer buying opportunities.
Bargain hunting among big fallers may feel more comfortable for investors who like to focus on value. I know it does for me.
But there’s plenty of evidence to suggest that buying shares that are trading close to 52-week highs can be a very successful strategy.
It’s worth noting that buying such stocks doesn’t necessarily mean buying expensive shares. As you’ll see in the results of this screen, there seem to be plenty of reasonably-priced stocks with rising share prices.
The idea of buying shares close to 52-week highs is also supported by academic research. Apparently, investors tend to be reluctant to buy shares when they’re close to 52-week highs. This can lead to a situation where companies are delivering positive results and the market is undervaluing them.
At some point, the dam breaks and new buying will often support further share price gains, potentially leading to new 52-week highs.
My experience as an investor has certainly confirmed my belief that momentum is a powerful force -- often far more so than I've expected. To help me overcome my bias against chasing stocks higher, I’ve designed a new screen to try and identify good companies with rising share prices that could be attractive investments.
As always, the results of this screen are intended to be a starting point for further research, not a list of stocks to buy.
Being too restrictive runs the risk of ruling out many good opportunities, so I’ve left some criteria deliberately ‘loose’, in order to try and provide a decent range of choices.
Building the screen
As a starting point, I copied the 52-week low screen I created recently (available here) and inverted it.
This gave me the following criteria:
Price vs 52w high > -10%
Index memberships: FTSE 100, 250, SmallCap, Fledgling and AIM All Share
Market cap > £20m
StockRank > 60
This generated 128 results. That’s too many for my purposes, so I decided to add some further criteria.
Momentum: my next addition was a specific MomentumRank rule. Strong momentum is key part of what I’m looking for here, so I want to make sure that this score is high:
MomentumRank ≧ 75
Including MomentumRank in the screen also means that I don’t have to individually screen for earning upgrades or price momentum measures. All of these (and more) are already blended into the MomentumRank score.
Quality: moving on, I thought about what other specific qualities I might want to look for. Opinions vary on this, but personally I’m only interested in investing in companies that are profitable and cash generative.
Screening for positive net profit (after-tax earnings) might result in a few false negatives due to one-off factors.
As a compromise, I decided to test for companies that were profitable at an operating level and had positive operating cash flow on a trailing 12-month (TTM) basis. As it turned out, this didn’t exclude enough additional companies. Perhaps this is unsurprising, given that I’d already specified a StockRank over 60.
Instead, I changed direction slightly and decided to include a minimum requirement for profitability in my screen:
Operating margin TTM > 5%
Return on Capital Employed TTM > 5%
These rules worked nicely and stripped out a lot of companies that appeared to be only marginally profitable.
Fundamental health: to finish off, I thought it would be prudent to add a few more checks to ensure the companies are generating cash and not excessively geared.
Piotroski F-Score > 5
Free cash flow per share > 0p
Net gearing (net debt/equity) < 100%
These additional rules reduced the screen results to 55 stocks. That’s a comfortable number for me to process and narrow down further, while still offering plenty of choice.
The finished 52-week high screen is available here to use and copy. Here’s how it looks:

Value: you’ll notice that I haven’t included any explicit valuation metrics. There are three reasons for this:
I’ve specified a StockRank of 60 – ValueRank is part of this score and will have some impact.
I wanted the screen results to be objective, rather than a reflection of my views on valuation
A wide range of valuations can be appropriate, depending on the investment case. For example, companies whose profits are returning to normal after a period of disruption may look more expensive than they really are. Cyclical stocks whose profits have peaked often look cheaper than they actually are.
52-week high: screen results
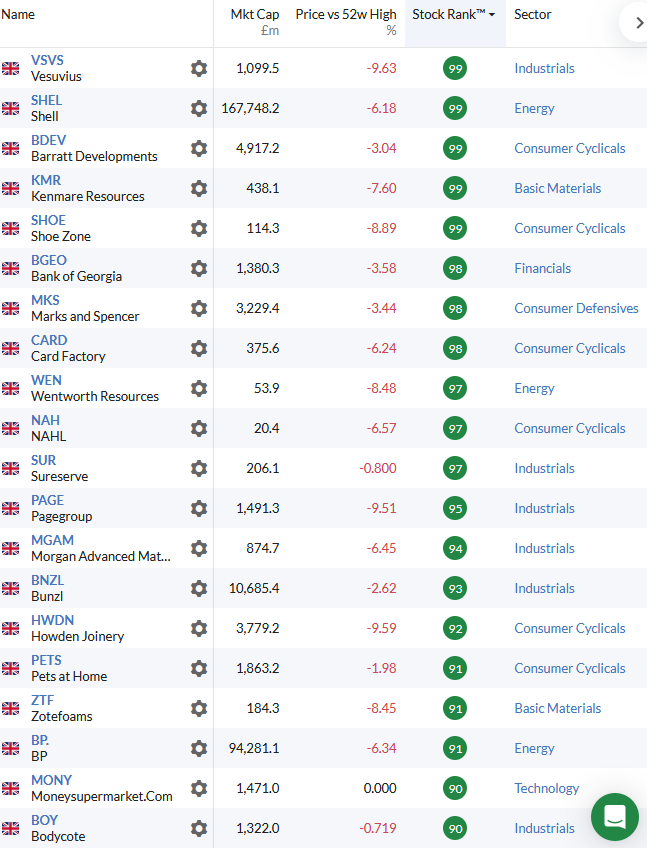
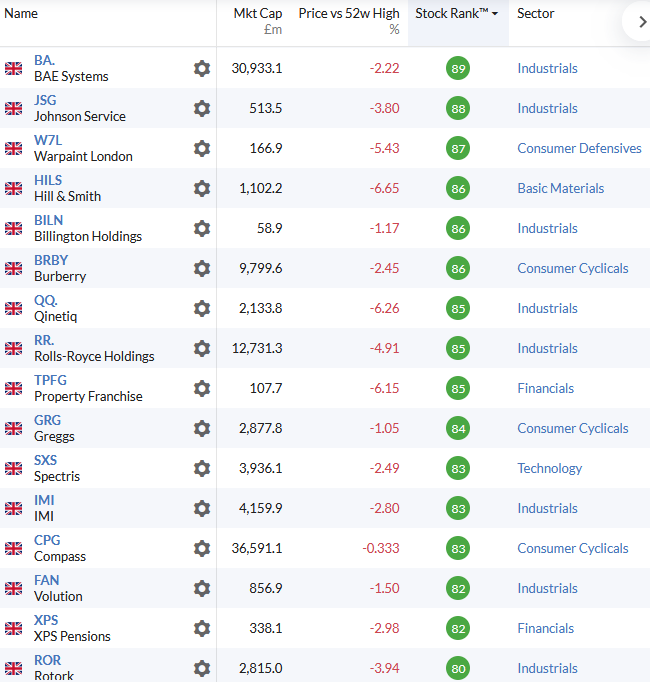
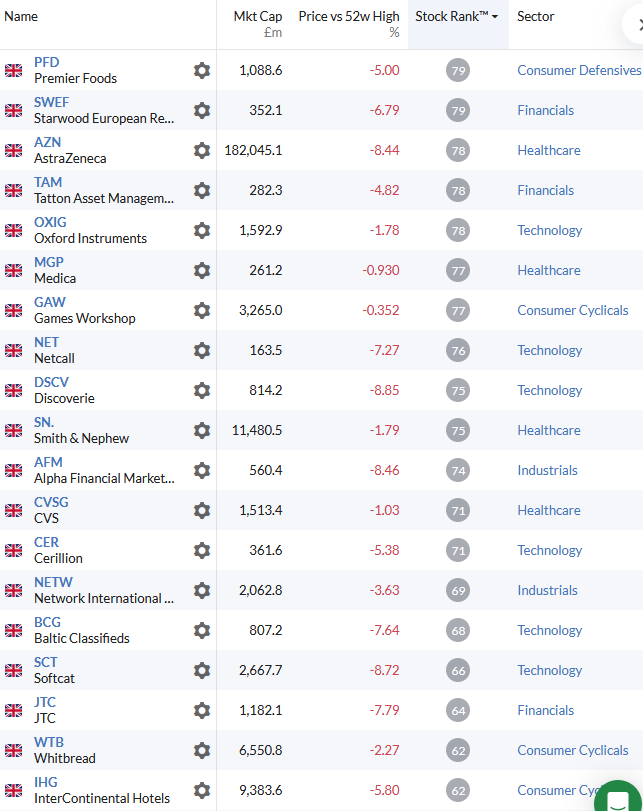
Here are the results of the screen. I’ve sorted them by StockRank and broken them into sections to make it easier to read:
StockRank 90-100
StockRank 80-89
StockRank 60-79
Next steps
I think there are some very promising names in this list. I can also see several stocks I’ve written about in recent months, including Marks and Spencer, Bodycote, QinetiQ (I hold), Shell and BAE Systems and Cerillion.
There are also a number of stocks that were chosen for Ed’s 2023 NAPs portfolio.
To narrow the selection down further, I might simply start working down the list, examining the StockReports for each company and reading recent trading updates and results.
An alternative approach would be to tighten up the screen. To do this, I’d start by thinking about how these stocks fit with my investment framework and circle of competence.
For example, I might choose to exclude stocks in specific sectors, or require a minimum dividend yield.
I could choose to restrict the market cap or index membership to target (say) mid-caps or small caps.
I might also think about tilting the screen towards either value or quality. Stockopedia provides VM and QM ranks, which you can read about here. But I could also adjust my screen manually. For example:
VM: introduce additional valuation criteria, such as earnings yield or forecast P/E
QM: tighten profitability criteria, e.g. raise operating margin and ROCE to a minimum of perhaps 12%-15%. I’d also look more closely at cash conversion.
To follow up this screen I plan to take a more in-depth look at one or more stocks from these results over the next few weeks. I have a few ideas, but all suggestions are welcome in the comments!
Disclaimer
This is not financial advice. Our content is intended to be used and must be used for information and education purposes only. Please read our disclaimer and terms and conditions to understand our obligations.

3 comments
Thank you for another great post which gives a new angle on the screening functionality available on Stocko.
You asked for our suggestions on how to develop the list further from here. Personally I would be interested in pushing the tilt to quality rather than value which is perhaps already covered in SIF and bargain buys.
Also I wonder if it's possible to screen on a longer horizon than 52 week e.g. 3 year high or even all time high - I appreciate that would be more of a strategic tweak rather than a tactical one, but it might tilt the screen further away from recoveries and cyclicals and towards growth. Maybe one of the guru screens already does this idea.
What I am about to say is just my personal experience and won’t necessarily apply to other investors. The important thing in investing is to develop a method that suits one’s own skills and personality. Although that sounds simple enough, I found it to be a difficult and time consuming process littered with costly mistakes. I think a confusion arose in me between what ‘felt right’ (but was actually just a manifestation of common market losing cognitive biases) and what was actually successful.
I plugged a leak in my method when I realised my decisions were too tilted to value rather than momentum. I then went a step further and got rid of the ‘reasonably priced’ part of my process as well. GARP is a proven market beating strategy but one potential problem is the ‘RP’ requirement might screen out some of the huge market winners. As Thomas Phelps said ‘Good stocks are seldom friendless’.
thank you for sharing your analysis, it is a very helpful for someone like me who thrashes around looking for ideas
Thanks for this article. It has given me plenty of food for thought