After an eventful two years, has my quality screen beaten the market?

Two years ago I created a screen to look for potential quality compounders – those rare high-quality companies that can generate consistently high returns for many years, reinvesting their profits successfully and potentially delivering long runs of market-beating growth.
The intervening period has seen periods of elevated volatility and some unexpected events. In this piece I want to look at the performance of my original selection and consider how this might be improved.
A quality compounding approach to investing requires fairly long timeframes. Two years isn’t really enough to see the benefits of true compounding. But I think it is enough to check which stocks from my original list are still performing and to look for some new contenders to consider.
Compounding Quality screen revisited
Before we go any further, here are the links to my original article and to the compounding quality screen itself.
As a quick refresher, here’s a snapshot of the screening rules I used to try and identify companies with the potential to be quality compounders:

When I originally looked at this screen in May 2023, it generated 35 stocks.
At the time of writing (16 July 2025), there are only 20 stocks in the results.
Of these, 12 remain from the original May ‘23 selection and eight are new.
How did the 2023 vintage perform?
I’ll return to the latest screen results shortly, but first I want to take a look at how my original selection has performed over the last two years or so.
To model the aggregate performance of the whole selection, I created a model portfolio with equally-sized starting positions.
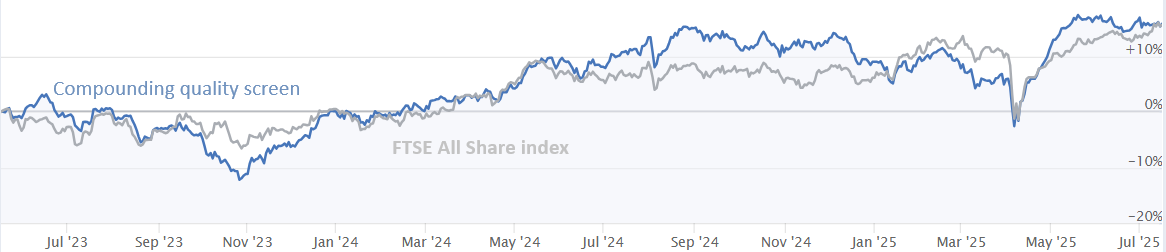
The results are pretty underwhelming. My selection has largely just tracked the FTSE All Share index since May 23, with both achieving a capital gain of around 16%:
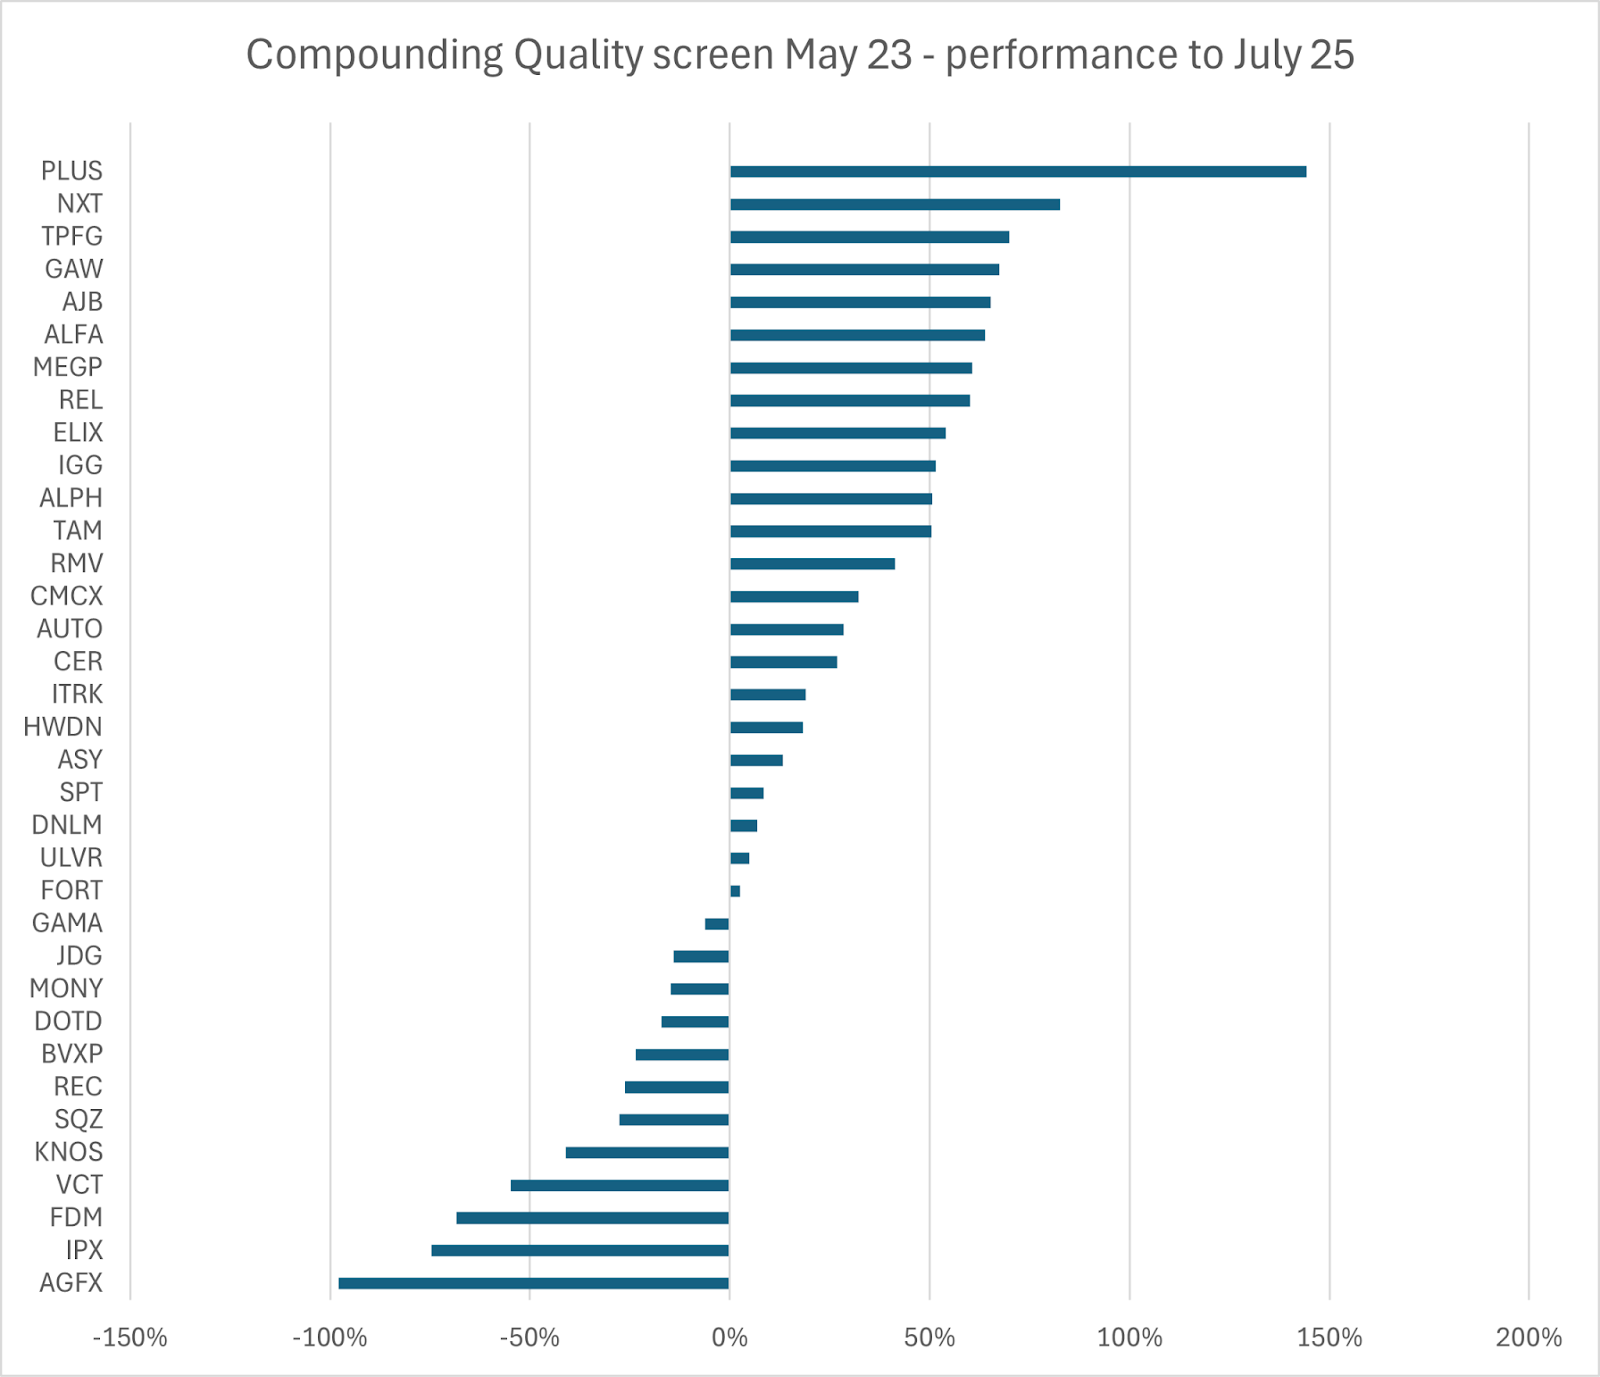
The reason for this humdrum performance becomes clear when we look at the range of share price performance from the 35 stocks in the portfolio. While there were some big winners, there were some notable losers as well, including a near-total loss with Argentex:
One selection of stocks over a two-year period isn’t a scientifically rigorous test of an investment method. But this clearly isn’t a very satisfactory result.
What steps might I have taken to improve the performance of this selection?
A key element of investing is avoiding big losses. If we can manage this, then it becomes much easier to achieve a market-beating portfolio performance. It seems clear that what was needed here was a more active approach. This could potentially have taken two basic forms.
Select a subset of stocks
Using the original screen as a starting point, I could have carried out extra research to narrow down my selection to a smaller number of companies with stronger prospects.
This seems to be consistent with a compounding quality approach, which is traditionally a long-term and discretionary strategy. The problem is that this kind of qualitative research is very difficult and often relies on guesswork about the future.
The StockRanks might not have been much help either. Back in May ‘23, there was no clear difference between the future winners and losers:
May ‘23 | Average StockRank | Average QualityRank |
All screen results | 75 | 93 |
Losers falling > 25% | 71 | 94 |
They all started out with promise, but problems emerged at different times. When that happened, a reactive decision was needed – continue holding for hoped-for long-term returns, or sell and cap losses?
This chimes with Ed’s findings in his multibagger article last week, which highlighted the need to pay close attention to what’s happening with long-term holdings and to be prepared to move on.
There’s some overlap between my selections and the stocks in Ed's article. While my screen didn’t require stocks to be multibaggers, I was certainly hoping to find stocks with similar characteristics that could perhaps become glorious future multibaggers.
Use a rules-based approach
Philosophically, I think a rules-based approach to selling is at odds with the idea of compounding quality. But in this case at least, it could have worked.
One simple solution would have been to use a stop-loss rule to prompt me to sell stocks when they fell more than 25% below their purchase price.
If I had followed this approach with the original selection, the portfolio would have generated a capital gain of 22% over the last two years – a useful 6% above the wider market.
To redeploy the resulting cash, I might also have recycled the cash from sold positions into newer picks from the screen, while continuing to hold the best-performing stocks.
Of course, this approach still isn’t ideal. There’s also the question of what I should do with winners. For example, a stop-loss rule of this kind would allow a stock to double and then fall back to its purchase price without prompting me to take action.
A trailing stop-loss is one possibility, but I find these complicated, prone to misfiring and not reliably available on all platforms.
My preferred approach would probably be to echo the approach I use in the SIF portfolio and continue holding shares if they still qualify for my screen after a minimum holding period – I’d suggest 12 months in this case.
Compounding Quality results: July 25
To wrap up this piece, I want to take a look at the screen results today. Which stocks remain from the original selection – and what are the new compounding quality contenders?
At the time of writing, 20 stocks qualify for this screen (down from 35 in May 23). Here’s the full list from 16 July 2025:

I’ve broken this down into two subsets – original May ‘23 stocks and new entrants.
First of all, here’s how the May ’23 stocks have performed until now:
Company | Share price chg (%) May’23 - Jul ‘25 | StockRank (21/07/25) | Recent DSMR commentary |
Plus500 (LON:PLUS) | +144% | 95 | 7 July 25 (GREEN) |
Next (LON:NXT) | +83% | 70 | 8 May 25 (AMBER/GREEN) |
Games Workshop (LON:GAW) | +67% | 76 | 23 May 25 (GREEN) |
AJ Bell (LON:AJB) | +65% | 73 | 23 May 25 (GREEN) |
Alfa Financial Software Holdings (LON:ALFA) | +64% | 60 | |
Elixirr International (LON:ELIX) | +54% | 75 | 14 Jul 25 (AMBER/GREEN) |
IG group (LON:IGG) | +52% | 91 | 27 Jun 25 (GREEN) |
Alpha International (LON:ALPH) | +51% | 61 | 6 May 25 (Takeover offer) |
Tatton Asset Management (LON:TAM) | +50% | 72 | |
Rightmove (LON:RMV) | +41% | 66 | 9 May 25 (AMBER/GREEN) |
Auto Trader (LON:AUTO) | +28% | 59 | 30 May 25 (AMBER/GREEN) |
Gamma Communications (LON:GAMA) | -6% | 55 | 14 May 25 (AMBER) |
Average gain: | +58% |
With only one loser and an average gain of 58% in just over two years; the performance of these stocks has been comfortably above average. This seems to support the idea that it makes sense to cull underperformers and to periodically review whether shares still qualify for the screen.
Looking ahead, are any of the stocks that are new to the screen likely to achieve similar results? It’s impossible to be sure. But I think there are some stocks that might be worth a closer look in the list below, which I’ve ranked by StockRank:
Company | StockRank (21/07/25) | Recent DSMR commentary |
Integrated Diagnostics Holdings (LON:IDHC) | 89 | 20 Jun 25 (AMBER/RED) |
Central Asia Metals (LON:CAML) | 80 | 21 Jul 25 (AMBER/GREEN) |
Wise (LON:WISE) | 81 | 17 Jul 25 (AMBER) |
Foresight group (LON:FSG) | 75 | |
Spectra Systems (LON:SPSY) | 69 | 31 Mar 25 (AMBER/GREEN) |
Experian (LON:EXPN) | 65 | 14 Nov 24 (GREEN) |
Frp Advisory (LON:FRP) | 60 | 8 May 25 (AMBER/GREEN) |
Sage (LON:SGE) | 48 | 15 May 25 (GREEN) |
Average | 71 | 88 |
In a follow-up article I’m planning to take a look at a selection of these stocks and consider whether they have the attributes required to become potential quality compounders.
Alongside this, I’m going to update the model portfolio I've created for this piece with a view to revisiting it in another 12 months.
Disclosure: at the time of publication, Roland owned shares in IG Group Holdings and Sage.
Disclaimer
This is not financial advice. Our content is intended to be used and must be used for information and education purposes only. Please read our disclaimer and terms and conditions to understand our obligations.

11 comments
Enjoyed this post Roland, looking forward to any follow up analysis. I think it’s imperative to have a rule, or series of rules, to get you out of underperforming or even languishing stocks. Just about any test proves this when you’re selecting quality stocks and Stocko’s rankings make our lives much easier in this regard. Thanks
IG has a high DY so performance on a total return basis with dividends reinvested is likely much better
I guess you're bench-marking against the FTSE all-share since all your stocks are selected from that universe, and hence you can judge whether your selection criteria is adding value.
However, personally I would want to benchmark against my alternative to active stock selection, and realistically that would be an MSCI world tracker or an S&P500 tracker (an MSCI world tracker is basically what my previous workplace pension offered as the equity option). Since any world tracker is dominated by the S&P500 and stocko doesn't have an all-world I'll use the S&P500 - that's up about 50% since May '23. So over that time frame all your work has underperformed the most likely alternative (even accounting for currency movements).
That's possibly unfair since the S&P is arguably in bubble territory, and I certainly wouldn't be buying it now even if I was a passive investor, but over the longer term, despite selecting predominately UK stocks, I now benchmark against the S&P500 since the FTSE100-dominated FTSE all-share is simply too weak compared to a global alternative.
Hi ISAallowance,
You're correct, the benchmark I've used is the FTSE All Share index.
As you say, I prefer to use the benchmark index to which my selections belong so that I can see if I'm adding value.
However, I can certainly see why an investor who is not tied to my UK remit would benchmark against a world/US index. For all practical purposes (accumulating retirement wealth) an S&P tracker has been the standard to beat for a number of years.
Whether this will remain true is of course uncertain, although I am not sure I'd bet against it.
Roland
to me it makes zero sense benchmarking against a completely different set of data (you can do that as an aside if you want it ) - what they are rightly deciding here is - that for those that select stocks from this pond of shares - how well do this subset of shares do compared to the whole pool its taken from.
If one wants to invest in a different pool of stocks to me thats a completely different comparison to the one we need and want.
in that regard it seems that most of the time when these mechanical tests are run - they mostly outperform the pool they are taken from (preumably mostly by avoiding the dross !! ) - and thats all one can do really.
That's possibly unfair since the S&P is arguably in bubble territory,
if one wants to compare with us shares to me well thats a different issue and thats to do with portfolio diversification.
I think for this exercise it makes sense to measure against the UK index as the thrust of this initiative is "Does the aproach work?" however I could argue that ...
I could invest in North Korean stocks and track their performance against the North Korean stock exchange index and be pleased that I was beating 'the market'.
Investing internationally brings other factors to consider such as extra fees for software screener for alternative markets, FX fees, possible additional charges and potential witholding tax on dividends.
On the plus side you will have potentially diversified your risk, find better opportunities in more diverse markets and avoid regional slumps (for ages no UK stocks were even showing on my screens).
Roland,
Have you looked to see whether the DSMR/SCVR colour rating at the time of purchase would have distinguished at all between the winners and the losers?
Interesting article, Roland. Many thanks.
I too have been contemplating quality compounders.
I actually cribbed the essence of a screen that I saw on Youtube. It's pretty straightforward. I require Q> 70, 2% < Yield TTM < 6%, Mkt cap > £300m, Interest Cover > 7. I sort by descending quality.
I also look for revenues and EPS doubling over a 10y period.
A lot of high-quality candidates come up. I like the screen because it combines value, growth, safety and quality.
Like you say, there can be much noise over 2 years, and maybe you need longer. Five years, I think. I've had a share like IG group (LON:IGG) for example that traded sideways for a couple of years, then had a nice pop.
Of course, random events happen to companies that no-one can predict, so it's a game of numbers.
If I were to look at compounding ability, for example, let's take the case of VCT. Well, it's revenues have been relatively static over those 10 years. EPS has actually gone down. So I would have excluded it.
Your screening process seems pretty sensible though. I guess not everything can work all the time.I look future to subsequent updates, so please don't abandon the project.
By way of illustration, I looked through my notes. I bought IGG in Feb 2018 at 766p when the ASX (All-Share) was trading at 3959. As of today, IGG is up 38.8%, and the ASX up 23.8%. Not astounding, but a useful outperformance (spread over a number of years, mind).
But, IGG was trading at 766p as late as May 2024, so the whole thing traded sideways on me for a number of years.
There's more. It fell to 512p around April 201, so you would have been stopped out if you have implemented a 25% stop-loss. If you had topped-up at 575p (at your notional stop-loss) instead of selling, you would have done even better than just buying.
Difficult, isn't it?
What my current thinking is is to deploy dividends appropriately. Something like at ISA top-up season buy one new share that matches the screen, and top up on shares that still meet the screen requirements. That way, volatility is working for you rather than against you. At least in theory (although whether that theory will play out is another matter, of course).
Great to keep. Is it possible to download the screening criteria and set up a portfolio to monitor and review?
I don't know any way of downloading the criteria, but you set it up readily enough in the Screens section. You can set up a folio and track it by creating one in the Folios section.