How to read a company's annual and interim results

A company you own has put out its results at 7am: pages of tables, a banner line that says "record" or "in line", and a share price already moving. When we looked at UK results since the start of 2025, shares moved about as much on results day as on the day of a trading update. Yet the headline said little about which way. About a third of the results that put the company ahead of expectations closed lower on the day, as the headline number has often been announced weeks before. The news sits further down: the adjustments to profit, the cashflow, the dividend and the outlook. This page takes you through each of these in turn. Each section explains what to look for, then reads a real set of results with you, the way our analysts read it in the daily report.
There are plenty of results to read. We counted at least 3,714 sets of full-year and interim results at 1,360 companies between January 2025 and mid-October 2026. Every weekday morning our analysts pick out the ones that matter in the Daily Stock Market Report and read them as they land. The page is part of our guide to reading company announcements, which takes each kind of announcement in turn, from trading statements and profit warnings to directors' dealings and takeover bids.
Results are the one time you see all the numbers
Twice a year a UK company publishes its full accounts, across three financial statements.
The income statement shows what it earned over the period.
The balance sheet shows what it owns and owes on the last day.
The cash flow statement shows the money that actually came in and went out.
Each gets a section below.
The results announcement is where the numbers are first made public, and it moves the share price. It goes out on the regulatory news service, usually at 7am, headed "Final Results", "Preliminary Results" or "Full Year Results"; a few companies use a slogan instead. The news announcement is often a summary of the year's accounts rather than the accounts themselves: the highlights, the chief executive's review and outlook, the finance director's review, the main financial statements and a selection of the notes.
The company releases them as news because, once the board has signed off the numbers, they are usually price-sensitive and must be announced promptly. On the Main Market the announcement must be agreed with the auditors first, and a paragraph near the end says whether the audit is finished and whether the auditor's report is clean. This is the document the rest of this page reads.
The annual report is the full, audited version, and it generally comes weeks later. It appears as a link on the RNS news service as an "Annual Financial Report" or "Annual Report and Accounts". It’s often a glossy, branded PDF and holds everything the announcement summarised: every note to the accounts, the auditor's report, the risks the directors see and what the directors are paid. A Main Market company must publish it within four months of its year end, an AIM company within six. It rarely moves the shares, because the numbers are already out, but it is where you check the detail behind them.
The half-year, or interim, results covers the first six months, and it’s not followed by a separate glossy report. It comes headed "Interim Results", "Half-year Results" or "Half-year Report", within three months of the half on both markets. It differs from the full-year results in three ways. Its statements are shorter, and they don't have to be audited, or even reviewed by the auditors, and often aren't; the report says which. Its figures cover half a year, so compare them with the same half a year earlier. And its outlook is about the rest of the current year, which makes it worth doing a calculation: take the full-year forecast, take away the first half, and compare what's left with last year's second half. The more the second half has to do, the more the year rests on promises. Roland Head, who writes our daily report, has found that when the second half carries an unusual share of the year's profit, "we often find there's an increased chance of a profit warning later in the year". In our data, analysts called an interim a profit warning about twice as often as a full-year result.
For a company whose year ends on 31 December, the year runs like this:
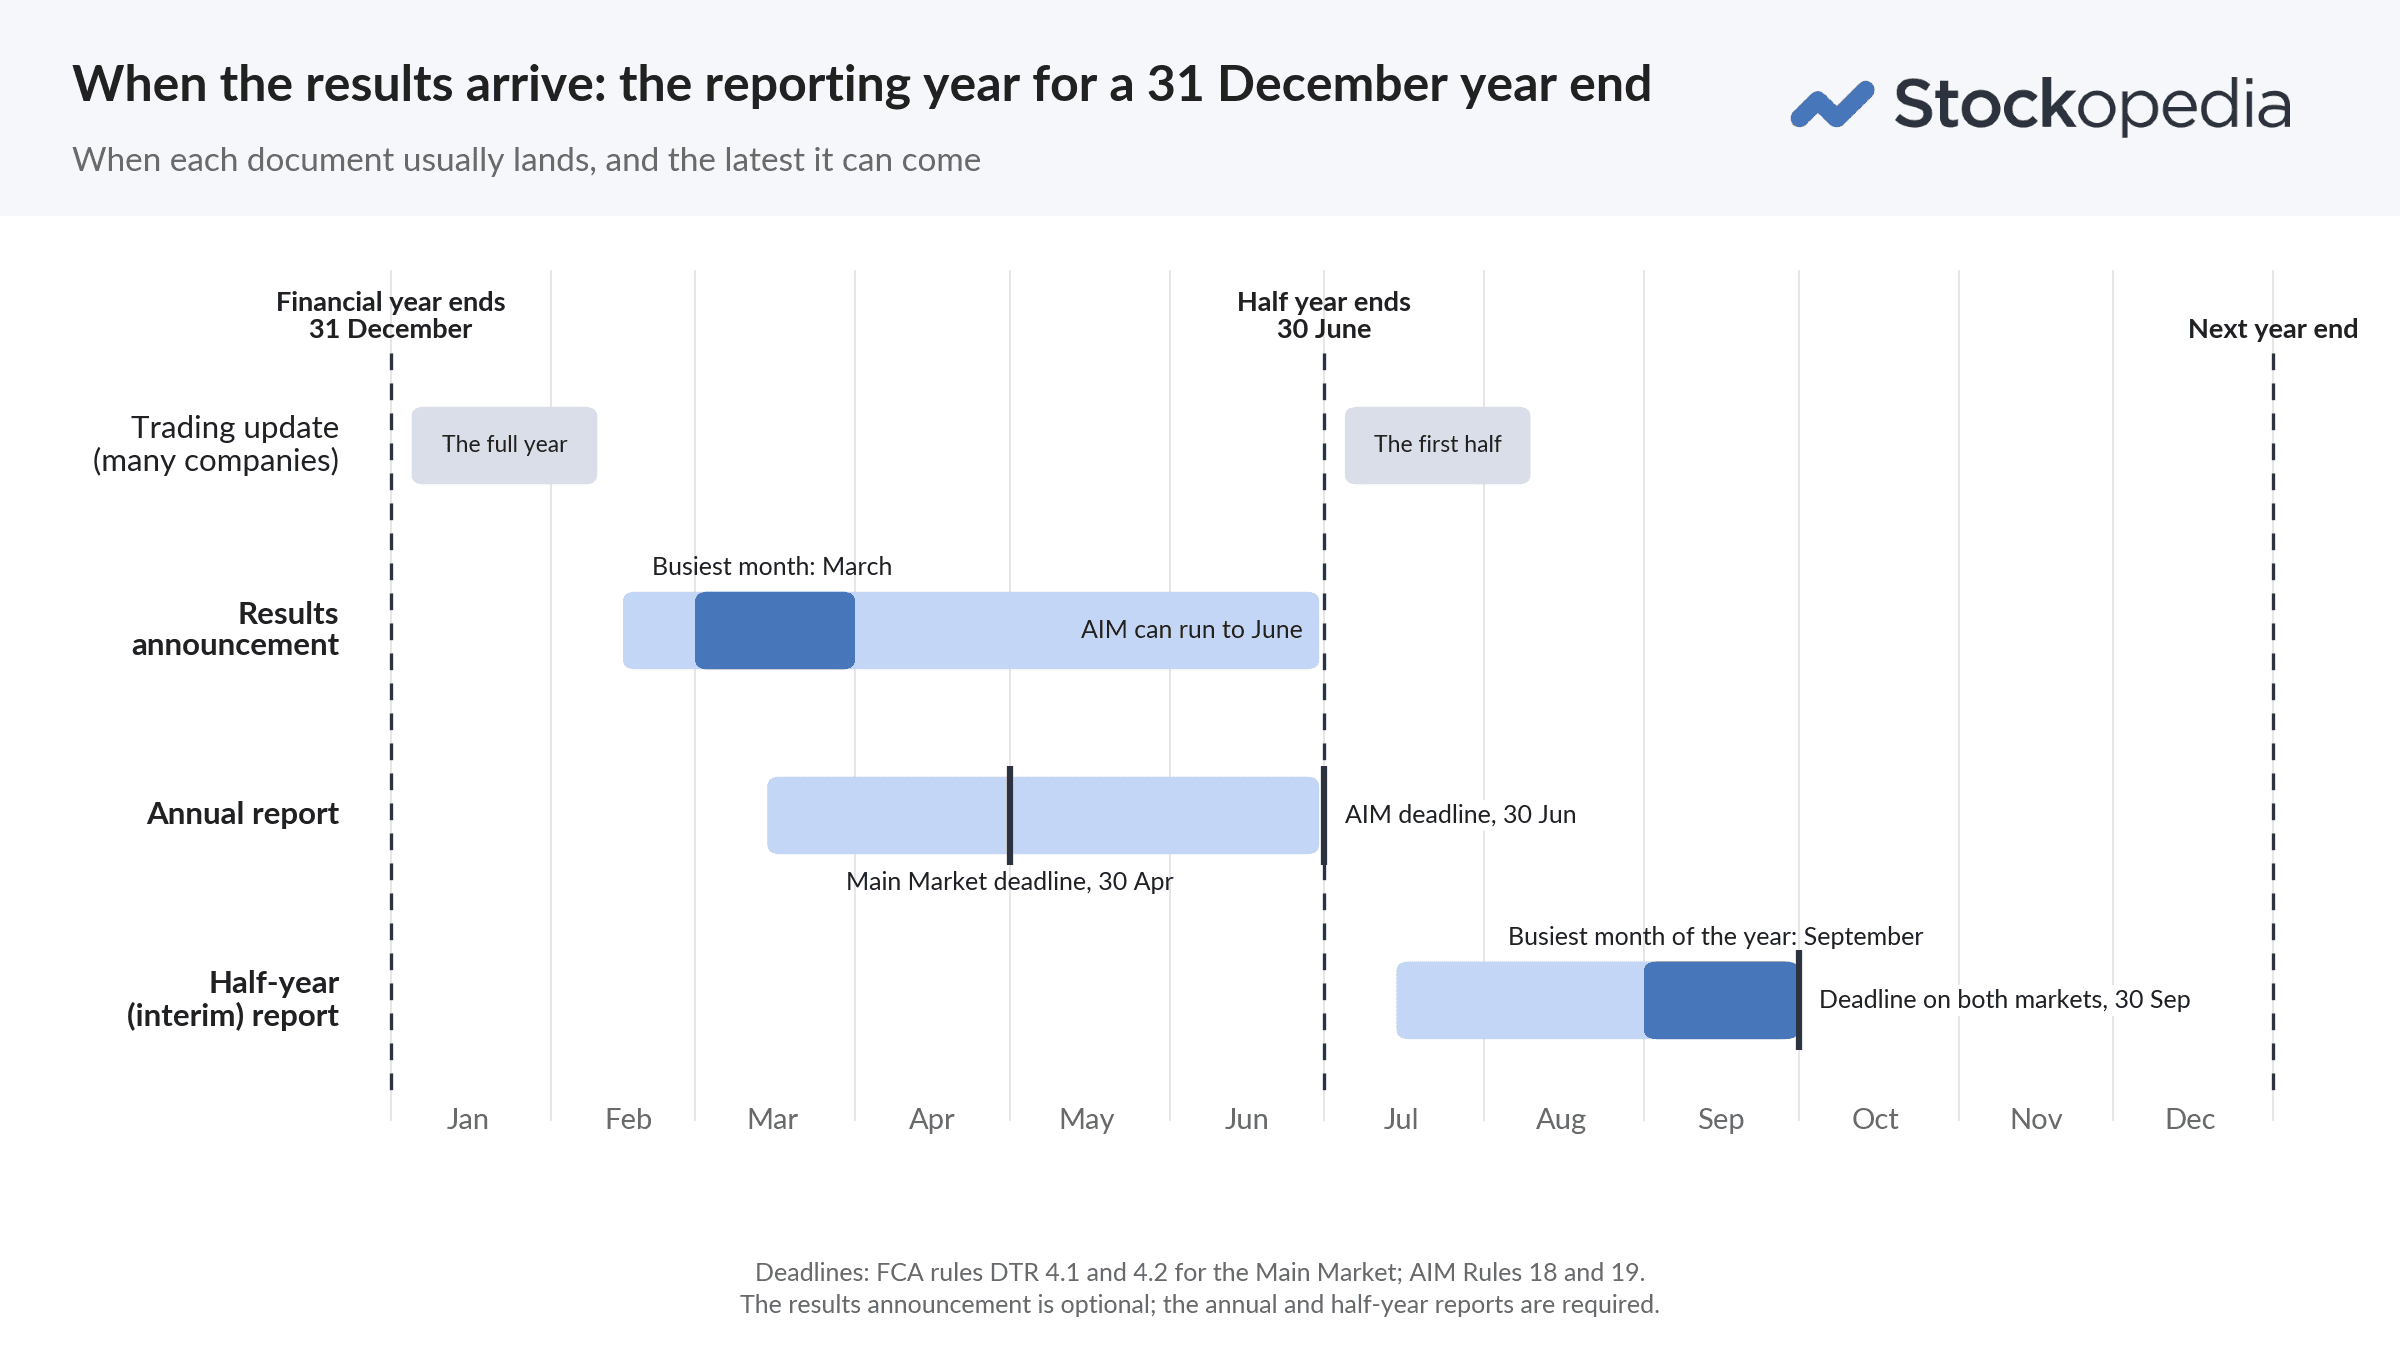
A different year end moves the whole calendar along. September is the busiest results month of all, as companies with June half-years report. Our guide to the UK reporting seasons maps the year.
The rules sit in the FCA's Disclosure Guidance and Transparency Rules for the Main Market and the AIM Rules for Companies for AIM. Results are generally treated as inside information, so the same duty to announce promptly that governs trading statements applies to them.
Many companies also put out a trading update shortly before their results, and it usually gives away the headline: the year's sales, and whether profit is in line with expectations. Our guide to trading statements explains those updates. By results day, the headline is often old news.
What's new on results day can sit further down the document
Most results announcements follow the same order. At the top come the banner, a highlights table, a few bullet points that often end on a line about the outlook, and a short quote from the chief executive. Then come the reviews.
Some companies start with a Chairman’s statement, which often communicates the dividend. The Chief Executive's review usually ends in the full outlook; larger groups add a review of each division; and the Finance Director's review bridges the adjusted profit (the company’s own calculation of its profit) to the statutory one (based on accounting standards that many FDs don’t like) and covers cash and debt. After the reviews come the financial statements, then pages of notes and, sometimes right at the end, a glossary of the company's own measures.
So start with what's materially new: the statutory profit, the cash, the dividend and the outlook. The highlights give a figure for most of them, often with the statutory profit in a smaller place than the company's adjusted one. The explanation behind each often takes some digging.
The move comes from the detail, and there is no need to rush. A study of US results from 1995 to 2004 found that on the busiest days, when many companies reported at once, the first reaction was weaker and more of the move came in the weeks that followed.
The income statement shows which profit to believe
The income statement, sometimes headed "statement of profit or loss", starts with everything the company sold over the period (revenue) and takes off its costs in stages. Each stage leaves a different measure of profit, and each is worth knowing by name. Figures shown in brackets are negative: a cost being taken off, or a loss.
Revenue, or sales: what the company charged its customers over the period.
Cost of sales: the direct cost of what it sold, such as materials, goods bought in to sell on, or the staff who deliver a service. Revenue less cost of sales is gross profit - which some investors consider the “real revenue” as it’s after many costs the company has little control over.
Operating expenses, or overheads: the cost of running the business, whatever it sells, such as offices, marketing, research, administrative staff and the wear on its equipment. Gross profit less these is operating profit, what the business itself earned before the cost of its borrowing.
Net finance costs: mostly the interest on its debts and leases, less any interest on cash it earned. Operating profit less these is profit before tax.
Income tax comes off next, leaving profit after tax, the profit that belongs to shareholders.
Earnings per share is that profit divided by the number of shares. "Basic" uses the shares in issue; "Diluted" adds the shares that staff options and similar awards could turn into.
Some companies list their costs by type instead, such as staff and depreciation, and show no gross profit, but the stages below are the same. Most of what can go wrong in a set of results shows somewhere on the way down, so read it as a set of questions.
Was the growth earned or bought? Organic growth leaves out any business acquired during the year, and usually the effect of fx changes. Retailers report “like-for-like” sales, from shops open a full year. A company that buys its growth through acquisitions isn't doing anything wrong, but make sure they are accretive to earnings per share (what you receive as a shareholder) and not diworseification.
Did the growth make money? Compare the margins with last year's. The gross margin is gross profit as a share of revenue: what's left of each pound of sales after the direct costs. The operating margin is operating profit as a share of revenue, what's left after the overheads as well. The statement itself often doesn't print either. Many companies give them in the highlights or the finance director's review; if not, divide the profit line by revenue. Sales growing while the margin shrinks means the growth is costing more to win.
Where did the growth come from? The segment note splits revenue, and usually profit, by division or by region. A strong total can hide a weak part.
Has last year's figure been restated? Every growth rate compares this year's figure with last year's, which the statement prints in the column beside it. Usually that is the number the company reported a year ago. Sometimes the company has changed it since, after a new accounting rule or a reorganisation of its divisions, and the column is marked "restated". The growth is then measured from the new number, so it may not match what you would work out from last year's results.
Then decide which profit to believe. Most companies report two. Statutory profit is after every cost, under the prevailing accounting rules. Adjusted, or "underlying", profit leaves out items the directors choose: the amortisation of businesses bought, restructuring, staff share awards and the like. The rules say the two must be reconciled, and the adjusted figure mustn't be given more prominence, but it often leads the highlights - and it’s often come under a lot of scrutiny as the directors have sometimes used their discretion to improve their headline profitability.
The test any reader can make is to set this year's adjustments beside last year's. A cost that is left out every year is a cost of the business. UK research, mostly from the 1990s and 2000s, found most adjustments fair and a minority strategic. It suggests looking hardest when the company made a statutory loss, when adjusted profit only just met forecasts, and when directors' pay depends on the adjusted figure. Warren Buffett's version: "a management that regularly attempts to wave away very real costs by highlighting "adjusted per-share earnings" makes us nervous" (The Essays of Warren Buffett, section VII.D).
Last, check the share count and what sits below operating profit. Buybacks lift earnings per share without the business changing, share awards to staff dilute it, and a lower interest bill or a one-off tax credit can flatter it for a year.
Our StockReport and StockRanks help you see past a single set of figures. Beside the company's reported earnings, the StockReport shows a normalised figure that strips out a fixed list of unusual items. The QualityRank looks further back than one set of results: it scores each share against the rest of the market on how good, how improving and how safe the business is, using measures such as its returns on capital over several years, the stability of its operating margin, and flags for financial distress and for profits that may have been manipulated.
Worked example: GB Group's half-year results, November 2025
GB Group, which sells identity-checking software, published its half-year results on 25 November 2025. The shares rose nearly 10% that day. Graham Neary, who writes our daily report, took the income statement apart.
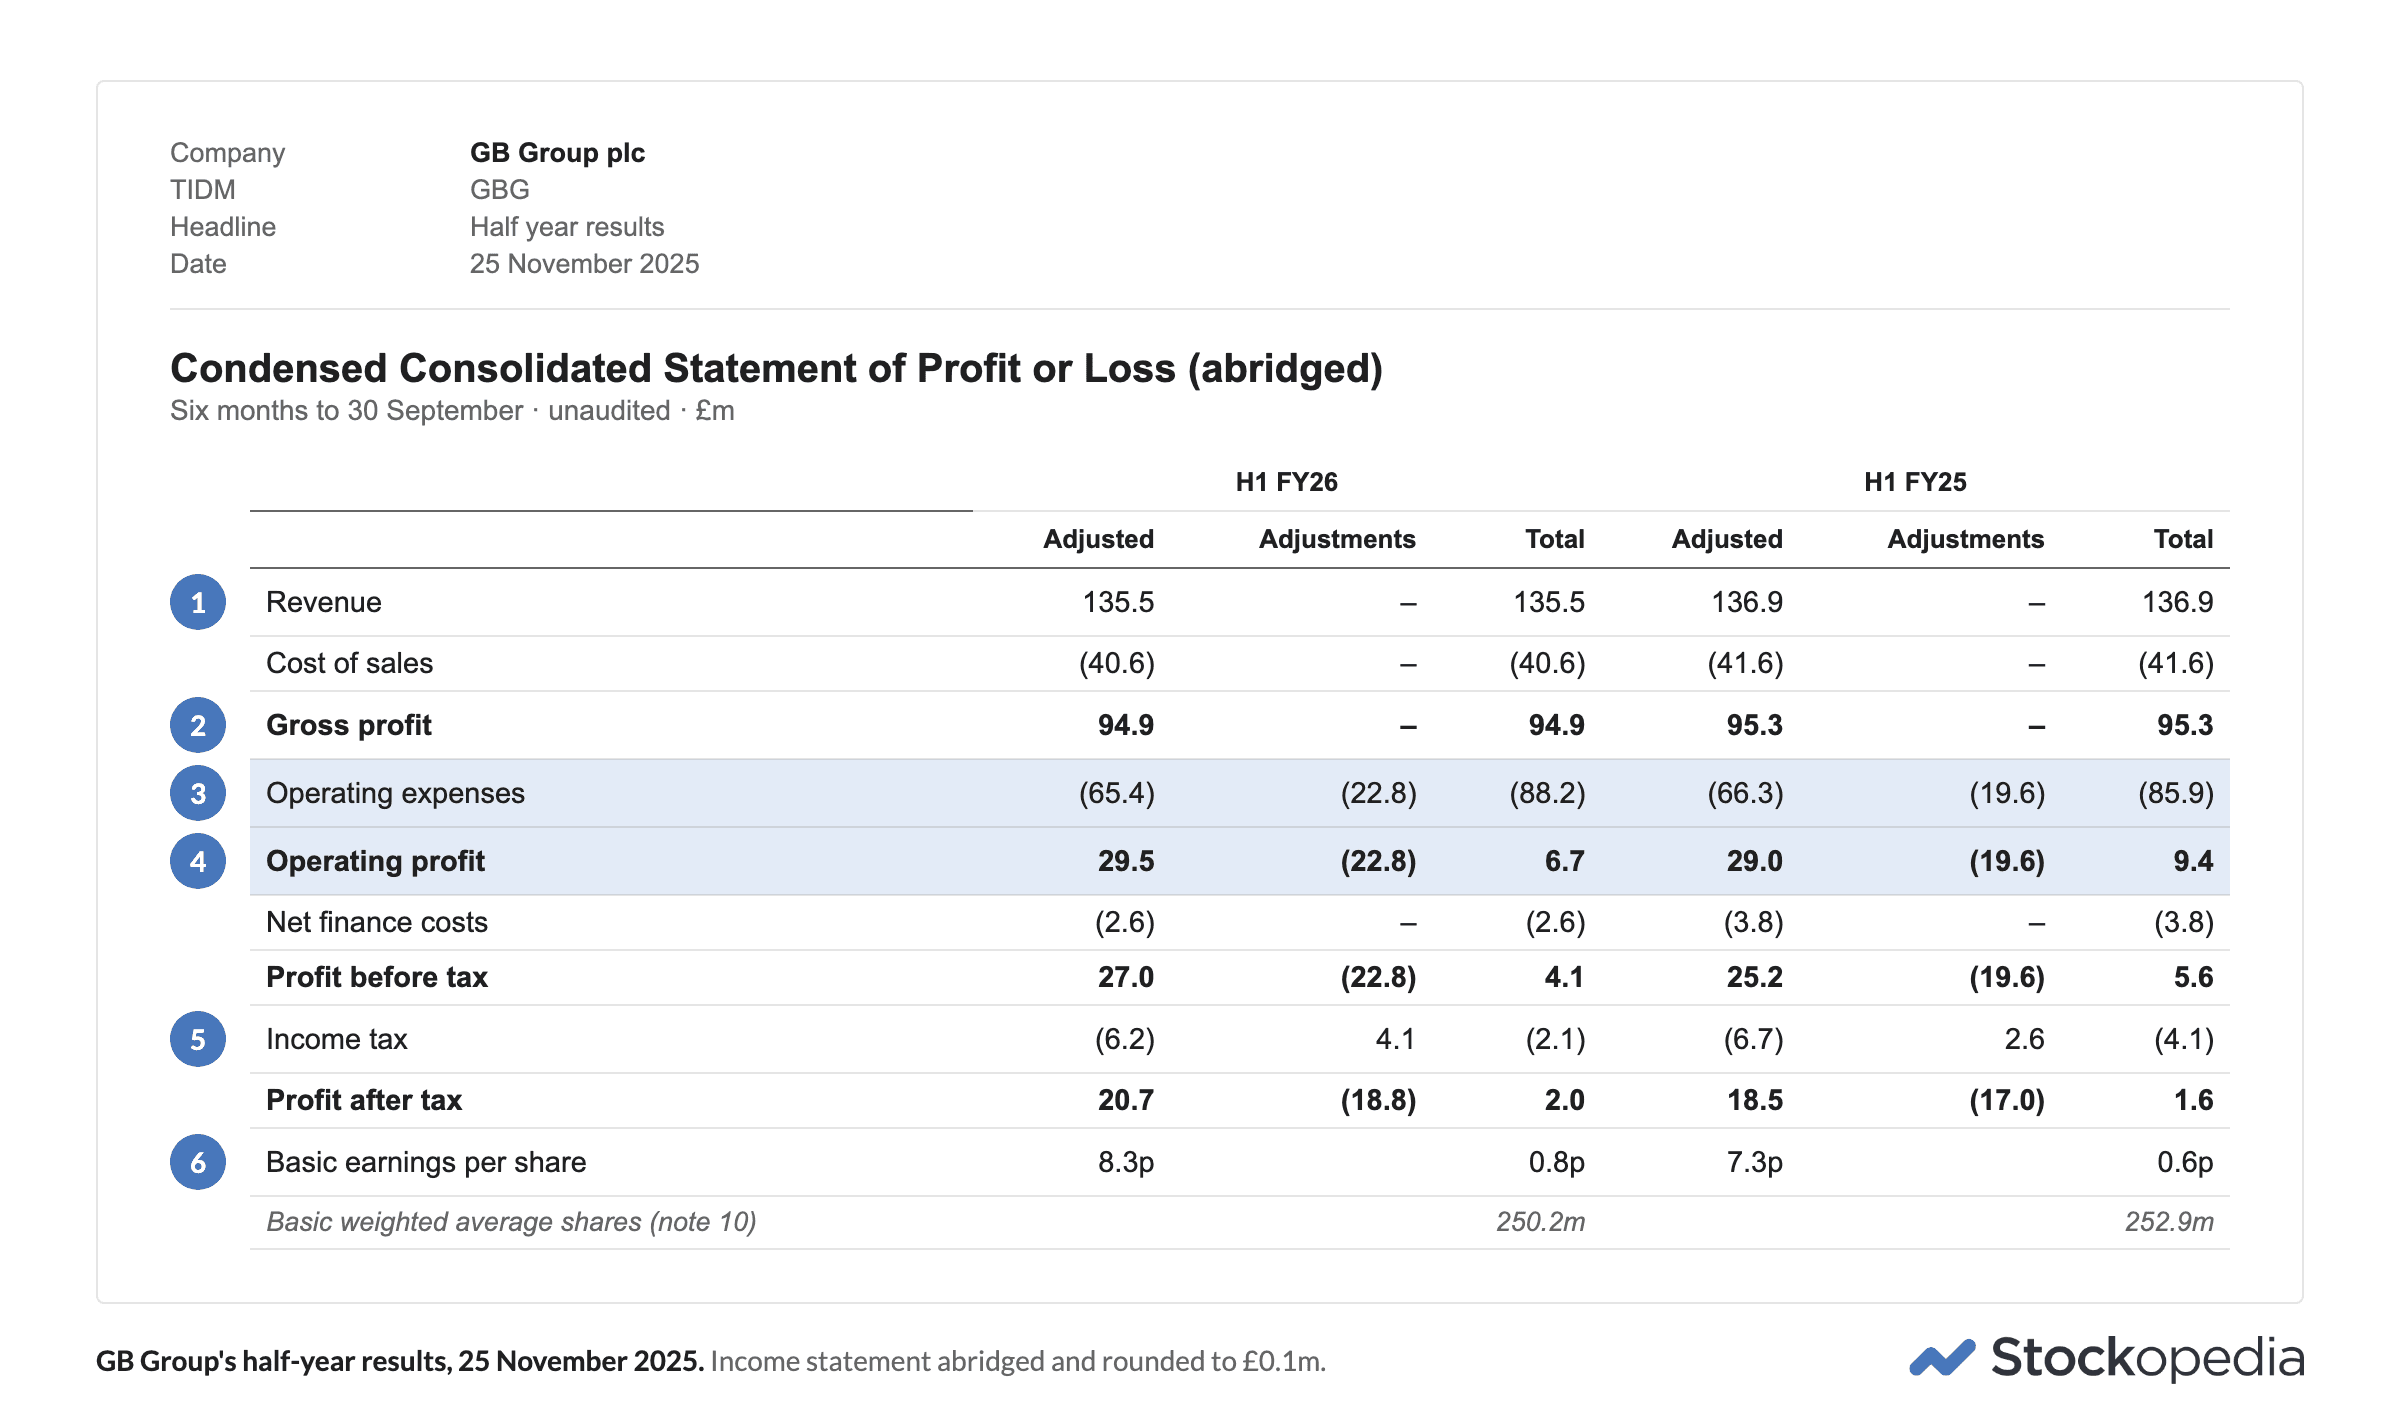
The walk down. Revenue of £135.5m (①), less cost of sales of £40.6m, shown in brackets because it is taken off, left gross profit of £94.9m (②). Operating expenses (③) took that down to a statutory operating profit of £6.7m (④). After interest and tax, £2.0m of profit was left for shareholders, or 0.8p a share (⑥).
Earned or bought? Earned: the one acquisition, a small Australian data business, came after the half ended. Currency cut the other way. Reported revenue fell 1.0%, while at constant currency it grew 1.8%, which Graham called "modest growth for a software business".
Did it make money? At the gross level, yes. GB Group gives its gross margin in the table of highlights at the top: 70.0%, up from 69.6%. You can check it from the statement, dividing gross profit of £94.9m by revenue of £135.5m. Graham called it "strong and slightly improved". The adjusted operating margin, which the company gives only in its finance review, rose to 21.8% from 21.2%. On statutory operating profit the margin fell, to 4.9% from 6.9% (our arithmetic), and the check on which profit to believe explains why.
Where did it come from? GB Group reports four divisions: Identity, which checks that customers are who they say they are; Americas Identity, the same business in the Americas; Location, which checks addresses; and Global Fraud Solutions. Against the same half a year earlier, at constant currency, Identity grew 0.4%, Location 4.8% and Global Fraud Solutions 1.4%, while Americas Identity was "marginally negative". None of them grew fast, and the weak spot was the Americas, which the company said it was confident would return to growth in the second half.
Restated? No. Last year's column shows the figures GB Group reported a year earlier, so the growth rates are measured from them.
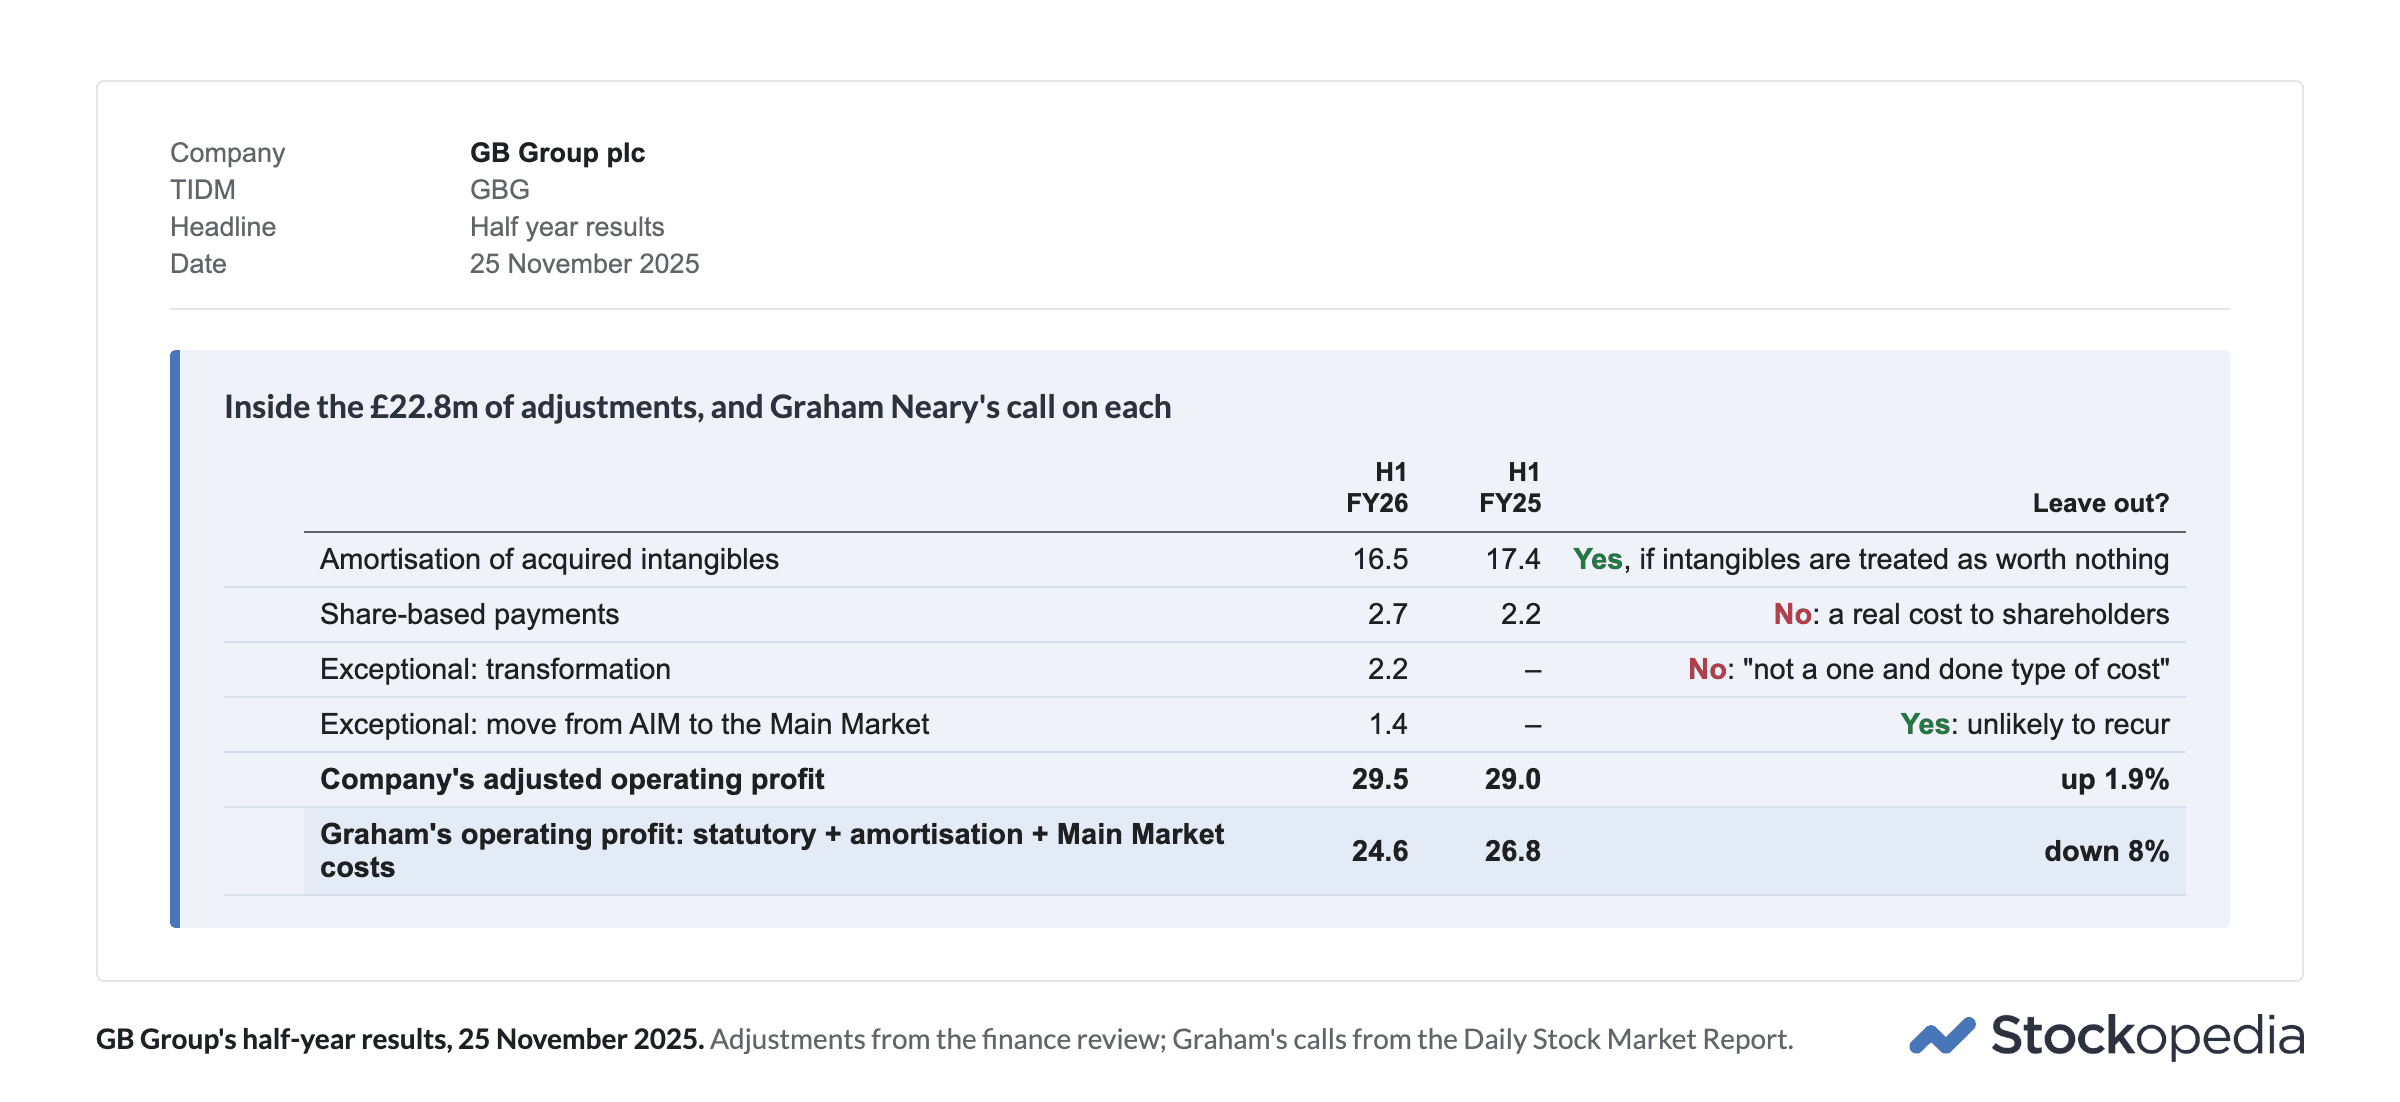
Which profit? For GB Group, this is where the story was. To reach its adjusted operating profit of £29.5m, the company left out £22.8m of costs, shown in the adjustments column (③), against £19.6m a year earlier. That is why adjusted operating profit rose 1.9% while statutory operating profit, after every cost, fell 29% to £6.7m. Graham went through the four costs left out, set out below. He accepted leaving out two: £16.5m of amortisation, an accounting charge for businesses bought in past years, with no money going out this year, and £1.4m for moving from AIM to the Main Market, which won't recur. He didn't accept the other two: £2.7m of share awards to staff, a real cost to shareholders, and £2.2m of "transformation" costs, "not a one and done type of cost". Add back only the first two to the statutory £6.7m and operating profit was £24.6m, down 8% from £26.8m on the same basis a year earlier. On the company's measure it was up 1.9%. "So from my perspective," Graham wrote, "adjusted operating profit is lower this year than last."
The share count and the lines below. Adjusted earnings per share rose 12.6%, far faster than adjusted operating profit. Lower interest helped, and so did the tax rate on adjusted profit (⑤), which fell to 23.0% from 26.5% because of a one-off tax credit. Buybacks cut the average number of shares by about 1%, to 250.2m. Graham's verdict on the per-share figure: "not very meaningful as it's influenced by variable interest rates and a volatile tax charge."
Graham came away more cautious than the market that morning, adding that "the buyback strategy looks a little aggressive to me, given the net debt and balance sheet position." The headline profit was the company's choice, and rebuilding it took a few lines of one table. The last section of this page shows what happened next.
The balance sheet shows what the company owns and owes
The balance sheet lists what the company owns and what it owes on the last day of the period. Reading it helps you understand how the business is funded (equity and debt) and what that funding has bought in assets (some of which may not be real). Here are a few quick questions to ask:
Is the year-end figure typical? The balance sheet is a snapshot of one day, and one day can flatter. Cash can be gathered in for the year end and paid out again the week after.
What is the net debt, and on whose definition? Net debt is borrowings less cash, and it is rarely a defined line on the balance sheet: the company works it out, to its own definition. The biggest difference is leases, which have counted as debt since 2019. Some companies include them and some don't, so two companies' net debt are rarely the same measure.
Can the company carry it? Set net debt against EBITDA, operating profit before depreciation and amortisation, with both on the same basis. Then find the note on borrowings. Most companies borrow through a bank facility: an agreed limit they can draw on and pay back as they need, like a business overdraft, for a fixed number of years. The note shows how big the limit is, how much of it is in use, and when the agreement ends. The unused part, the headroom, is the cushion if trading gets worse. The end date matters because the facility has to be renewed before then, on whatever terms the banks offer at the time, and banks usually attach conditions, called covenants, such as a ceiling on debt against EBITDA. Debt that falls due within a year, while trading is weak, is the combination to worry about.
What does it owe but not call debt? Look for:
a pension deficit, which some companies count in net debt and most don't;
provisions, money set aside for a cost the company expects to pay;
earn-outs, payments still owed to the people who sold the company a business;
funding tucked into working capital: customers' bills sold to a bank, or money borrowed against them, known as invoice financing. It brings the cash in early, and it doesn't appear in net debt.
Is the goodwill still earning its keep? When a company buys a business, it usually pays more than that business's assets are worth on paper. Part of the extra is booked as other intangible assets, such as customer contracts and brands, and written off over a number of years: that is the amortisation that adjusted profit leaves out. What is left over is goodwill, the price of the reputation, the people and the profits the buyer expects. Goodwill isn't written off year by year. Instead the company tests it every year, and when a business bought stops earning enough to justify its price, the goodwill is written down. That write-down, or impairment, costs no cash, because the money went when the business was bought, but it admits the price was too high.
Are stock and unpaid bills growing faster than sales? Compare the growth in receivables, the money customers owe, and in inventory with the growth in sales. Peter Lynch, in One Up on Wall Street: "When inventories grow faster than sales, it's a red flag" (chapter 13). Check first that an accounting change hasn't moved the figures.
Is there a going-concern warning? Search the document for "material uncertainty related to going concern". The auditor must report it when the company may not survive without something, usually new money, that isn't yet certain. The audit opinion stays clean, so the line is easy to miss, and it sits near the end.
Worked example: Computacenter's half-year results, September 2026
Computacenter, which supplies and services IT equipment for large organisations, reported a record first half on 8 September 2026, "significantly ahead of our expectations at the start of the year". It raised its guidance for the year to adjusted profit before tax of "no less than £380m". Roland, who held the shares, went through the balance sheet (abridged details below).
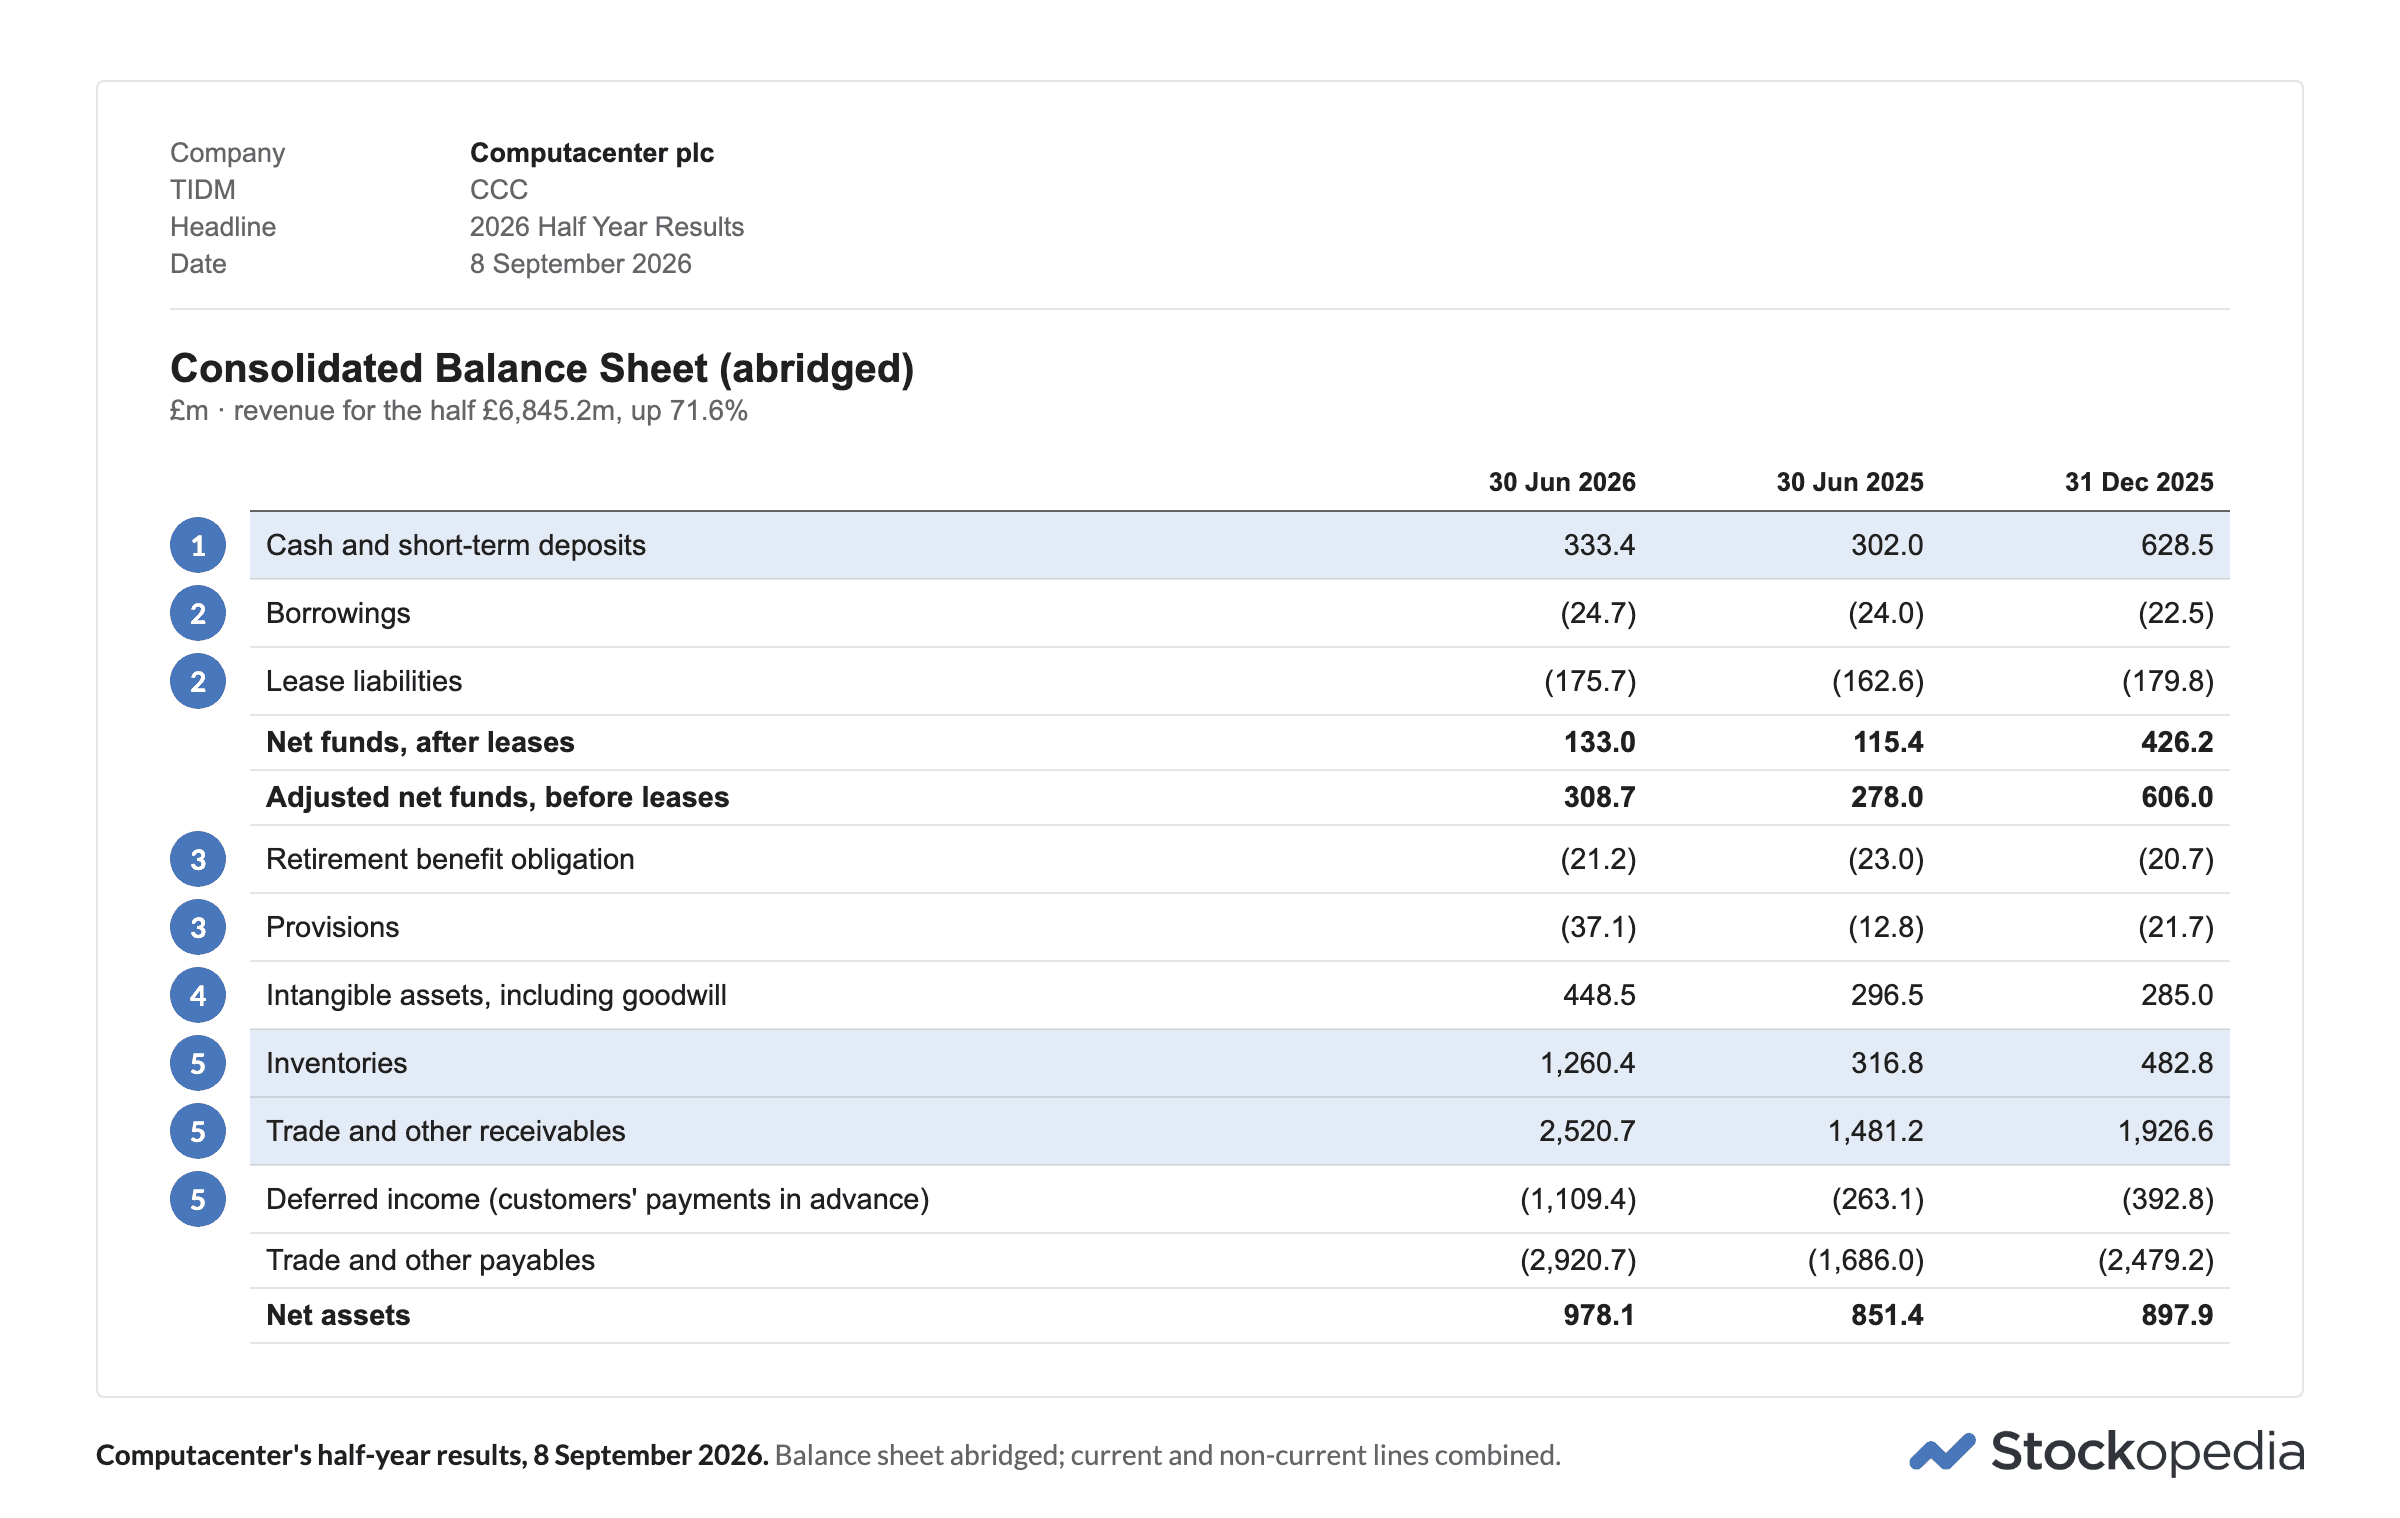
Is the year-end figure typical? No, and the company says so. Cash at the December year end was £628.5m. Six months later it was £333.4m (①). The company says the year-end figure had been lifted by early customer payments that unwound in the half, so the June figure is the more representative of the two.
Net debt, and on whose definition? Computacenter has net cash (not net debt): £308.7m on the company's measure, which leaves out £175.7m of leases, and £133.0m once they are counted (②). Both figures are in the announcement, which makes the comparison easy.
Can it carry it? Easily. Bank borrowings were only £24.7m. The company doubled its bank facility to £400m, running to December 2029, so almost all of it is headroom and nothing needs renewing for three years.
Owed but not called debt? One line to stop at. The pension obligation was £21.2m, small against net assets of £978.1m (③). Provisions rose to £37.1m from £12.8m, partly for "a small number of contracts that are not currently meeting our expectations". There's an earn-out of up to $10m on one of the acquisitions. The line Roland stopped at was in the financial review (⑥): invoice financing of £140.5m, against £50.9m a year earlier, plus £43.4m from customers' bills sold to a bank. Neither counts as debt.
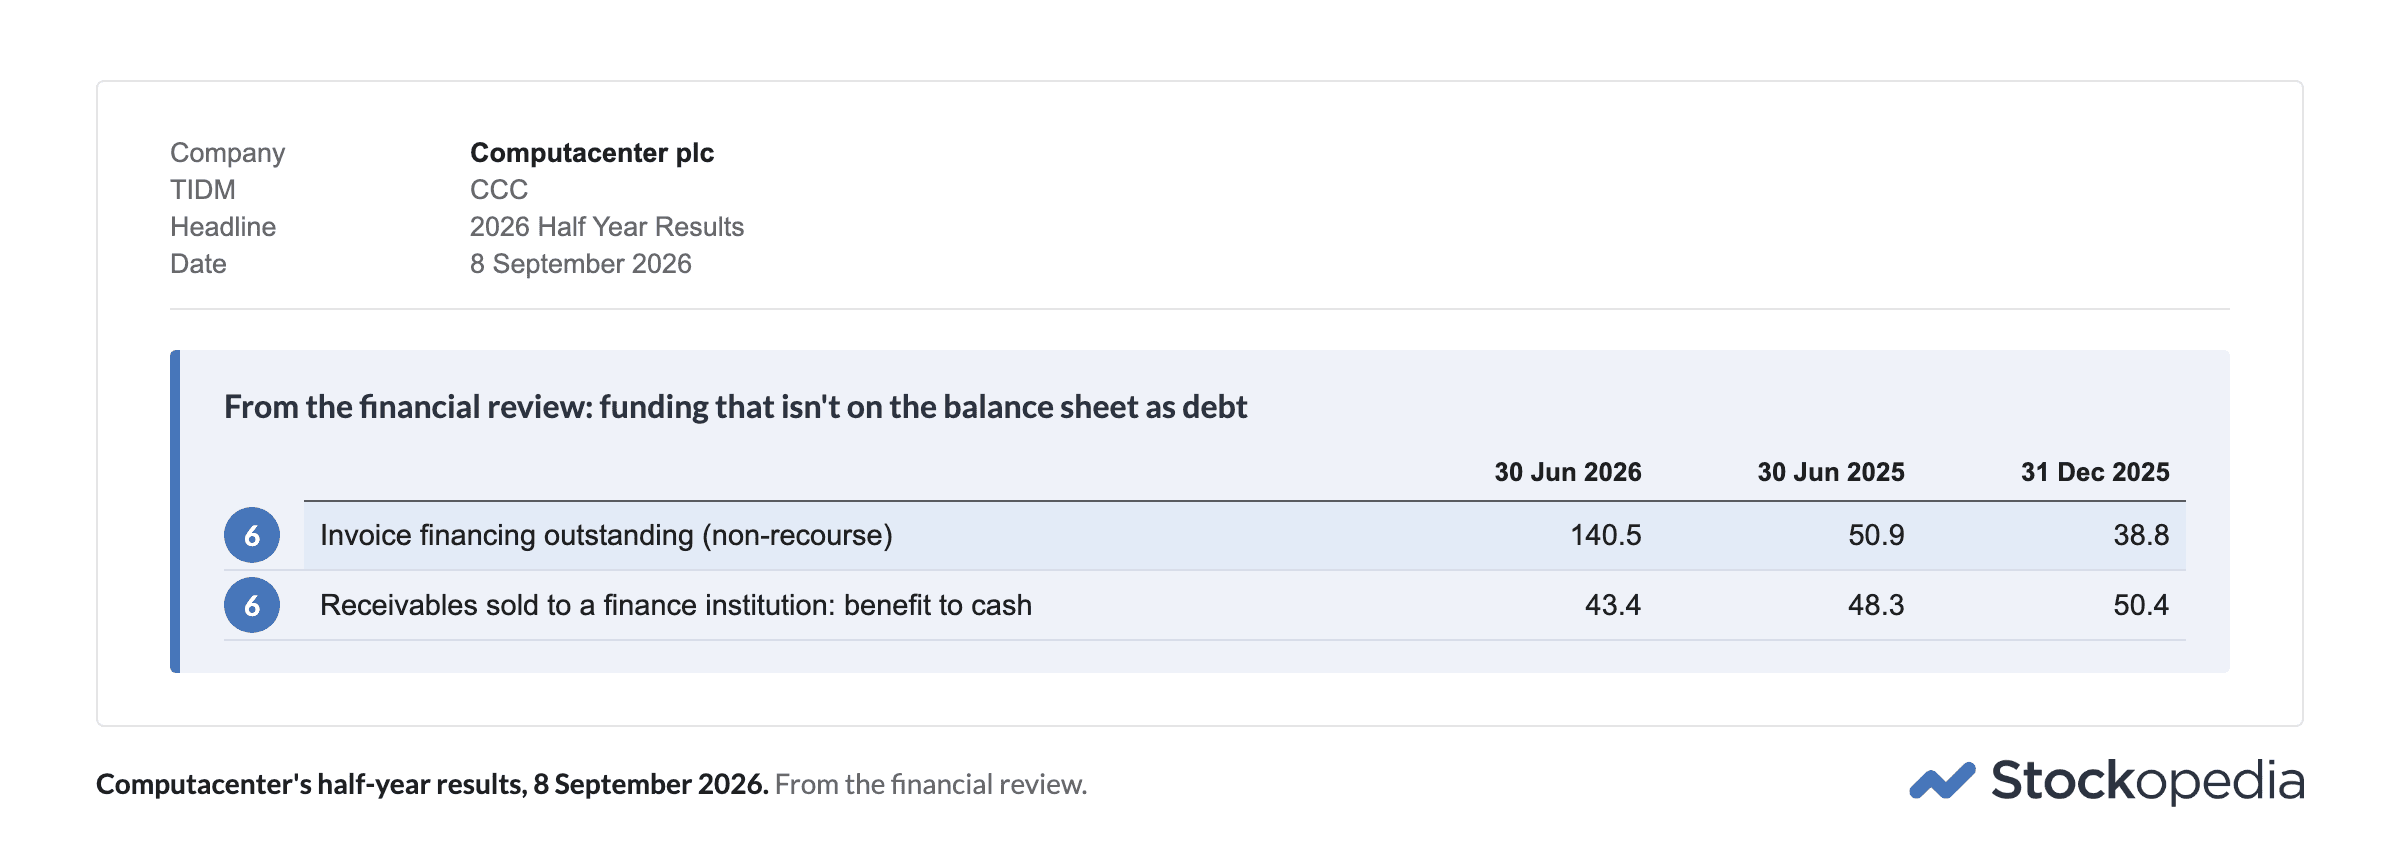
"One potential warning flag for me is Computacenter's increased monetisation of its receivables … In fairness, the increase in invoice financing may simply represent the unprecedented scale of the Technology Sourcing projects currently underway."
Roland Head, Daily Stock Market Report, 8 September 2026
Is the goodwill earning its keep? Too soon to tell. Intangible assets, which include goodwill, rose to £448.5m from £296.5m (④) after two US acquisitions costing about $210m. There was no write-down, and Roland thought both deals "look well judged".
Stock and unpaid bills against sales? In step. Revenue rose 71.6%, and receivables about 70% (⑤), even with the sold and financed bills added back, by our arithmetic. Inventory almost quadrupled, to £1,260.4m, but the company says it is "almost entirely related to committed customer orders", and customers' payments in advance rose to £1,109.4m, which covers much of it.
A going-concern warning? None. The directors modelled a severe downturn, including losing access to the bank facility, and still found no material uncertainty.
The shares fell nearly 8% that day. Roland put it down mainly to valuation: "the good news is now priced in".
The cash flow statement keeps profit honest
Profit and cash are not the same thing. Profit counts a sale when it is made and a cost when it is incurred, not when the cash actually moves: a job invoiced in June and paid in August is profit in June and cash in August. Profit also rests on estimates the company makes itself: how long its equipment will last, how much of a long contract is finished, how much of what customers owe will be paid, what its stock is worth. Cash is what actually came into the bank and went out. Over a few years the two should roughly agree. When profit keeps running ahead of cash, it pays to be cautious.
The cashflow statement has three parts: the cash from trading (operating cashflow), the cash spent on the business and on acquisitions (investing cashflow), and the cash raised from or returned to lenders and shareholders (financing cashflow).
Did the profit become cash? The cash from trading starts from operating profit. It adds back the charges that cost no cash this year, such as depreciation, and takes off the money that went into working capital: more stock, and more bills customers haven't paid yet, less the bills the company hasn't yet paid its own suppliers. Cash conversion is the cash from trading as a share of operating profit. Companies like to quote it, each to its own definition, so compare a company with its own past. Treat it as a trend: one year can swing on timing, but a business whose cash lags its profit year after year has a problem.
Whose free cash flow is it? Free cash flow is what's left from trading after interest, tax, leases and the spending that keeps the business going: the money the company could pay out to you as a shareholder, pay down debt or use for acquisitions. Companies publish their own figure, but no rule defines it, and each chooses what to leave below the line, such as one-off costs or pension payments. When the company's free cash flow looks higher than the cash flow statement suggests, find out what has been left out. You don't have to rebuild it yourself every time. Our analysts work it out in the daily report when the cash is the question, as Roland did for Kier below.
Is it spending enough to stand still? Depreciation is the accounting estimate of how much of the company's equipment and buildings wore out during the year. Capital spending is what it actually spent on them. A company that spends less on capital spending than its depreciation expense, year after year, is running the business down to lift its cash.
Will the cash repeat? Working capital swings. Stock run down, customers paying early, or the company paying its own suppliers late can make one year's cash look better than the next year's will be. Look at how much working capital added this year, and compare it with last.
Where did the money go? Follow it out: dividends, buybacks, acquisitions and payments into the pension scheme. If they came to more than the free cash flow, the difference was borrowed or came out of the cash pile.
Worked example: Kier's full-year results, September 2025
Kier, the construction and infrastructure group, published its results for the year to June 2025 on 16 September 2025. They reported free cash flow of £155m. Roland held the shares at the time, and said so in the report.
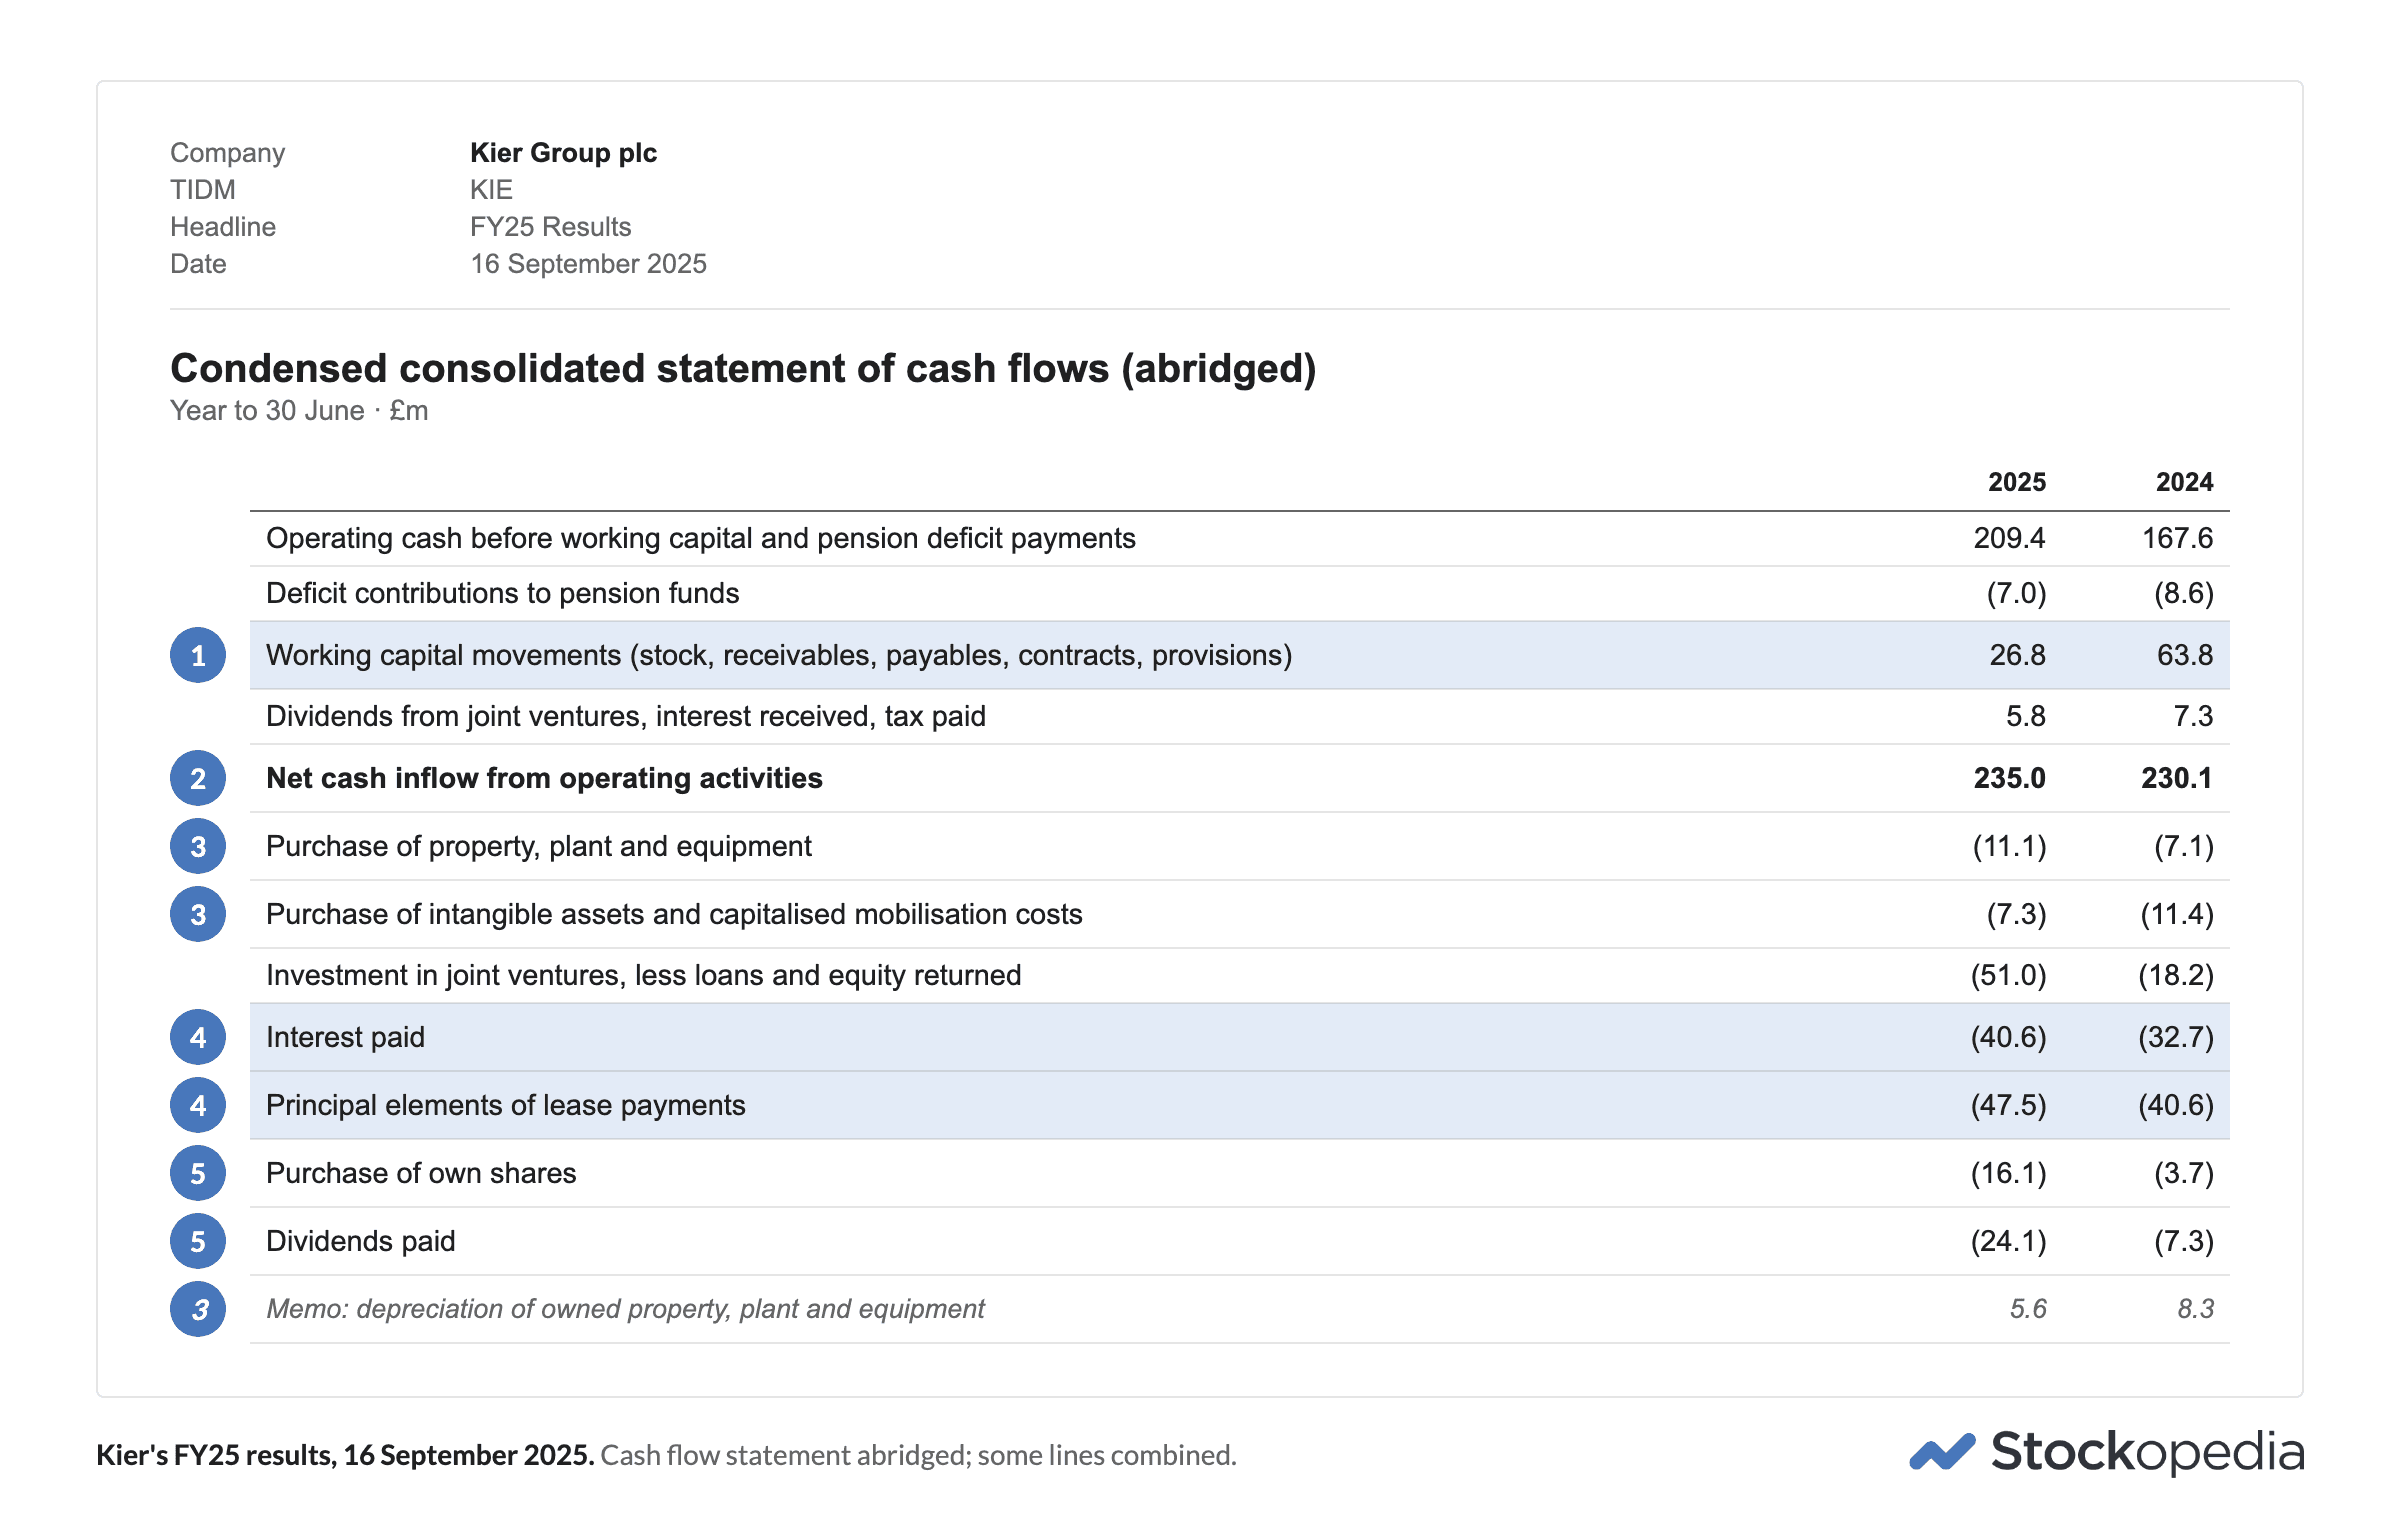
Did the profit become cash? Yes. Trading brought in £235.0m (②). Kier quoted "125% operating cash conversion". Roland's own free cash flow of about £86m was "a pretty respectable result, compared to reported net profit of £56.4m".
Whose free cash flow is it? Kier's is generous. Roland couldn't get to the company's figure:
"The company reports a free cash flow figure of £155m today, but I can't get close to this. Working down the cash flow statement gives me a free cash flow sum of around £86m, including all finance, tax and lease costs."
Roland Head, Daily Stock Market Report, 16 September 2025
Most of the gap is what Kier leaves below its own line: one-off costs, pension deficit payments and the money it put into its property joint ventures.
Spending enough to stand still? Yes. Kier spent £11.1m on property and equipment against £5.6m of depreciation (③). It also leases much of what it uses, and its £47.5m of lease payments (④) roughly matched the £46.1m of depreciation on leased assets.
Will the cash repeat? Roland had doubts. Working capital added £26.8m (①), down from £63.8m the year before. Roland's worry was the year end itself. The bills Kier owed its suppliers at the year end looked like more than 100 days of costs, against the 34 days in which Kier says it pays them, so the year-end cash may have been helped by timing. Average month-end net debt was £49.2m, against £204.1m of net cash at the year end: "it's the average month-end figure that's more useful here."
Where did the money go? It was paid for. Dividends took £24.1m and share buybacks £16.1m (⑤), on top of the joint-venture money and the pension payments, and net cash still rose by £37m.
The shares rose 7% that day. Roland's overall impression was that the results were "fine and do not highlight any serious concerns". The company's free cash flow was only the starting point.
Banks, property companies and trusts read differently. For a bank, the cash flow statement matters less: read the interest margin, the charge for bad debts, the capital ratio and tangible net assets per share. A property company's statutory profit includes changes in the value of its buildings, so read its recurring earnings and net tangible assets per share. Investment trusts are judged on net asset value and the discount the shares trade at. Housebuilders, miners and software companies have measures of their own too.
Good results pass the same checks
A good set of results passes the same checks, and it helps to know what a pass looks like:
the growth is mostly earned;
the margins are holding or rising;
statutory profit is close to the adjusted figure, or the gap is explained and shrinking;
the cash matches the profit;
debt is falling, or there is net cash;
the dividend is held or raised, and covered by the free cash flow as well as by earnings;
the outlook has evidence behind it: current trading in the first weeks of the new year, an order book, or conditions you can check. Set it beside last year's outlook too, as companies heading into a decline tend to drop the good lines more than they add bad ones.
No set of results passes every check, and our analysts weigh them. One of Graham's write-ups puts the question in a heading: "How clean are these results?"
A bad headline can sometimes be read through, too. A statutory loss or a big write-down matters less when the cause is named, the market already knew about it, and the cash and the outlook are intact. "Non-cash" on its own isn't enough, because a write-down can arrive alongside lower forecasts.
Worked example: Volution's results, October 2026
Volution, which makes ventilation systems, published its results for the year to July 2026 on 8 October 2026. They passed most of the checks, and the two that didn't are worth seeing.
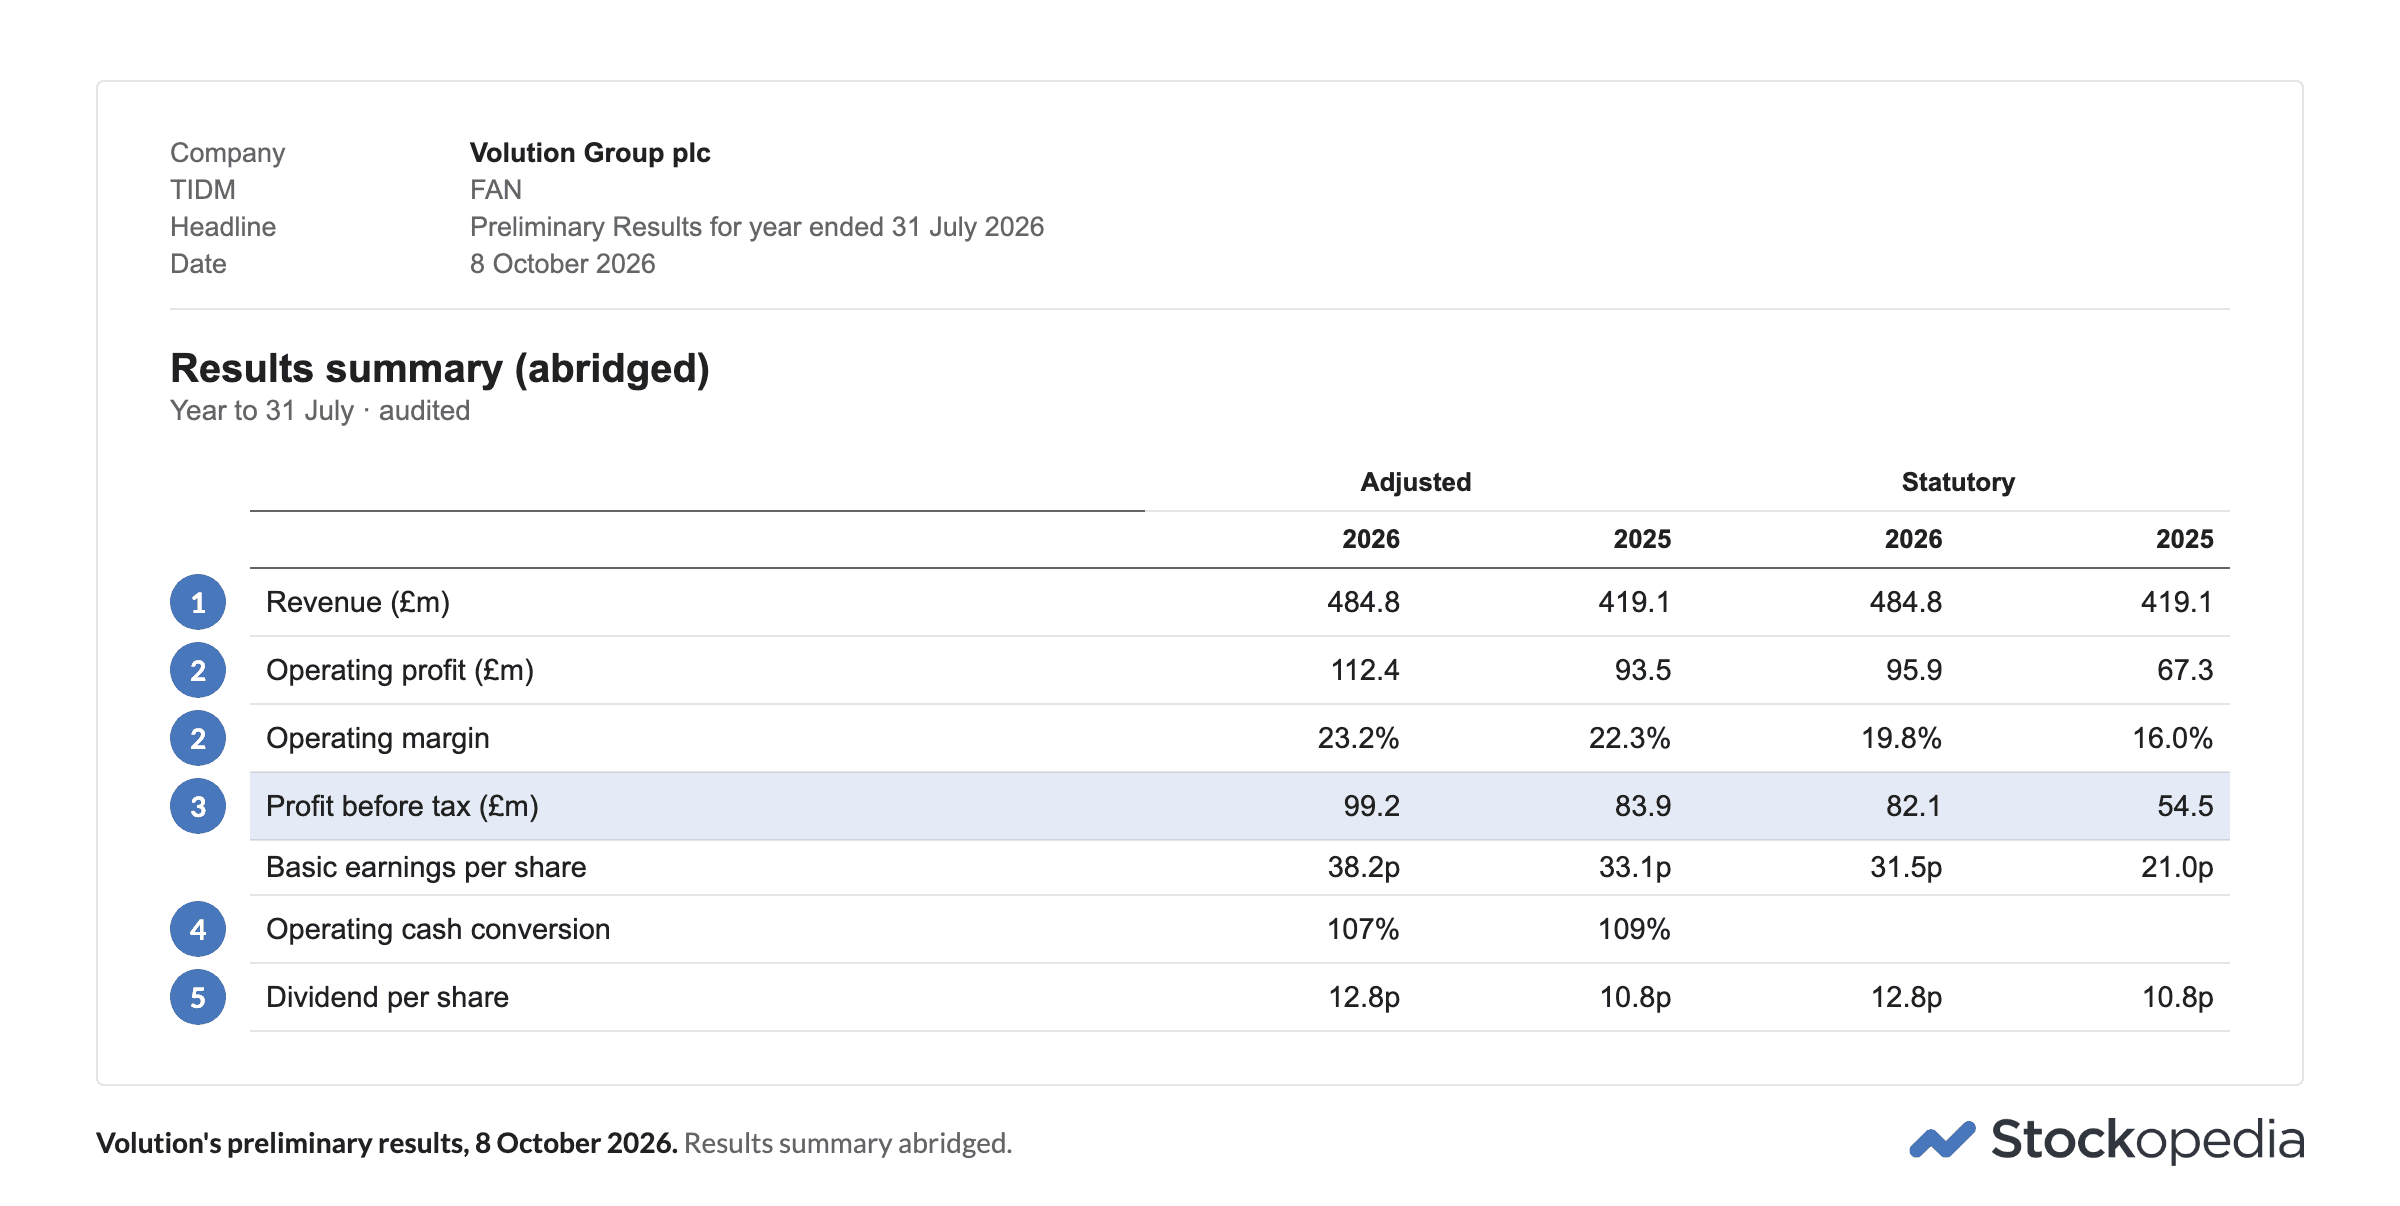
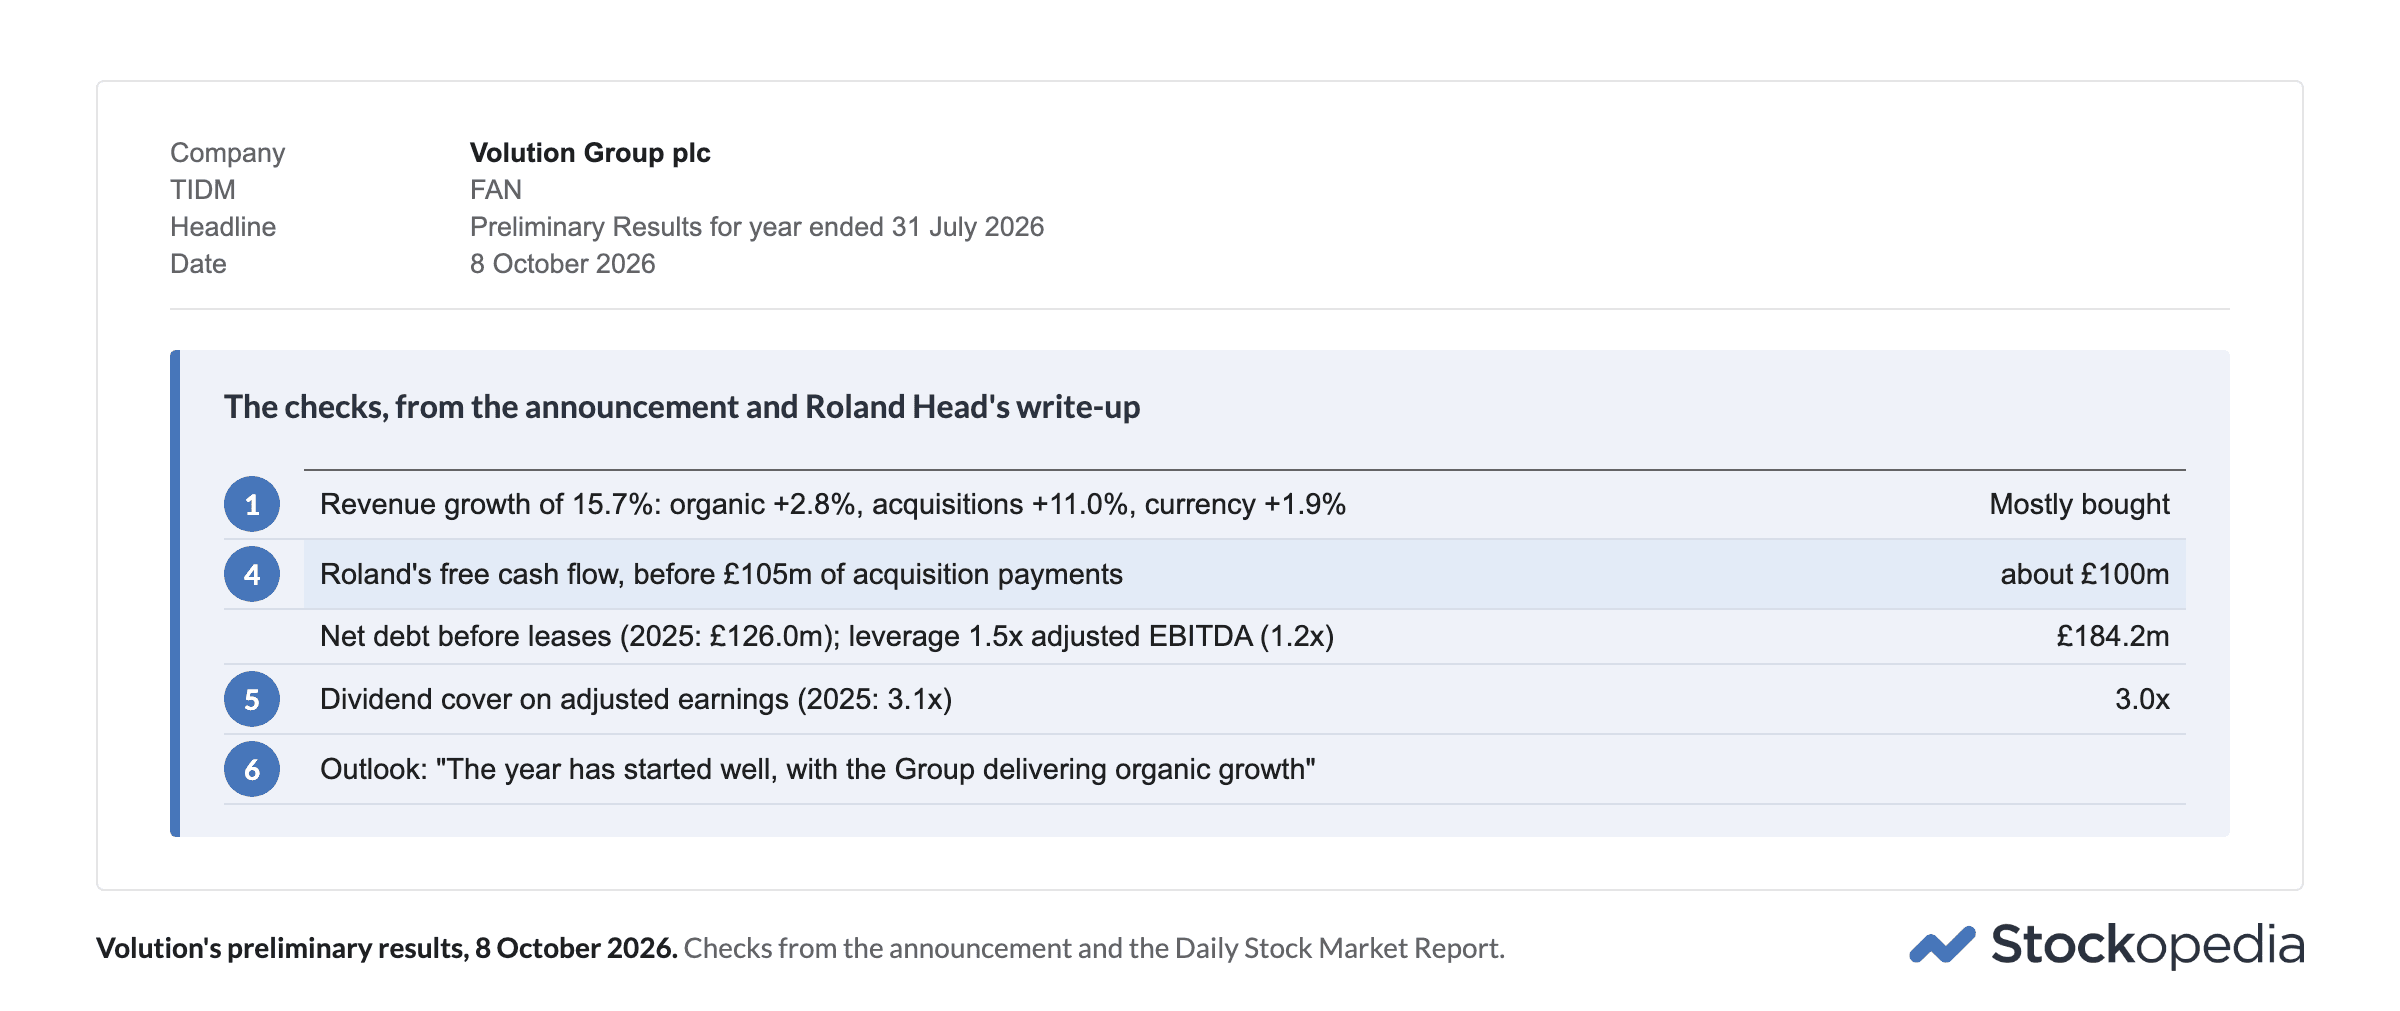
Earned or bought: mostly bought. Revenue rose 15.7%, of which only 2.8% was organic. Acquisitions added 11.0% (①). Roland: "The company has leant heavily on acquisitions for growth."
Margins: rising. The adjusted operating margin rose to 23.2% from 22.3%, and the statutory margin to 19.8% from 16.0% (②).
The gap: explained and shrinking. Adjusted profit before tax was £99.2m and statutory £82.1m (③), a gap of £17.1m against £29.4m a year earlier. The biggest adjustment was the amortisation of businesses bought.
Cash: matches the profit. Cash conversion was 107% (④). Roland worked out free cash flow of about £100m, before £105m spent on acquisitions, and drew the conclusion: "the company's adjusted profit measures are a good guide to cash generation".
Debt: up, for a reason. Net debt before leases rose to £184.2m from £126.0m, 1.5 times EBITDA. Roland found that free cash flow paid for most of the acquisitions and the dividend, and borrowing the rest: "I don't have any serious concerns about Volution's balance sheet."
Dividend: well covered. Up 18.5% to 12.8p, covered three times by adjusted earnings and comfortably by the free cash flow (⑤).
Outlook: positive, without a number. "The year has started well" (⑥), with the UK still hard going and first orders from data centres in Australia as the evidence of new demand.
The shares barely moved that day, and Roland kept a broadly positive view. A gap between adjusted and statutory profit isn't a verdict on its own: here the cash said the company's measure was the fair one. Roland still uses statutory profit for return on capital, as the StockReport does, because the cost of buying businesses "does represent a historic capital allocation decision by management".
After results day, the forecasts and the StockRanks catch up
The share price moves on results morning, but the numbers behind it can take days to settle. That morning, set the results against the forecasts, like with like: brokers usually forecast the adjusted figure. Over the following days, the brokers revise their forecasts, and slowly. The StockReport usually takes a minimum of 24 hours to load new results, so on results morning it still shows the old numbers. Then the StockRanks move: the price reaction feeds the MomentumRank, and the new accounts feed the QualityRank. Weeks later comes the annual report, with the auditor's full report and the details the announcement left out.
So the reading doesn't stop at 7am, and it is why our analysts come back to a company in the daily report as the forecasts change. GB Group shows how it plays out.
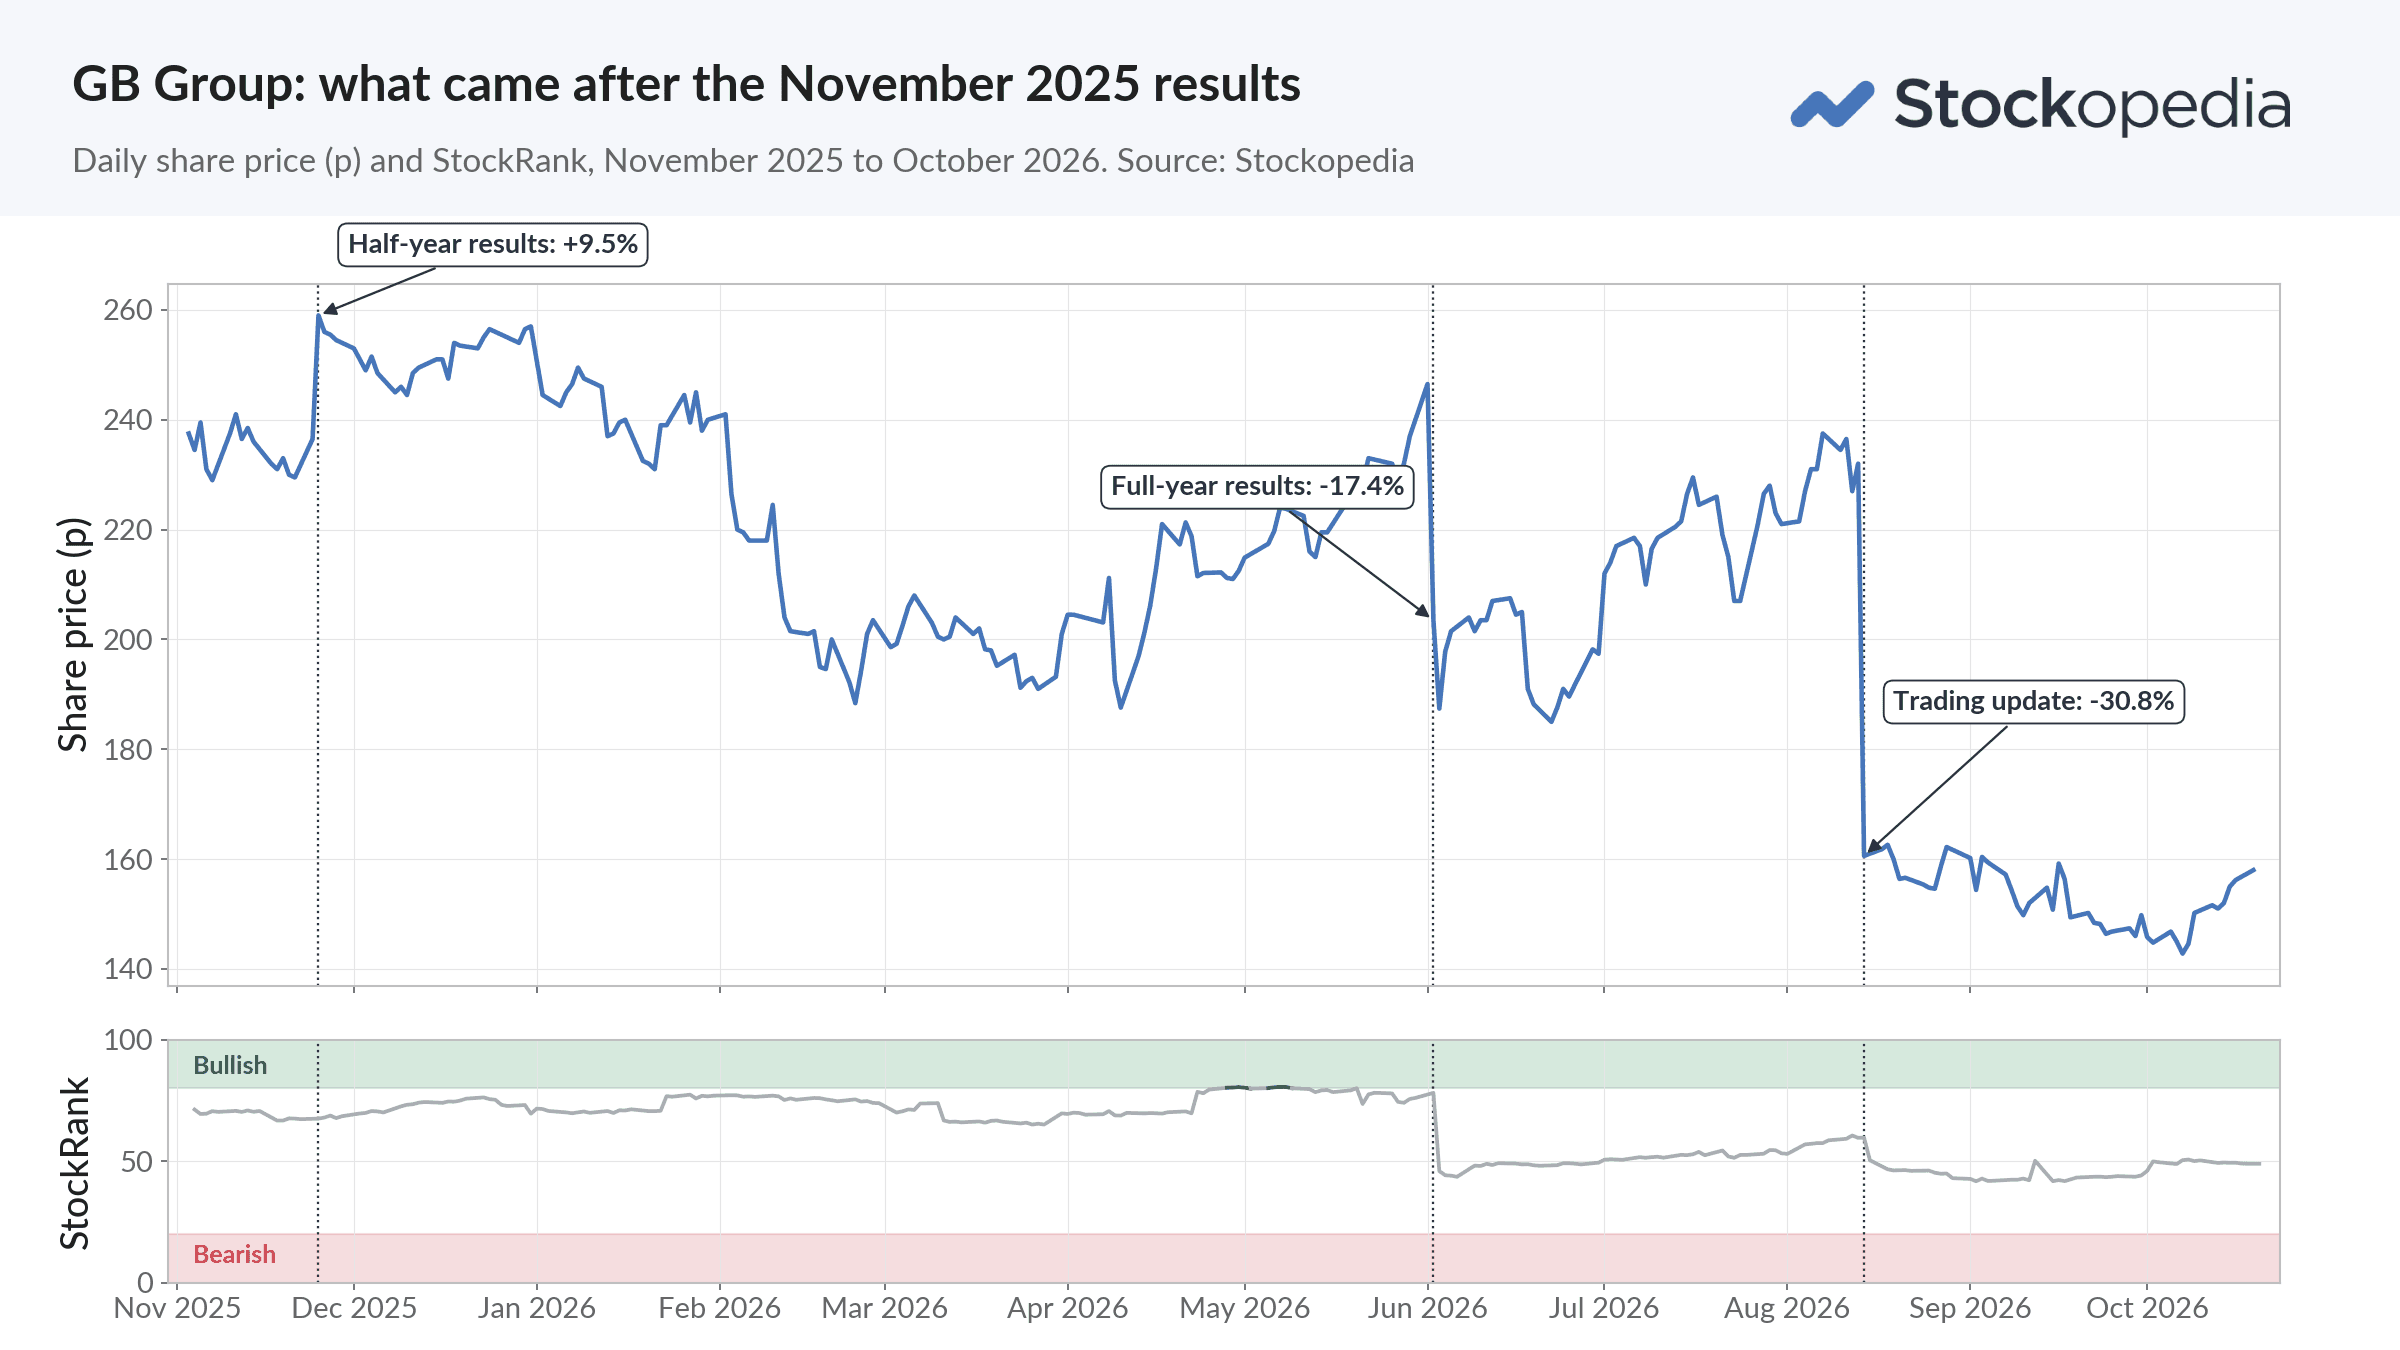
After the November half-year results, Graham had warned that "the company's EPS forecasts have been shaky this year". The June full-year results were in line, headed "Expectations delivered", but guided to a lower margin for the new year, and Roland expected brokers "to trim their earnings estimates slightly". By the next morning the StockRank had fallen from 78 to 46, with the QualityRank down from 86 to 64. In August a trading update cut the company's growth guidance and the shares fell by almost a third. The second half Graham had doubted did improve, and the August warning was about the following year. What ran through all three announcements was the adjustments and the borrowing to buy back shares, and both were there to read in November.
If the results beat expectations or raised guidance, read what "ahead of expectations" means for a share price. If they missed or the outlook cut, read what happens to a share after a profit warning.
From the Daily Stock Market Report. Every weekday morning Graham, Roland and the team read the results as they land and set out what was new, what was given away weeks ago, and what the numbers further down say. Read today's report · Sign up to our newsletters
Questions readers ask
Do interim results have to be audited?
No. A Main Market company's half-year report must say if it wasn't audited or reviewed, and a review is far lighter than an audit: the auditor says only that "nothing has come to our attention".
Are preliminary results the same as the annual report?
No. The preliminary results announcement is optional and comes first, agreed with the auditors on the Main Market. The audited annual report follows weeks later. Now and then a company publishes preliminary results marked "unaudited", because its auditors haven't finished, and confirms the numbers later.
Why did the shares fall when the results looked good?
Usually because of something further down: the outlook, the cash or the dividend. Computacenter, above, fell on record results. Sometimes the market simply expected better, which our guide to "ahead of expectations" explains.
Are the rules on adjusted profit changing?
Yes. From accounting years starting in 2027, companies that report under international accounting standards must show a defined operating profit, and their own adjusted measures move into a single audited note that reconciles each one to the statutory figures. For a December year-end, the first interims under the new rules arrive in 2027. AIM companies that report under UK accounting rules aren't affected.
Where to go next
More in this series: How to read a UK trading statement · What to do when a company beats expectations · What to do on a profit warning · How the UK's stock markets compare · Understanding UK reporting seasons · The StockRanks explained · The Ultimate Guide to Reading Company Announcements