Growth & Value
| 12m Forecast Rolling | Industry | Market | |
|---|---|---|---|
| PE Ratio (f) | n/a | ||
| PEG Ratio (f) | n/a | ||
| EPS Growth (f) | n/a | ||
| Dividend Yield (f) | n/a | ||
| Valuation (ttm) | Industry | Market | |
|---|---|---|---|
| Price to Book Value | 2.22 | ||
| Price to Tang. Book | 2.22 | ||
| Price to Free Cashflow | 16.41 | ||
| Price to Sales | 4.11 | ||
| EV to EBITDA | 7.44 | ||
Shareholder Activity
| Type | Buy / Hold / Sell |
|---|---|
| Institutions | |
| Directors | |
| Community |
Guru Screens
Quality
| Name | Industry | Market | |
|---|---|---|---|
| Return on Capital | 21.66% | ||
| Return on Equity | 22.03% | ||
| Operating Margin | 48.5% | ||
Financial Summary
| Year End 31st Mar | Unit | 2022 | 2023 | 2024 | 2025 | 2026 | 2027E | 2028E | CAGR / Avg |
|---|---|---|---|---|---|---|---|---|---|
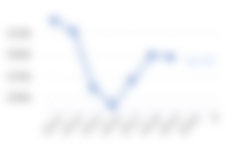
| Total Revenue | ¥m | 14,043 | 13,359 | 16,498 | 17,960 | 19,577 | n/a | n/a | 6.49% |
| Operating Profit | m | ||||||||
| Net Profit | m | ||||||||
| EPS Reported | |||||||||
| Diluted Normalised EPS | |||||||||
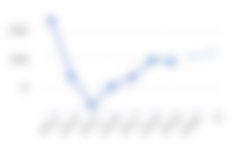
| EPS Growth | % | +24.8 | +2.87 | +45.04 | -19.48 | +25.21 | n/a | n/a | n/a |
| PE Ratio | x | ||||||||
| PEG | |||||||||
| Profitability | |||||||||
| Operating Margin | % | ||||||||
| ROA | % | ||||||||
| ROCE | % | ||||||||
| ROE | % | ||||||||
| Cashflow | |||||||||
| Op. Cashflow ps | |||||||||
| Capex ps | |||||||||
| Free Cashflow ps | |||||||||
| Dividends | |||||||||
| Dividend ps | |||||||||
| Dividend Growth | % | ||||||||
| Dividend Yield | % | ||||||||
| Dividend Cover | x | ||||||||
| Balance Sheet | |||||||||
| Cash etc | m | ||||||||
| Working Capital | m | ||||||||
| NFA | m | ||||||||
| Net Debt | m | ||||||||
| Book Value | m | ||||||||
| Diluted Weighted Average Shares | m | ||||||||
| Book Value ps | |||||||||
Other Ratios
| Leverage (ttm) | Total | - Intang | + Pension |
|---|---|---|---|
| Gross Gearing | |||
| Net Gearing | |||
| Cash / Assets |
| Liquidity (ttm) | |
|---|---|
| Curr. Ratio | |
| Quick Ratio | |
| Interest Cov. | |
| Efficiency (ttm) | |
|---|---|
| Asset Turnover | |
| Recs Turnover | |
| Stock Turnover | |
Recent History
| Latest interim period vs. prior period | Industry | Market | |
|---|---|---|---|
| Sales Growth | |||
| EPS Growth | |||
| 3yr Compound Annual Growth Rate | Industry | Market | |
|---|---|---|---|
| Sales CAGR | |||
| EPS CAGR | |||
| DPS CAGR | |||



Profile Summary
SPARX Group Co., Ltd. is a Japan-based company mainly engaged in asset management business, including investment advisory services and investment trust management. The Company operates through a single segment called investment advisory services. SPARX Asset Management Co., Ltd. conducts research and management targeting Japanese equities, renewable energy power generation projects from the development stage to the start of operation, and unlisted stocks. SPARX Asset Trust & Management Co., Ltd. conducts research and management targeting real estate and renewable energy power generation projects. In addition, SPARX Asset Management Korea Co., Ltd. conducts research and management targeting Korean equities. SPARX Asia Investment Advisors Limited conducts research and management targeting Asian equities.
Directors
- Shuhei Abe PRE (72)
- Masatoshi Fukami DRC (64)
- Takeshi Suzuki EXO (55)
- Toshihiko Nakagawa IND (74)
- Hiroshi Minematsu CFO (54)
- Takaki Demichi EXO (53)
- Kimie Morishita IND (58)
- Hidehide Taniwaki EXO
- Kota Mizutani EXO
- Tetsuya Hirano EXO
- Toshiyuki Kato IND (69)
- Mikihide Katsumata IND (66)
- Last Annual
- March 31st, 2026
- Last Interim
- September 30th, 2026
- Incorporated
- June 20th, 1988
- Public Since
- December 4th, 2001
- No. of Shareholders
- 6,577
- No. of Employees
- 187
- Sector
- Investment Banking & Investment Services
- Industry
- Financials
- Exchange
 Tokyo Stock Exchange
- Shares in Issue
- 39,558,978

- Address
- 6F, MINATO-KU, 108-0075
- Web
- https://www.sparx.jp
- Phone
- +81 367119100
- Auditors
- Ernst & Young ShinNihon LLC
Latest News for 8739
Upcoming Events for 8739
Q3 2027 SPARX Group Co., Ltd. Earnings Release
Dividend For 8739.T - 55.0000 JPY
Similar to 8739
abc
Tokyo Stock Exchange
AI Fusion Capital
Tokyo Stock Exchange
Ai Partners Financial
Tokyo Stock Exchange
Aizawa Securities
Tokyo Stock Exchange
Akatsuki
Tokyo Stock Exchange
FAQ
As of Today at 22:28 UTC, shares in SPARX are trading at ¥2,363. This share price information is delayed by 15 minutes.
Shares in SPARX last closed at ¥2,363 and the price had moved by +60.86% over the past 365 days. In terms of relative price strength the SPARX share price has outperformed the Nikkei 225 Index by +42.51% over the past year.
There is no consensus recommendation for this security.
Find out moreThe SPARX dividend yield is 6.14% based on the trailing twelve month period.
Last year, SPARX paid a total dividend of ¥145, and it currently has a trailing dividend yield of 6.14%.Looking ahead, shares in SPARX are due to go ex-dividend on 2027-03-30 and the next dividend pay date is 2026-12-04.
SPARX are due to go ex-dividend on 2027-03-30 and the next dividend pay date is 2026-12-04. The historic dividend yield on SPARX shares is currently 6.14%.
To buy shares in SPARX you'll need a share-dealing account with an online or offline stock broker. Once you have opened your account and transferred funds into it, you'll be able to search and select shares to buy and sell. You can use Stockopedia’s share research software to help you find the the kinds of shares that suit your investment strategy and objectives.
As of the previous close price of ¥2,363, shares in SPARX had a market capitalisation of ¥93bn.
Here are the trading details for SPARX:
- Country of listing: Japan
- Exchange: TYO
- Ticker Symbol: 8739
Based on an overall assessment of its quality, value and momentum SPARX is currently classified as a Super Stock. The classification is based on a composite score that examines a wide range of fundamental and technical measures. Stock are classified on the the following spectrum: Super Stocks, High Flyers, Contrarians, Turnarounds, Neutral, Value Traps, Momentum Traps, Falling Stars, and Sucker Stocks. For more information, learn about our StockRank Styles.
We could not find analyst target price data for this security.
Find out moreAn important predictor of whether a stock price will go up is its track record of momentum. Price trends tend to persist, so it's worth looking at them when it comes to a share like SPARX. Over the past six months, its share price has outperformed the Nikkei 225 Index by +25.94%.
As of the last closing price of ¥2,363, shares in SPARX were trading +7.31% higher than their 200 day moving average. You can read more about the power of momentum in assessing share price movements on Stockopedia.
The SPARX PE ratio based on its reported earnings over the past 12 months is null. The shares last closed at ¥2,363.
The PE ratio (or price-to-earnings ratio) is the one of the most popular valuation measures used by stock market investors. It is calculated by dividing a company's price per share by its earnings per share.
The PE ratio can be seen as being expressed in years, in the sense that it shows the number of years of earnings which would be required to pay back the purchase price, ignoring inflation. So in general terms, the higher the PE, the more expensive the stock is.
SPARX's management team is headed by:
- Shuhei Abe - PRE
- Masatoshi Fukami - DRC
- Takeshi Suzuki - EXO
- Toshihiko Nakagawa - IND
- Hiroshi Minematsu - CFO
- Takaki Demichi - EXO
- Kimie Morishita - IND
- Hidehide Taniwaki - EXO
- Kota Mizutani - EXO
- Tetsuya Hirano - EXO
- Toshiyuki Kato - IND
- Mikihide Katsumata - IND