Growth & Value
| 12m Forecast Rolling | Industry | Market | |
|---|---|---|---|
| PE Ratio (f) | n/a | ||
| PEG Ratio (f) | n/a | ||
| EPS Growth (f) | n/a | ||
| Dividend Yield (f) | n/a | ||
| Valuation (ttm) | Industry | Market | |
|---|---|---|---|
| Price to Book Value | 0.77 | ||
| Price to Tang. Book | 0.8 | ||
| Price to Free Cashflow | 7.58 | ||
| Price to Sales | 0.6 | ||
| EV to EBITDA | 2.86 | ||
Shareholder Activity
| Type | Buy / Hold / Sell |
|---|---|
| Institutions | |
| Directors | |
| Community |
Guru Screens
Quality
| Name | Industry | Market | |
|---|---|---|---|
| Return on Capital | 9.93% | ||
| Return on Equity | 8.38% | ||
| Operating Margin | 8.24% | ||
Financial Summary
| Year End 30th Apr | Unit | 2022 | 2023 | 2024 | 2025 | 2026 | 2027E | 2028E | CAGR / Avg |
|---|---|---|---|---|---|---|---|---|---|
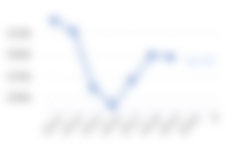
| Total Revenue | ¥m | 25,921.39 | 27,871.41 | 27,102.2 | 27,388.21 | 27,039.08 | n/a | n/a | 3.78% |
| Operating Profit | m | ||||||||
| Net Profit | m | ||||||||
| EPS Reported | |||||||||
| Diluted Normalised EPS | |||||||||
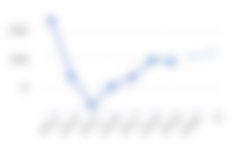
| EPS Growth | % | -3.71 | +24.43 | +36.52 | -32.83 | +16.29 | n/a | n/a | n/a |
| PE Ratio | x | ||||||||
| PEG | |||||||||
| Profitability | |||||||||
| Operating Margin | % | ||||||||
| ROA | % | ||||||||
| ROCE | % | ||||||||
| ROE | % | ||||||||
| Cashflow | |||||||||
| Op. Cashflow ps | |||||||||
| Capex ps | |||||||||
| Free Cashflow ps | |||||||||
| Dividends | |||||||||
| Dividend ps | |||||||||
| Dividend Growth | % | ||||||||
| Dividend Yield | % | ||||||||
| Dividend Cover | x | ||||||||
| Balance Sheet | |||||||||
| Cash etc | m | ||||||||
| Working Capital | m | ||||||||
| NFA | m | ||||||||
| Net Debt | m | ||||||||
| Book Value | m | ||||||||
| Diluted Weighted Average Shares | m | ||||||||
| Book Value ps | |||||||||
Other Ratios
| Leverage (ttm) | Total | - Intang | + Pension |
|---|---|---|---|
| Gross Gearing | |||
| Net Gearing | |||
| Cash / Assets |
| Liquidity (ttm) | |
|---|---|
| Curr. Ratio | |
| Quick Ratio | |
| Interest Cov. | |
| Efficiency (ttm) | |
|---|---|
| Asset Turnover | |
| Recs Turnover | |
| Stock Turnover | |
Recent History
| Latest interim period vs. prior period | Industry | Market | |
|---|---|---|---|
| Sales Growth | |||
| EPS Growth | |||
| 3yr Compound Annual Growth Rate | Industry | Market | |
|---|---|---|---|
| Sales CAGR | |||
| EPS CAGR | |||
| DPS CAGR | |||



Profile Summary
Toell Co., Ltd. is a Japan-based company mainly engaged in the liquefied petroleum gas business and water business. The Liquefied Petroleum (LP) Gas segment is engaged in the retail and wholesale of LP gas and LP gas-related equipment, the related management and the provision of home services to its customers. The Water segment is engaged in the purchase and sale of water from Hawaii, as well as the manufacture and sale of domestic pure water.
Directors

- Address
- 1-5-21, Takata-Nishi,, YOKOHAMA-SHI, 223-8510
- Web
- https://www.toell.co.jp
- Phone
- +81 null455927777
- Auditors
- A & A Partners Audit
Latest News for 3361
Upcoming Events for 3361
Dividend For 3361.T - 23.0000 JPY
Similar to 3361
BP Castrol KK
 Tokyo Stock Exchange
CAPITA
Tokyo Stock Exchange
COSMO ENERGY HOLDINGS
Tokyo Stock Exchange
Daimaru Enawin
Tokyo Stock Exchange
ENEOS Holdings
Tokyo Stock Exchange
FAQ
As of Today at 22:47 UTC, shares in Toell are trading at ¥895. This share price information is delayed by 15 minutes.
Shares in Toell last closed at ¥895 and the price had moved by +10.49% over the past 365 days. In terms of relative price strength the Toell share price has underperformed the Nikkei 225 Index by -2.11% over the past year.
There is no consensus recommendation for this security.
Find out moreThe Toell dividend yield is 2.57% based on the trailing twelve month period.
Last year, Toell paid a total dividend of ¥23, and it currently has a trailing dividend yield of 2.57%. We do not have any data on when Toell is to next pay dividends.
We do not have data on when Toell is to next pay dividends. The historic dividend yield on Toell shares is currently 2.57%.
To buy shares in Toell you'll need a share-dealing account with an online or offline stock broker. Once you have opened your account and transferred funds into it, you'll be able to search and select shares to buy and sell. You can use Stockopedia’s share research software to help you find the the kinds of shares that suit your investment strategy and objectives.
As of the previous close price of ¥895, shares in Toell had a market capitalisation of ¥17bn.
Here are the trading details for Toell:
- Country of listing: Japan
- Exchange: TYO
- Ticker Symbol: 3361
Based on an overall assessment of its quality, value and momentum Toell is currently classified as a Super Stock. The classification is based on a composite score that examines a wide range of fundamental and technical measures. Stock are classified on the the following spectrum: Super Stocks, High Flyers, Contrarians, Turnarounds, Neutral, Value Traps, Momentum Traps, Falling Stars, and Sucker Stocks. For more information, learn about our StockRank Styles.
We could not find analyst target price data for this security.
Find out moreAn important predictor of whether a stock price will go up is its track record of momentum. Price trends tend to persist, so it's worth looking at them when it comes to a share like Toell. Over the past six months, its share price has outperformed the Nikkei 225 Index by +13.63%.
As of the last closing price of ¥895, shares in Toell were trading +0.78% higher than their 200 day moving average. You can read more about the power of momentum in assessing share price movements on Stockopedia.
The Toell PE ratio based on its reported earnings over the past 12 months is null. The shares last closed at ¥895.
The PE ratio (or price-to-earnings ratio) is the one of the most popular valuation measures used by stock market investors. It is calculated by dividing a company's price per share by its earnings per share.
The PE ratio can be seen as being expressed in years, in the sense that it shows the number of years of earnings which would be required to pay back the purchase price, ignoring inflation. So in general terms, the higher the PE, the more expensive the stock is.
Toell's management team is headed by:
- Michi Nakata - CHM
- Masaya Inanaga - DRC
- Koji Yokota - PRE
- Yoshikazu Murokoshi - SMD
- Akira Shikichi - SMD
- Narutoshi Shibuya - MDR
- Satsuki Taniguchi - IND
- Makoto Goto - VPR
- Kodo Makino - EXO
- Naoto Katsumi - DSL
- Tsuneo Sasaki - DSL
- Masamichi Hagiwara - DHR
- Tsuneyuki Kato - IND