New Year NAPS - Top Stocks for 2018 and the Benefits of Ignorance

2017 has been a good year for stock market investors, but it’s been a great one for NAPS investors. Over the course of 2017 this remarkably effortless stock selection system (that I’m now calling the “no-admin-portfolio-system”) returned over 45% after dividends, beating the performance of 99.8% of 3295 professionally managed funds in the UK.
What’s more this was achieved in less than an hour’s work at the beginning of the year, with absolutely no research into any of the individual stocks in question.
So, I’m going to start the year with a review of the NAPS performance over the last 12 months before considering the difference between ignorance and stupidity.
Once I’ve convinced myself (again) that it’s absolutely fine to know almost nothing about the individual stocks I’m selecting, I’ll then publish the 20 stocks that have made it into the 2018 NAPS Portfolio.
And then I’ll sleep on it for another year.
2017 Performance in Context
I’ve been running the NAPS portfolio since the end of 2014, and the performance has been, you might say, more than satisfactory. The portfolio has more than doubled (+115% before dividends) in these three years, with an average 29% annualised return.
Over this time period, the FTSE All Share has returned about 18.8% before dividends - at an average annualised return of 5.9%. So the NAPS has devoured the performance of FTSE index tracker funds by more than 20% per year since inception, and it’s done this at considerably lower volatility.
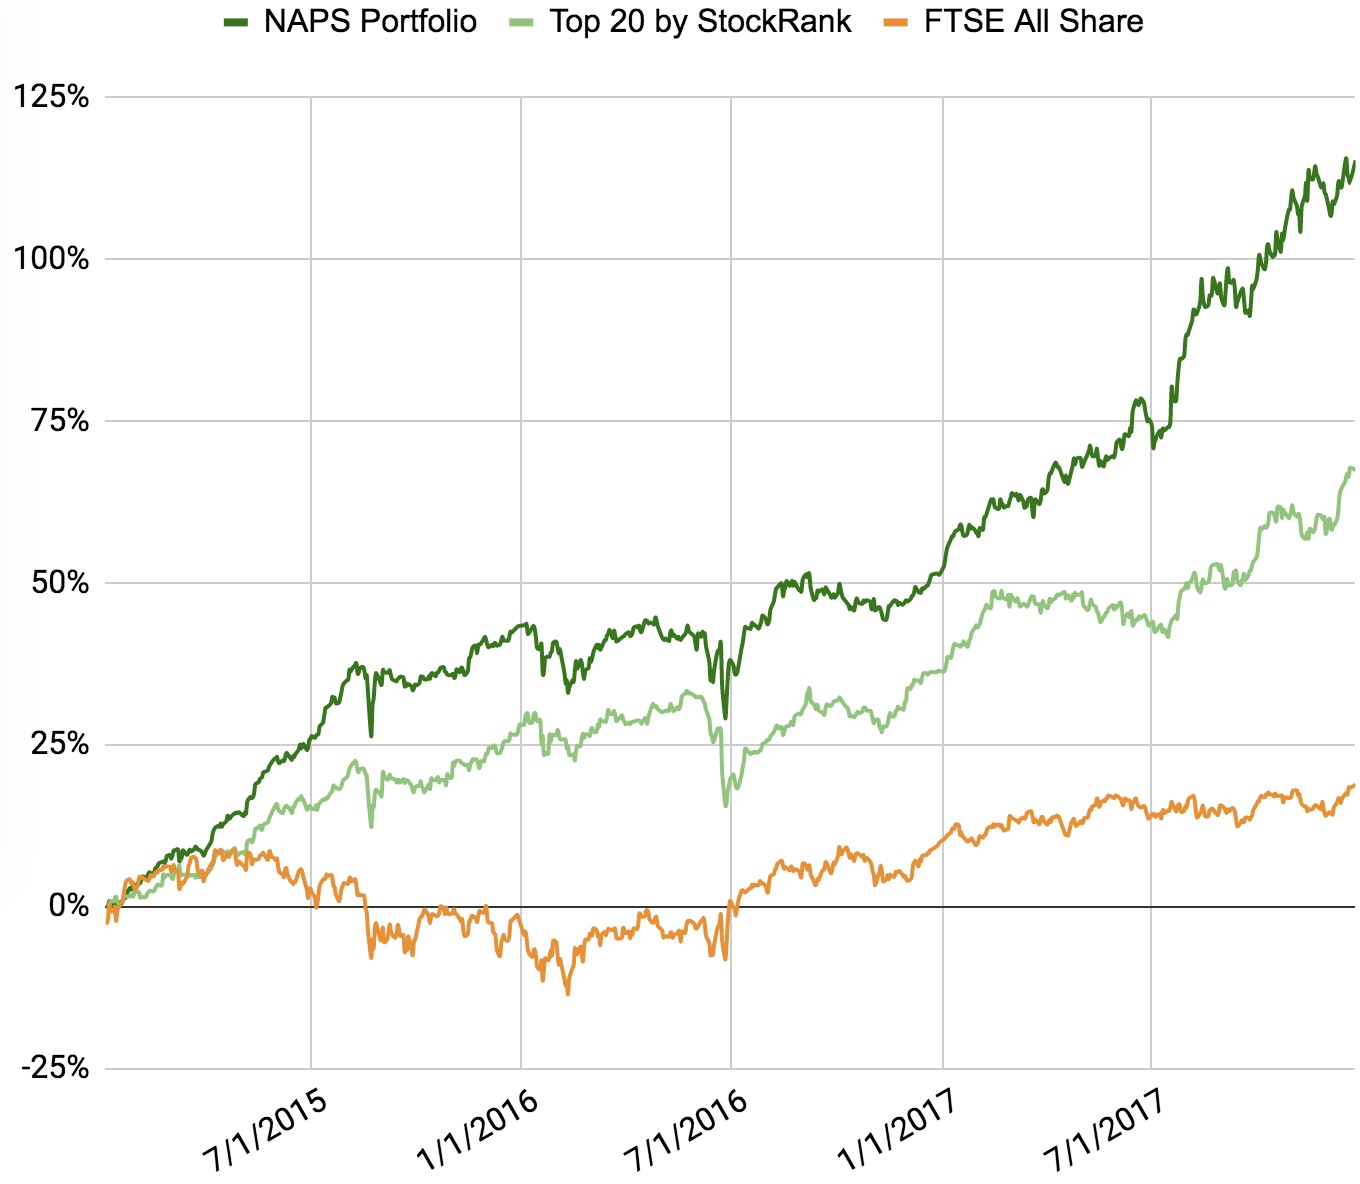
2017 has been the best year of the three years so far with 42.5% growth before dividends. The chart above contains three lines which are clearly labelled:
- The dark green line is the 20 stock NAPS Portfolio (top two stocks by StockRank from each sector rebalanced annually).
- The light green line is the performance of the top 20 stocks by StockRank (no diversification, rebalanced annually).
- The orange line is the FTSE All Share.
Although it’s a small sample, I do believe the above charts provide validation of the core ideas behind the NAPS - namely:
- Factor investing can beat the market. (The green lines, based upon the StockRanks, dominate the market index).
- Diversification across sectors can further improve returns, and reduce risk. (The dark green line beats the light green line).
The NAPS Portfolio’s growth in 2017 was driven in particular by the performance of 2 stocks: IQE and Games Workshop. Both stocks returned more than 260% over the year… which means they have both almost quadrupled. I was very pleased to see that more subscribers named these two stocks as their biggest winners in our 2017 Subscriber Performance Survey than any other.
What I love about the stock market is that you can invest in companies that most people think are just absolutely plain daft, and still make blinding profits. Games Workshop customers spend their evenings painting miniature figurines of trolls and orcs - and that curious activity has helped us quadruple our money. Niche markets can indeed make great investments.
Here’s the complete breakdown of 2017’s NAPS winners and losers:
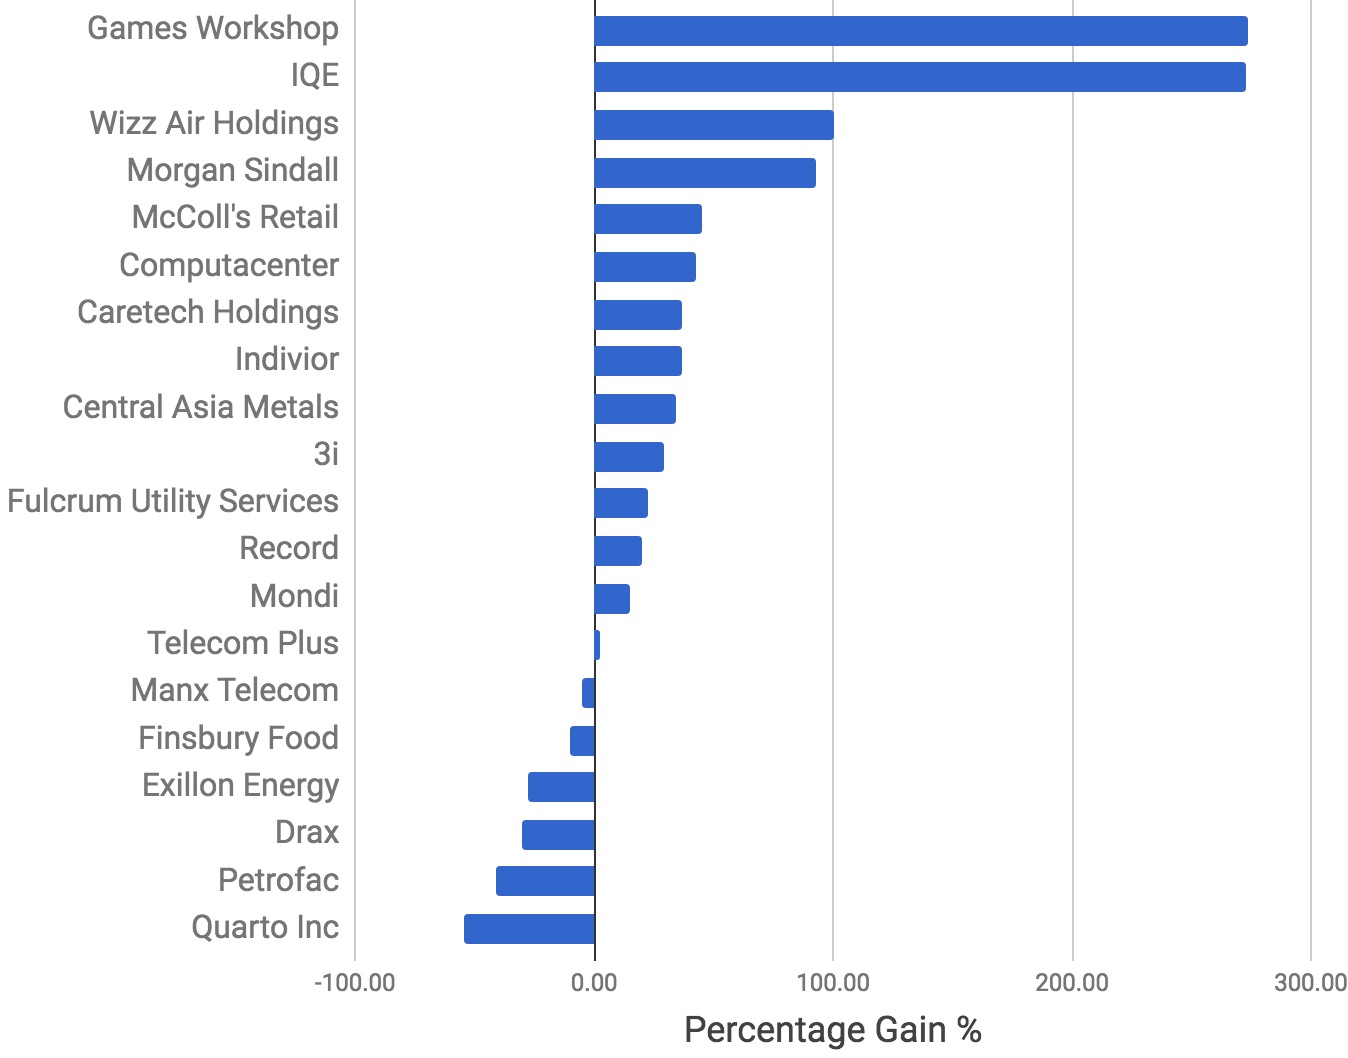
This year we had 14 winners and 6 losers - a 70% hit rate. Other notable performers included Wizz Air and Morgan Sindall which both roughly doubled. Amongst the losers were: Petrofac (probably pronounced Petro-faaaaac on the day of its profit warning), Quarto (about how much money you have left after investing in it) and Drax (which the dictionary defines as “an expression used when you are slightly annoyed”).
It’s a game of odds…
It’s important to reiterate that just as no batsman is going to hit every ball for six, no stock selection system will ever reach 100% accuracy. It’s the batting average that matters.
Stock picking can be such a torturous game as there’s an implicit assumption that if you put the effort in to pick an individual stock - you have to be right. But we live in a world of shape-shifting markets and imperfect information… certainty is impossible.
The NAPS theory is that an equal weighted, diversified portfolio of 20 good (quality), cheap (value), improving (momentum) stocks should beat the market - on average.
Dealing in averages relieves me of the burden of being right. I couldn’t care two hoots how the individual names react over the year, as long as they perform well in aggregate.
And this approach has been working. After 3 years, there have been an average 72% winners picked annually (returning an average 49% each), and 28% losers (losing an average 20% each).
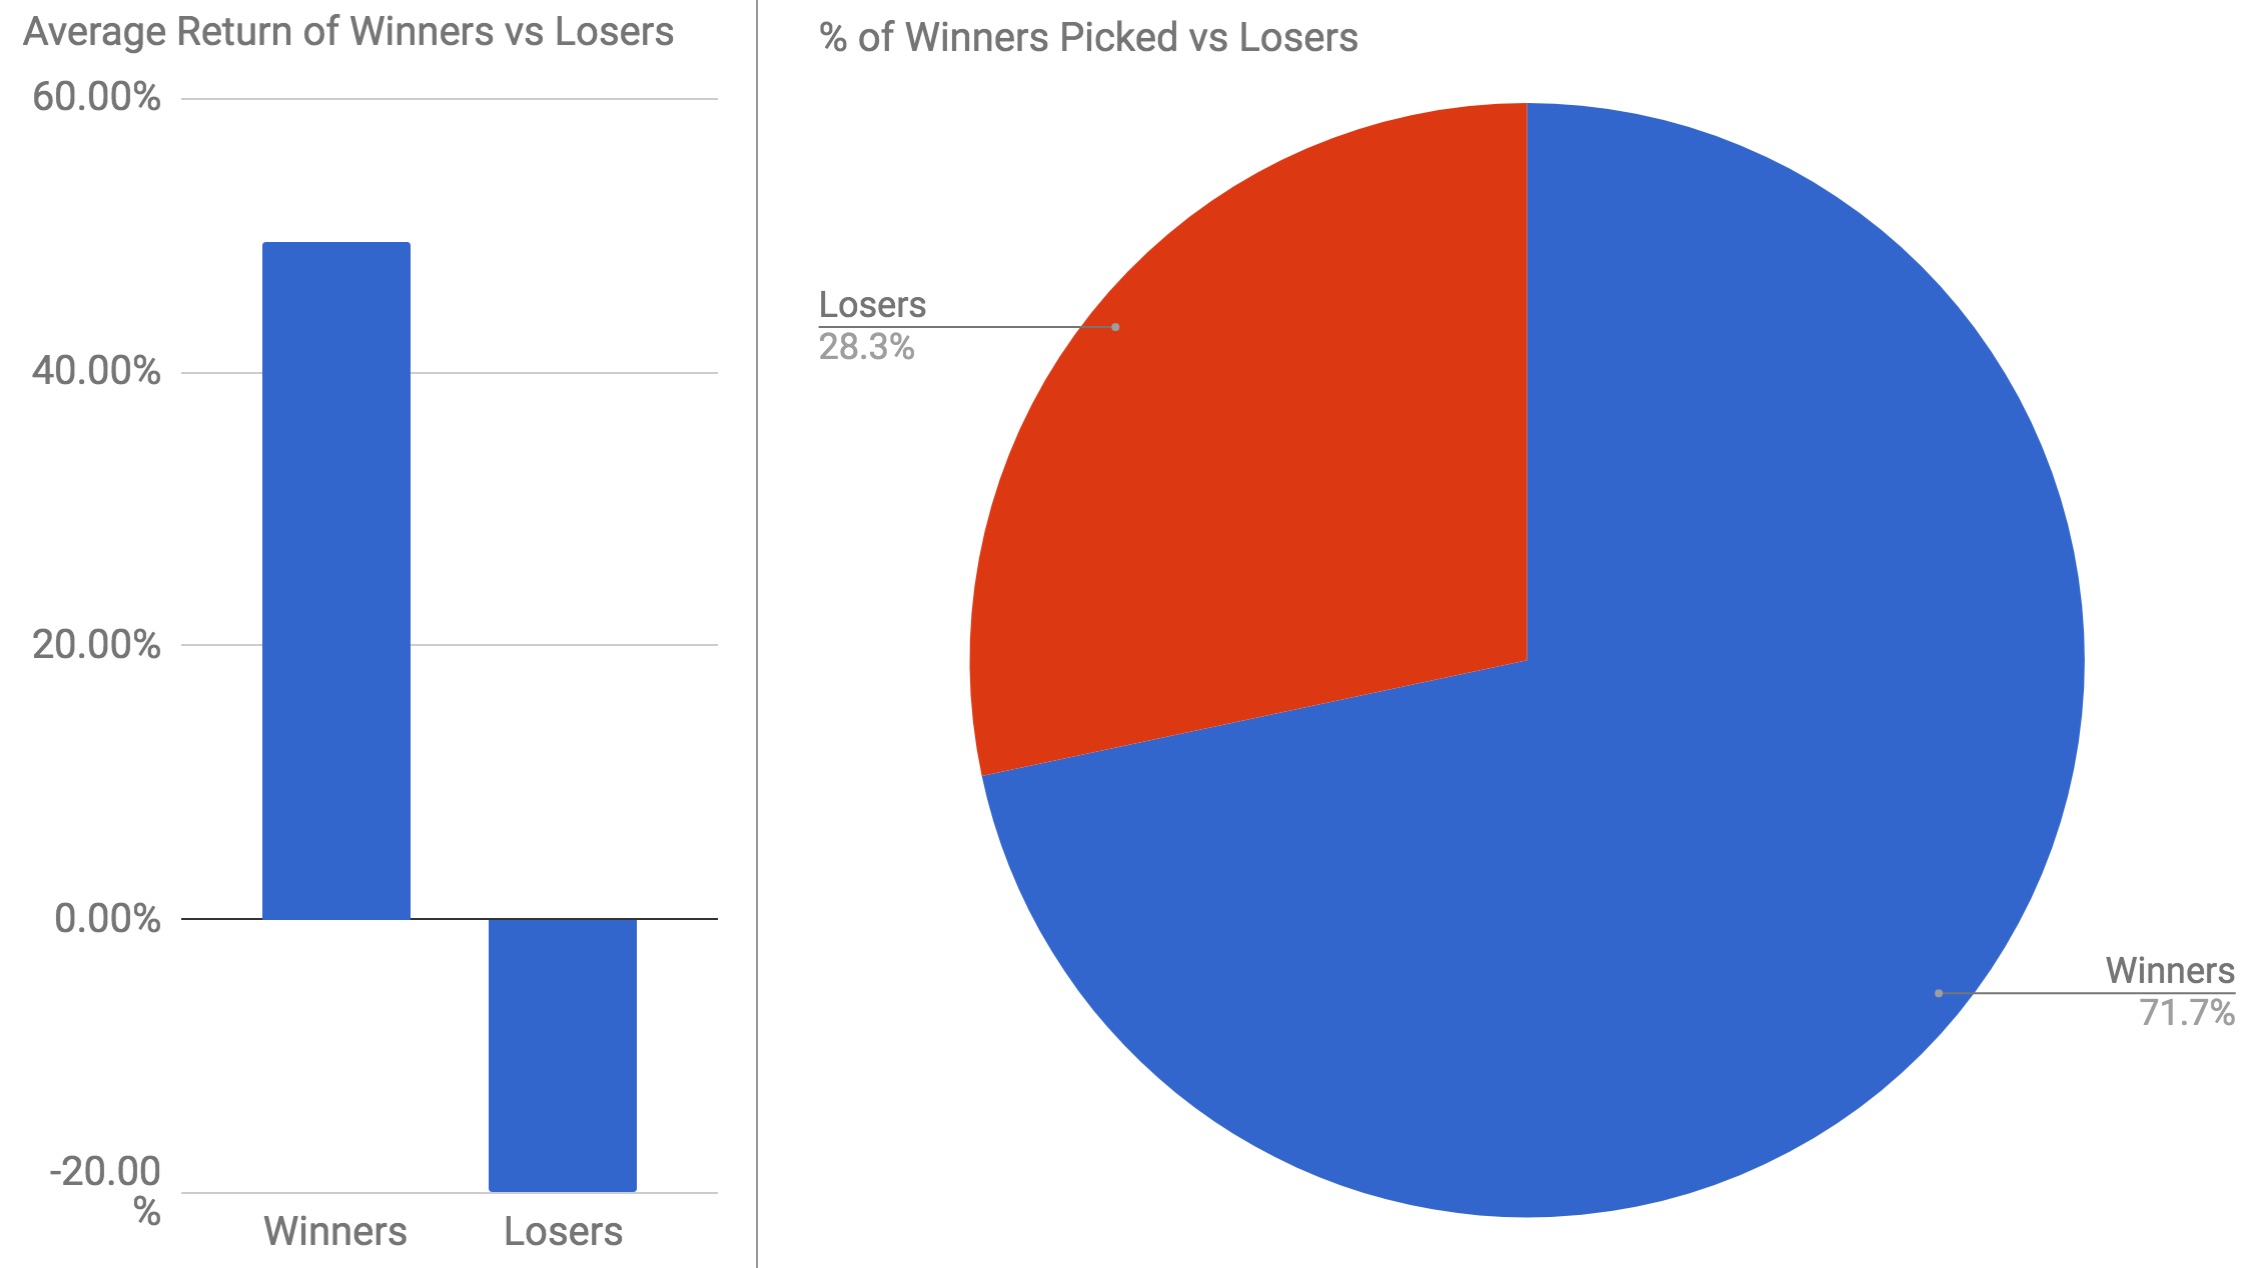
A note of caution: I have absolute certainty that these numbers will not remain this high over the long term. Markets will not always be as kind as the last three years. I’ve invested through 2 of the worst bear markets in history (2000-2002 and 2007-2009) and while I hope they won’t be repeated, I know hard times will come again.
Diversification pays off again
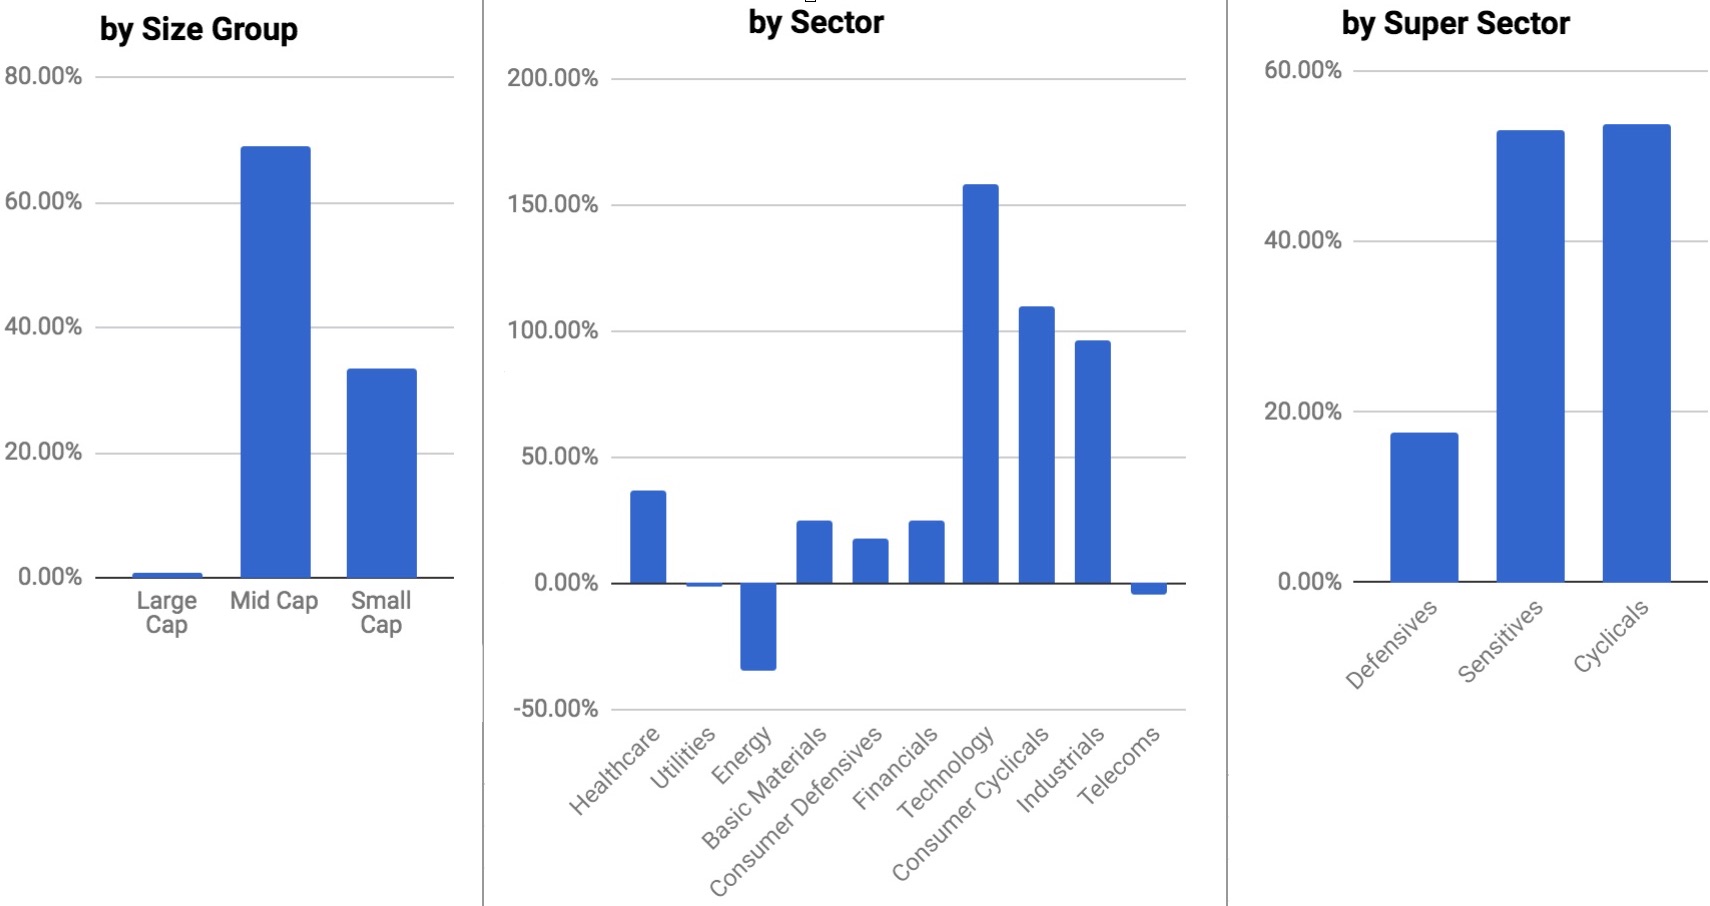
In previous years the small caps (2015) and large caps (2016) have dominated returns, but in 2017 it was the turn of the mid caps to drive the NAPS outperformance. This size diversification is by design.
Most private investors focus on small caps as they believe ‘elephants don’t gallop’ - but I’m not so confident of this. Different market segments come into vogue at different times, and often when we least expect. If you have a look at US markets, it’s been the mega-cap FAANG stocks (Facebook, Amazon, Apple, Netflix, Google) that have driven most returns rather than small caps.
I want the NAPS to be an all-weather portfolio, and not to have to worry about timing exposures. I want to diversify and be done with it, so spreading the portfolio across small, mid and large caps is prudent and is proving effective.
From a sector perspective, perhaps unsurprisingly, the strong performance has been driven by the sensitive/cyclical sectors rather than the defensives. I would expect the defensive, lower volatility part of the portfolio to come to the fore in a more bearish market environment.
Below are the size and sector diversification charts for 2017.
Ignorance vs Stupidity
“All you need in this life is ignorance and confidence, and success is sure.” Mark Twain
Some private investors have told me that investing in shares without doing individual stock analysis is a rather dumb idea.
I happen to think the opposite.
I believe it’s much more dumb to do huge amounts of analysis on individual shares when you own a large number of shares.
Yes, it makes a lot of sense to do forensic research on individual companies if you own only a few of them. If you run a highly concentrated portfolio, or if you run your own company you absolutely have to do masses of research to invest with conviction.
But in a diversified portfolio of 15+ stocks… the idiosyncrasies of each individual stock pick end up cancelling each other out. One zigs when another zags, and each has less and less overall impact. What ends up mattering is the overall exposure of the portfolio to certain driving factors.
Carhart in his 1997 research paper "On Persistence in Mutual Fund Performance" showed that the fund managers that most outperformed over the long term were those whose portfolios were most consistently exposed to a set of factors which included value & momentum. The individual stock picks mattered far less.

And this means the vast majority of the Active Fund Management industry may indeed be working incredibly hard in a whole host of pointless, expensive activities. James Montier called many of these activities the “Seven Sins of Fund Management” - including such time-wasters as information gathering, meeting the management, forecasting, thinking you can outsmart everyone else, groupthink & believing too much in fairy tales.
This is not to say that some active fund managers can’t add value. It’s just that the majority of them, and the majority of their activities don’t. There is much evidence that in uncertain markets, knowing more than about 5 pieces of information on a stock doesn’t lead to better decision making. It just leads to overconfidence. Picking the right 5 pieces of information to use is the key.
I agree with Montier that the fund management industry will end up restructuring itself to be more like the distribution of beasts on the plains of Africa - with 80% herbivores (passive/systematic funds) and 20% carnivores (active funds). As more than 70% of funds under management are currently actively managed, the industry has a long road of disruption ahead of it!
So the NAPS Portfolio is an approach that is purposefully ignorant of its individual stock selections while retaining a confident focus on what the science shows really matters - a few key pieces of information … exposure to quality, value, momentum plus a dose of diversification. It therefore stands very much against almost all conventional wisdom on ‘what it takes’ to succeed in portfolio management…. which may ironically be why it’s been succeeding.
Of course there’s no guarantee that the NAPS will continue to succeed. Past performance is not a guarantee of future results… and factor investing has been more and more in fashion. And when things come into fashion, they do go out of fashion - which means (in stock markets) that you lose money… or underperform. Everyone be warned.
If ignorance is bliss, Father said, shouldn’t you be looking blissful? You should check to see if you have the right kind of ignorance. If you’re not getting the benefits that most people get from acting stupid, then you should go back to what you always were - being too smart for your own good. Hal Sirowitz
The 2018 NAPS Portfolio
The rules to compile the NAPS portfolio have been changing over time. Originally I just selected the top 2 stocks from each sector by StockRank, excluding the small and hard to trade. But in 2016 I introduced some size group diversification to ensure it wasn’t just full of small caps. And in 2017 we launched the RiskRatings which analyse the volatility of each share on a scale from conservative to highly speculative. In 2018, I’m relaxing the sector rules to incorporate more diversification across Risk Ratings.
I’ve always said that these methods are a jazz sheet to riff on, not a prescription. Some readers use different rankings (QM Rank / High Flyers), some filter additionally for Quality or Yield, others use Stop Losses. It’s the principles that matter, rather than the specifics. Ultimately we are all DIY investors, and we all live and die by our own decisions.
So my rules for 2018 are as follows:
Sort by
- The StockRank - our overall measure of Quality, Value and Momentum.
Sector Diversification
- At least 1 from each sector, no more than 3.
- No more than 1 from each industry group.
Size Diversification
- A third in each size group - small, mid and large.
- A minimum of £25m Market Cap.
- Less than a 5% bid-ask spread.
Risk Diversification
- 50% Conservative/Balanced and 50% Adventurous/Speculative.
- No Highly Speculative shares.
Running these rules systematically across the UK universe of stocks creates the list of shares published below. Here’s the diversity breakdown:
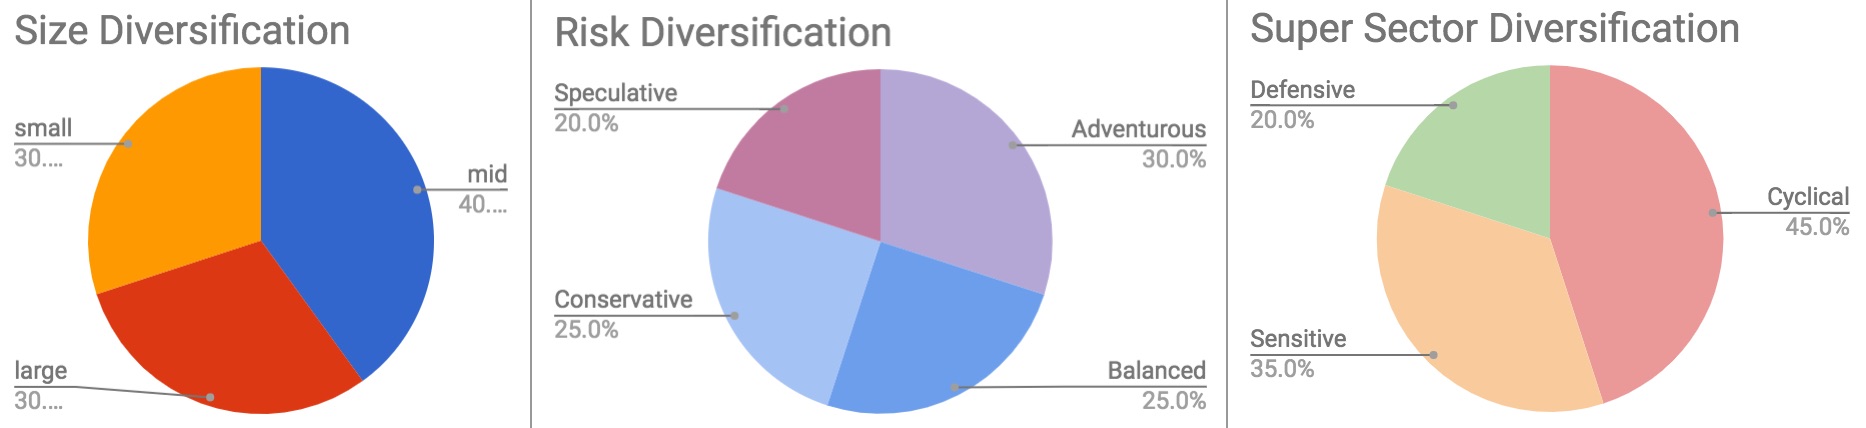
The one thing I’m uncomfortable with this year is the lower weighting of “Defensives” (Utilities, Healthcare and Consumer Defensives), but I’m going to trust in the higher weighting of Conservative & Balanced shares doing their job of providing a bit of spine in a downswing.
And to protect my ignorance, I’ve passed the list over to Ben Hobson’s pen and Alex Naaamani’s research to compile the write ups. Thanks to them for the resulting briefs which are set out below.
Safe Investing in 2018 - and remember DYOR!
Ed
PS - Please do add your comments below.
PPS - I've bundled my previous NAPS articles together in a column here.
Consumer Cyclicals
SCS
Speculative, Small Cap, Super Stock - Specialty Retailers.
Market Cap: £83 million, StockRank: 100
Furniture and flooring chain SCS floated in January 2015, six years after emerging from administration. Its reliance on discretionary consumer spending mean it's prone to the occasional profit warning. But in strong economic times it should do well, which it has done over the past year. Shares in SCS have been strong since last autumn but like many unpredictable cyclicals they remain modestly priced. SCS is very cash generative, which should provide at least some protection against any bumps down the road. A chunky 7.2 percent forecast dividend yield is eye-catching but also a nod to the market's love/hate relationship with the stock. SCS was last seen in the 2016 SNAPS portfolio.
Company statement: In a Q1 update in November 2017, the SCS management said the "group continues to trade in line with our expectations".
Taylor Wimpey
Adventurous, Large Cap, Super Stock - Homebuilding & Construction Supplies.
Market Cap: £6.7 billion, StockRank: 99.
Housebuilders are like marmite at the moment. In their favour, government policy has underpinned new home buying, which has caused stock prices to surge in recent years. But there's a sense that policy could easily change any time, which would likely spell a rush for the exit. But in the meantime, Taylor Wimpey trades on a single-digit earnings multiple despite being fabulously profitable and offers a 7.3 percent forecast yield.
Company statement: "Looking ahead, we are on track to meet our full year expectations and deliver further growth and performance improvement in 2018."
Bloomsbury Publishing
Conservative, Small Cap, Super Stock in Media & Publishing.
Market Cap: £142 million, StockRank: 99.
In 2017, the book publisher Quarto made the NAPS list (unfortunately), but this year it's another publisher - Bloomsbury - that makes the cut. Bloomsbury has long been a high-ranking StockRank share. Famous for publishing the Harry Potter series, the company reported last October that sales of J.K. Rowling's titles still sell very well. Shares in the company soared to new highs after that, with analysts upping their earnings forecasts. That renewed momentum means Bloomsbury ranks well across the board.
Company statement: "The group is trading in line with the board's expectations for the full year."
Basic Materials
Griffin Mining
Speculative, Small Cap, Super Stock - Metals & Mining.
Market Cap: £198 million, StockRank: 99,
Despite being a specialist sector with its own set of investment criteria, the NAPS has a good record with mining stocks (we had a gain of around 30 percent in Central Asia Metals in 2017). For the new year, Griffin Mining joins the folio. On first sight, a majority stake in a Chinese zinc, gold, copper and lead mine might sound a touch too exotic. But there are some big plus points. Profitability soared last year on rising metals prices and the board is an experienced group hailing from Australia, the UK, Canada and US. Shares in the company rose sharply in December after the company repaid all its debt.
Company statement: "I am sure shareholders, in conjunction with management, derive enormous satisfaction from the outstanding results for the first half of the 2017 financial year... we fully expect, all things being equal, an equally as impressive second half of the year."
RPC
Balanced, Large Cap, Super Stock - Containers & Packaging
Market Cap: £3.6 billion, StockRank: 93.
RPC designs and engineers a wide range of plastic products. Its shares have been on a strong run over the past seven years and it would be a stretch to say it looks cheap, with a ValueRank of 56. Yet the recent growth rate for a company of already significant size is impressive. EPS grew by 34 percent in 2017, and it's forecast to grow by the same rate again in 2018. That's been helped by acquisitions and the weaker pound supercharging RPC's international revenues. One issue to watch is that net debt has more than doubled to £1.1bn in the past two years, largely as a result of those acquisitions.
Company statement: "Trading was encouraging in the first half with record profitability levels and strong cash generation."
Forterra
Adventurous, Mid Cap, Style Neutral - Construction Materials
Market Cap: £597.8 million, StockRank: 94, Risk/Style:
In a previous life Forterra was the UK building products division of Hanson, which was bought by HeidelbergCement in March 2015. The division was later sold, rebranded as Forterra and then floated in 2016. Since then the shares have notched up a 65 percent gain, reflecting strong demand for its bricks, blocks and various other masonry products. Its customers range from major housebuilders and contractors to builders merchants. There is no doubt that Forterra is a cyclical play, but in the current conditions it very much fits the profile of a high quality, high momentum stock.
Company statement: "Trading in the period has continued to be underpinned by good activity levels in the new build residential sector, resulting in double digit growth of brick and aggregate block volumes for the ten months to October 2017 compared with the same period last year."
Industrials
Morgan Sindall
Balanced Mid Cap Super Stock - Construction & Engineering
Market Cap: £638million, StockRank: 99
Morgan Sindall generated an impressive 90 percent return for the NAPS in 2017, and retains its place in the folio for 2018. Concerns about the outlook for this construction group after the EU referendum were blown away last year. Admittedly, it's a low margin business but profitability is growing, cash is stable and it's debt free. Brokers have been chasing their forecasts higher over the past 12 months, in line with the rising share price. But while the momentum has been relentless, Morgan Sindall's potential to suffer in a downturn mean that its shares are on an undemanding multiple.
Company statement: "The group is on track to deliver a full year performance slightly ahead of its previous expectations."
Ocean Wilsons Holdings
Conservative Mid Cap Super Stock - Transport Infrastructure
Market Cap: £385 million, StockRank: 98
Technically, Ocean Wilsons is an investment company with two main subsidiaries. The first is a 58.25 percent stake in Wilson Sons, which is a quoted firm that runs maritime and logistics services in Brazil. The second is Ocean Wilsons Investments, which has an unconstrained public and private equity portfolio roughly worth US$270 million. While the group is consistently profitable, there are uncertainties here, and the maritime business in undoubtedly vulnerable to the performance of the Brazilian economy and the oil & gas sector.
SThree
Adventurous Mid Cap Super Stock - Professional & Commercial Services
Market Cap: £478 million, StockRank: 99
SThree is a recruiter specialising in science, technology, engineering and maths. Unlike some firms in this sector, the group has broad international exposure which has proved to be a massive bonus over the past year, with its US and European divisions performing well. Earnings surprises have been driving up the price momentum in SThree's shares over the past year, although they're now notably more expensive than they were last summer. Graham Neary liked what he saw in SThree's interim results here.
Company statement: "Adjusted profit before tax for the year expected to be slightly ahead of current market consensus."
Financials
LSL Property Services
Adventurous Small Cap Super Stock - Real Estate Operations
Market Cap: £287 million, StockRank: 99
In a year when low-fee online property agents dominated the headlines, it's a more traditional property services business that makes the 2018 NAPS. LSL is based in Newcastle and deals with sales, lettings, surveying, conveyancing, mortgages and insurance. Earnings forecasts drifted higher through 2017 and a trading update in late November pushed the shares to new highs. This is a fast growing, increasingly profitable business where return on capital and margins have consistently improved in recent years.
Company statement: "The board anticipates the full year 2017 group underlying operating profit will be marginally ahead of its prior expectations...With continued uncertainty over UK economic conditions and the UK and global political environment, we continue to remain cautious on the market outlook for 2018."
Plus500
Speculative Mid Cap Super Stock - Investment Banking & Investment Services
Market Cap: £1035 million, StockRank: 98, Risk/Style:
Plus500 is one of those stocks that divides opinion like no other. The Israel-based financial trading firm was on the ropes back in May 2015. Back then the FCA forced its UK arm to stop trading for a time as new anti-money laundering measures while brought in - but it bounced back. As recently as December, regulators have continued to tighten the rules in this industry, but Plus500 seems to have implemented enough measures to avoid most of the problems. It's an incredibly profitable business, beating forecasts and throwing off cash. A forecast yield of 7.6 percent and P/E of just under 8x tell you everything you need to know about the uncertainty the market feels about it.
Company statement: "Plus500 is pleased to report a record quarter and the Board now believes that the Company is ahead of market expectations for the year as a whole."
Volvere
Balanced Micro Cap Style Neutral - Holding Companies
Market Cap: £30.3 million, StockRank: 83
Volvere is an investment company that buys majority stakes in undervalued and/or distressed businesses and endeavours to fix them. Currently, its holdings span security solutions, food manufacturing and automotive consultancy. Shares in the group rose in by more than 65 percent in 2017 and the latest interim figures show that its portfolio companies are trading in line with expectations or, in the case of the consultancy firm Impetus Automotive, trading very strongly. This is a favourite of Graham Neary, who covered the stock in September 2017.
Company statement: “I'm delighted to report a solid set of results for the first half of 2017. We look forward to continuing progress in the remainder of 2017… Volvere and its team are strong and we are well placed to capitalise on further opportunities as they arise.”
Technology
Sanderson
Adventurous Micro Cap Super Stock - Software & IT Services
Market Cap: $48.2 million , StockRank: 98, Risk/Style:
Throughout last summer and as recently as November, we were rating Sanderson as a Contrarian stock. It had the hallmarks of a well-priced, good quality share, but its momentum was depressed. That changed in December, and a big hike in analyst forecasts saw the price momentum surge, taking this into Super Stock territory. Sanderson makes software and technology systems for shops and back-end sales fulfillment for online retailers. It's a small firm, which makes it prone to wobbles, and growth has been steady rather than spectacular, but there are signs that it's accelerating.
Company statement: "Strong trading momentum maintained; further profitable growth."
Vitec
Conservative, Mid Cap High Flyer - Computers, Phones & Household Electronics
Market Cap: £508 million, StockRank: 95
Based on the StockRanks Styles, Vitec is a High Flyer, which means that its appealing quality and momentum may come at a price. And with a ValueRank of 45, that looks to be the case. Vitec makes and sells products for the photography market - ranging from software to stands, robotics, lights and bags. Among the positives, earnings have been rising consistently in recent years, cash levels are growing, the dividend is increasing and debt is falling. This looks like a business that is improving and the market is clearly recognising it.
Company statement: "Trading for the four months ended 31 October 2017 was in line with our expectations."
Consumer Defensives
Tate & Lyle
Balanced, Large Cap, Super Stock - Food & Tobacco
Market Cap: £3.26 billion, StockRank: 98
Tate & Lyle used to be known for its sugar, but these days it's a specialist in making ingredients like sweeteners and starches for healthier foods and drinks. Operationally, it has been a rough few years for the business, but the latest results suggest that things are starting to go its way. Analysts have ratcheted up their forecasts in recent months and the quality features of the business look appealing.
Company statement: "We expect underlying adjusted profit before tax in constant currency for the full year to be modestly higher than we anticipated coming into the year driven by the strong first half performance."
Stock Spirits
Adventurous Mid Cap Super Stock - Beverages,
Market Cap: £537.0 million, StockRank: 97, Risk/Style:
Stock Spirits makes and sells branded spirits in central and eastern Europe. It's had a pretty unremarkable time on the stock market since it floated in September 2013, but things may be changing. As recently as the summer of 2017 it was a Style Neutral stock. But an update last August suggested that the business was not only stabilising, but it was also increasingly profitable. It's Quality and Momentum ranking soared on the news, as did its share price. Those shares are now much more expensive than they were, but the signs are that they could be worth it.
Company statement: "While our core markets remain competitive, we believe that our strategy of further developing our existing brand portfolio whilst continuing to invest in markets and categories with strong potential leaves us well placed to continue delivering long-term and sustainable growth."
Energy
BP
Balanced Large Cap Super Stock - Oil & Gas
Market Cap: £103 billion, StockRank: 95
Exillon Energy and Petrofac both ended up losing money in the 2017 NAPS folio. This year the lead contender is the industry giant, BP. It's a stock where analysts have been cutting earnings forecasts recently, but a steadily rising oil price since the summer has helped to breathe life into its share price. BP is prized for its 5 percent-plus dividend yield but its price is still some way off the boom years of the mid-2000s.
Company statement: "Looking ahead, we expect fourth-quarter reported production to be higher than the third quarter reflecting the continued ramp-up of major projects and recovery from seasonal turnaround and maintenance activities."
Healthcare
Indivior
Speculative Large Cap Super Stock - Pharmaceuticals
Market Cap: £2.95 billion, StockRank: 95, Risk/Style:
Indivior is one of the longest running holdings in the NAPS portfolio and it snatched triumph from the jaws of defeat in 2017. Uncertainty over its reliance on a single product ended in a massive crash last year when ongoing patent litigation with Dr Reddy's went against it. Yet Indivior is fighting on by appealing the result. Meanwhile its business continues to show strong quality characteristics and the price has recovered well. It seems likely the company will always be in some kind of legal fight, but while it can protect its brand it's proving to be an appealing investment.
Company statement: "Continued solid execution in the quarter against a strong US market backdrop leaves us on track to meet our FY 2017 guidance, which we increased significantly with our H1 2017 results."
Telecoms
Vodafone
Conservative Large Cap Turnaround - Telecommunications Services
Market Cap: £62.6 billion, StockRank: 90
Below average quality features combined with a reasonable valuation and strong momentum put Vodafone firmly in the Turnaround style category. This telecom giant has posted a loss over the past two years but forecasts suggest that will reverse in 2018. In fact, EPS forecasts have been rising in recent months. There are undoubtedly areas of concern so we're relying on the signs of improvement to carry this investment in 2018.
Company statement: "We are able to report a strong financial performance, with substantial EBITDA margin expansion and profit growth, and we are raising our financial outlook for the year."
Utilities
Jersey Electricity
Conservative Small Cap Super Stock - Electric Utilities & IPPs
Market Cap: £143.5 million, StockRank: 85, Risk/Style:
Jersey Electricity first entered the NAPS portfolio in 2015 and has only missed out since because of stricter size diversification rules. It’s back for 2018 after a year that saw a reasonable 13 percent gain in its shares. The company is the sole supplier of over a third of Jersey's energy requirements. Despite its relatively small size in the utilities sector, it has a track record of consistent financial performance, with earnings and dividends both growing over several years (albeit at a pedestrian pace).
Company statement: “I am delighted to report another excellent performance from Jersey Electricity for 2016/17... Overall, this has led to the group's best ever financial performance, an outcome that is good for all stakeholders, for our ongoing investment programme and for a sustainable electricity service.”
Disclaimer
This is not financial advice. Our content is intended to be used and must be used for information and education purposes only. Please read our disclaimer and terms and conditions to understand our obligations.
297 comments
I was asked the other month to post the individual dividends per share (which I had to hand) and I now do so, to complete the 2018 NAPS.
In doing so, as I posted previously above, I discovered an error.
PLUS dividends (paid in USD) had the decimal point incorrectly displayed - thus grossly undervaluing their contribution. Astonishingly the total dividends are not as I posted of £3.5k but now stand at £4,687 for the full year! (4.6% yield based on the original investment of Jan 2ns 2018)
Which means the capital loss remains as posted as still showing x13.5% down, but when the corrected dividends are taken into account, instead of previously posting of an overall inclusive loss of x10% down, the adjusted dividends now reduce further to x8.8% down!
So it is a single figure % loss after all! I haven't deducted any 25% foregn tax nor the 1% currency HL conversion charge on any of the foreign paid dividends so roughly let's say circa x9% single figures down for the year ending.
I'll post the dividends per share at the foot of this post. I'm in no rush to delete the 'old' 2018 NAPS so if during the year anyone curiously asks how the 2018 NAPS is progressing now that it escapes review changes, I can easily take a glance and post the overall figure - but not the dividends, just the capital movement of the folio.
Dividends paid:
BMY £199
BP. £293
FORT £162
GFM nil
INDV £90
JEL £151
LSL £200
MGNS £166
OCN £237
PLUS £1194 !!!
RPC £161
SCS £367
SND £159
STCK £131
STHR £188
TATE £206
TW. £364
VLE nil
VOD £284
VTC £135
TOTAL £4,687 (4.6%)
ERROR!
Apologies - Was compiling the dividends for showing the payments per share when I noticed an oddity with PLUS.
Checked and yes I've entered the dividend for Plus as single pence instead of single pounds. It's paid in USD so had to convert to GBP and messed up the decimal point. It WILL make a significant difference to the dividends paid (more than I've shown) and will easily reduce the total year's result to a SINGLE figure % loss when dividends taken into account.
It's gone midnight already so want to go over and recheck tomorrow if possible, or Sat if I run out of time. The capital loss is as shown, but the dividends received is much larger than the £3.5k I've shown; hence end result of 2018 NAPS will be a single figure loss only. Will update in due course.
Thanks for your "No Spin" excellent analysis Velo - much appreciated.
Henry
Final Results for 12 months NAPS 2018 up to January 2nd 2019 -
Probably more than anyone else on this particular forum, I have viewed the NAPS 2018 weekly or more, since it's inception and my overriding opinion formed over that period is that of one of a complete "failure to launch". Not one single month did it inspire. A complete damp squib! The 12 months ending on Jan 2nd 2019 came in showing the worst ever of the year, a double percentage loss of x 13.5% capital loss ( x £13,539.09 down).
Dividends, when taken into account, came in @ £3.5k (£3,505.26) thus providing a 3.5% helping hand to the capital loss, for a moment I thought it might by just mere single pounds reduce it to x 9.9% loss, but no, it just missed it by a hair's breadth to reduce the loss to yet still a double figure "true loss" of a x10% loss - right on the nose.
Tsk! just another 0.1% down to 9.9% and it might have had a disproportionate effect on perceptions. (Actually ended up using £100,039.28 as the starting capital back in Jan 2018; you'll just have to forgive me for spending £39 more than budget, I liked the nice roundness look of it all and didn't want to start chopping 2 shares off here and there etc :)
So in a bull market (Stocko launched in 2012?) Stock ranks has proved what all should have been using as the stats show previous years NAPS all coming in with roughly 20%+ gains on average. Stocko has yet to be tested in a real live bear market. 2018 has not encouraged me to believe that stock ranks will produce gains in a bear market. 2019 will be important to dispel that feeling I have.
2 notable star UK fund managers have come in with impressive gains for 2018, so I just don't buy that a double figure loss is "acceptable" as something to be pleased about, just because it's a better "loss" that the FTSE indices, which are all down, worse than the NAPS 2018.
A pyrrhic victory if you like. Just a mere 1% gain would have convinced me to be more positive.
ie., Nick Train of Lindsall Train GLOBAL equities is up 140% over 5 years (comparable to stock ranks over 5 years) but as of Christmas week was UP 11% for the last 12 months! Obviously that's global and an unfair comparison.
The other UK fund manager Terry Smith is similar to stock ranks over the past 5 years for gains but has finished up 4% over the last 12 months. Again heavy exposure to US stocks; so suppose even though they're UK funds it's still not a fair comparison. But the point is all their past 5 years are comparable with Stock ranks achievement in the same time span - but NAPS 2018 failed and fell behind that comparison.
It's just that I shift uneasily when I'm presented with a double figure loss as a "win" and only a win when compared to the wider market.
Saying that, I will be renewing my subscription to Stocko next year as I can't find nor recommend anything better - just call me grumpy.
PS. The current guru leader screen for over 5 years, the Tiny Titans screen, shows a 3% increase for the last year, this last 12 months being it's lowest performance - but still a gain!
AND that's what I was expecting from the NAPS - 1% to 3% gain. But instead it's a double figure loss. Just don't ask me to get excited about that still being "better" than the indices :( Nobody ever remembers who came second; there's probably loads and loads round the world with a loss, saying 'at least I've beaten the market indices' - who cares when it's a loss?)
------------------------------
First table below shows increases/decreases:
Only 5 shares end the year with a gain. Five!
thus leaving 15 showing a red decrease since Jan 2nd 2018 start.
PLUS reduces that big gain from last month, but still impresses with a year end finish of 55% up.
INDV jealously guards it's bottom position by closing as the worst performer with a 72% loss! (Actually 3% better than last month; small mercies and all that).
But what really irks me about the 15 red "losers" is that an incredible 8 of those 15 - EIGHT! Sport a stock rank of OVER 90 - (ranging from 91 to 99) That to me sounds like a 'hole' in the system. They were chosen at the year beginning so you can't say they bloomed late in the year into the S/R 90's range. Repeat: 8 of those in the red are well over into the 90's Stock Ranks. The worst performing of the S/R 90's shares showing a 30% loss - GFM - (profit warning the culprit for the decrease).
PS. That S/R99 share that still ended as a red "loser" makes it into the 2019 NAPS ie., (SCS)
------------------------------
Second table shows the Stock Ranks in comparison to starting out on Jan 2nd 2018 -
STOCK RANKS:
12 shares remain showing a Stock Rank above SR90, compared to the year start - which had 18 commencing in the S/R 90's.
* 5 shares have increased their rating compared to the start of the year
* And same as last month, 15 shares continue to show a reduced Stock Rank ratings since the 2018 year start.
Highest S/R is 99 (3 of them)
Lowest SR is 42 (VOD, a slight improvement on last month's showing).
VLE still continues to show the largest single improvement in S/R ratings by increasing 14 points from it's Jan 2nd 2018, starting point.
Interestingly, the worst performing share showing a loss of 72% (INDV) doesn't have a half bad stock rank - S/R 78.
*** I've been asked for the full list of actual £ dividends paid out to each and every share. Will do so, but it might be tomorrow now. ***
--------------------------
PS.
Won't be doing the same monthly follow up for NAPS 2019 as I will become increasingly unreliable due to other demands, but mainly, to my being busily occupied in the periods over month-ends.
@Velo - I highly welcome the comments. I think it's important I respond to some of them as I fear that your musings can lead to some misinterpretation.
1. "StockRanks producing gains in bear markets"
I don't think there's any stock market rating system in the world that would claim to be able to make persistent gains in bear markets. The nature of the market - which I elaborated on extensively in this article is that it rises and falls in about a 2:1 ratio. So will most deciles of the StockRanks. It's par for the course. We've certainly never made the claim that the StockRanks will create positive returns in down years, and I don't think you should be under any illusion that they were designed for this purpose. They weren't.
They were designed to be statistical measures designed to aid investors to find cheap, high quality and strong momentum stocks with more ease - that's it. Shares with the strongest exposure to these traits (e.g. 90+ Ranked) have beaten the market historically, on average, over the long term. But there is no guarantee that they will outperform on any single year, and no guarantee they will outperform any year in the future.
It seems you are looking for a system that will produce absolute positive returns in all years down as well as up. That's definitely not the NAPS. In order to do something like this, I would personally be looking for a low-volatility absolute return strategy - likely multi-asset with plenty of long-short hedging and market timing thrown in. It's a much more expensive active strategy and I do have friends running hedge funds who run these kinds of strategies. They don't return 91% over 4 years but they do minimise the downside.
2. Comparison with 2 globally cherry-picked fund managers
I do recommend reading "Fooled by Randomness" by Nicholas Nassim Taleb. Cherry-picking 2 fund managers that have done well in 2018 is hindsight bias, but also an unfair comparison. Nick Train and Terry Smith run Conservative, Quality, Global portfolios. The NAPS is more speculative, is far more value and momentum driven, and entirely UK focused.
It's only fair to compare the NAPS against the UK All companies fund & trust segment which can be found here on TrustNet. TrustNet shows total return statistics (including dividends). The NAPS returned -11.5% in 2018 (see below) plus 3.5% in dividends... i.e. -8%. This would have been a top quintile performance (top 20%) against UK fund managers on a 1 year basis. The NAPS have returned 91% (before dividends) over 4 years. There is no 4 year comparison on the TrustNet website, but there is a 5 year comparison. Only 1 fund out of 254 has returned more than the NAPS over this timeframe. MFM Bowland.
My point is not that the NAPS is a superior strategy - it's that direct investing in shares as a private investor has the potential to be far more profitable than investing in funds.
3. NAPS Performance Calculations
The NAPS is an illustration, and a jazz sheet for others to riff on, it's certainly not a tip list for others to copy. The performance figures I quote are from the close of the year, to the close of the year after. i.e. 29th December 2017 to 31st December 2018. On that basis it's an 11.5% loss for the year. I do appreciate that buying the same shares on another day will create a different set of performance figures.... but really on any other day the NAPS portfolio would have differed too.
I would always encourage readers to do their own research, and do their own thinking - this is a DIY site. Everyone should look for a strategy to match their own psychology and goals. Anyone looking for a strategy that has gains in every year, even in bear markets definitely shouldn't be using the NAPS.
Many thanks for all your hard work posting the monthly update figures Velo. It is great to see such fine detail on the progress of the Naps. I don't blame you for ducking out next year.
Like you I'd love to find a stock picking system that creates a positive return regardless of the market conditions. But I reckon that is a pretty tall order for any system. Bearing in mind the low time overheads and the astonishingly positive performance over 4 years I think Naps demonstrates that picking high rank diversified stocks pays off. Maybe I'm just easily pleased (although friends and loved ones wouldn't recognise that description) but I'm than happy that Naps has outperformed almost all indices this year (albeit a small outperformance).
Having looked at my portfolio over the last 20 years I've noticed that I've always made money in the year following a losing year - so perhaps 2019 will be better than 2018. Let's hope so.
Thanks again.
Once upon a time l was a wild speculator in gold stocks , but am now more of a mid-cap handicapper and large - cap speculator . l am currently about eighty percent in cash at four percent yield [ please do not ask me where or how ] .
My current intention is to deal only in the 100 ~ 90 Stock Rank stocks on an equal - weight basis during the coming crash .
Best wishes and thanks to everyone connected to Stockopedia . Ramon .
very good to be able to track the chosen shares on time. it focuses the mind on whether it is best for the amateur investor to be in shares or in funds . I sold all my shares in July after a fall in the market . Significaqnt falls in the shares since then [ building sector ] . Am nervous of getting back in with all the problems - brexit , european problems and usa -China friction .
No apparent easy sure fire options at present .
Worth mentioning the dividends paid out in November for SCS @ 10.9p / share & Plus 500 @ 79.84p/ share net.,which leaves ESOP to pay the tax refund of 25% back for Plus 500 from Israel. The 70.84p/ share also includes the 1 .% charge for currency charges from Hargreaves. the dividend paid out for plus 500 was $1.3786 US.
Results for NAPS 2018 up to December 2nd (Actual Friday's close on Nov 30th) -
Was expecting a worse scenario than last month, but as of the 11th month, only a slight degradation with the folio, now showing a decline of x8.6% to date. ( 0.3% worse than last month report ending).
Dividends for November were on course for contributing the lowest month all year, but SCS came in with their stonking final divi on the 26th of November which was closer to a 5% than 4% yield payment for a single interim payment alone (for holders of SCS) which meant the running dividend total period now stands @ £3.3k+ effectively a 3.3% boost to the results.
The NAPS 2018 is down x 8.6% on capital investment alone, but when dividends to-date are added in, the overall result for the folio reduces to approx x5.2% down (similar to the last month's reporting when divis included).
------------------------------
First table shows increases/decreases:
Up on last month with now 8 shares showing a % gain now (3 up on last month).
thus leaving 12 showing a red decrease since Jan 2nd start this year (ergo: an improvement on last month)
PLUS goes crackers, crushing it's top place last month even further, by a massive rise up to an incredible 70% gain.
(Another 19 like that please ED :)
And just like last month INDV languishes in bottom spot with an even worse performance now showing x75% decrease.
------------------------------
Second table shows the Stock Ranks in comparison to starting out on Jan 2nd this year -
STOCK RANKS:
13 shares show a Stock Rank above SR90, compared to the year start - which had 18 commencing in the S/R 90's.
* 5 shares have increased their rating compared to the start of the year
* And 15 continue to show reduced Stock Rank ratings since the year start.
Highest S/R is 99 (4 of them)
Lowest SR is 39 (VOD, which represents a 51 point S/Ranking drop from its start point on Jan 2nd).
VLE shows the largest single improvement in S/R ratings by increasing 14 points from it's Jan 2nd starting point.
Fabulous work Velo. Thanks so much for all your time on these monthly updates this year. You've provided a fantastic running commentary on the Naps portfolio. Fitting that the last month should underline the value of dividends so strongly.
Thanks for your generous encouragement DFS12. Appreciated.
As per usual, due to circumstances beyond my control at month endings, I won't be free or arrive back at my desk until v late Wednesday evening. So would like to end 2018 on the same date as per all year - on the 2nd of the month. Have taken copies of Dec 31st (the true year end, or if others object to the 2nd of the final month and consider that it "adds" an extra day to the year end) or if for some reason I'm unable to get 2nd Jan closing data if still on the road.
However, I'm expecting Ed will have his review and the new 2019 NAPS ready to go, before I post. However, I will complete the year and post ASAP after I get settled in, once back at base.
Klaus,
Ed reports on the portfolio performance six-monthly, but Velo in the previous post to yours was referring to a monthly tracker that he produces. (Both use different methods of 'keeping score' - both for valid reasons imho.)
A well thought out Method, with simplicity and brilliance in abundance.
Do you publish monthly results of your Portfolio?
December 2nd, the penultimate update, for the NAPS 2018 folio should be posted by tomorrow (before the end of Monday evening at the very latest) for results achieved by close of trading on Friday 30th November.
As per usual, now find myself travelling back long distance at each month's week-end; hence slight delay in posting the data.
Hi Velo,
Thanks for explaining the dividends are pooled together. That is why I was questioning the return.
There is also a 25% tax reclaim on the dividends that comes into the picture as well. The first part where 75% of the dividend is paid & then a bit of a waiting game and the exchange rate comes into play as does their bank charges too! So in fact you do not get the full 25% back.in refund..
If it is easy for you to show each share dividend separately, that would be good.
Another chunky dividend to come from Plus 500 this month which should be about 100p or so depending on the exchange rate at the time
.November will be my best month for dividends this year and estimated end of year should be about 70% up on last year.
I am questioning the figure of Plus 500 being 49% up to 2nd November since 2nd Jan the price was 881.5p and they have paid out one dividend this year already.which is extra money to the total return.
Hi L/Tiger,
You ask:
"I am questioning the figure of Plus 500 being 49% up to 2nd November since 2nd Jan the price was 881.5p and they have paid out one dividend this year already.which is extra money to the total return."
--------------------------------
49% gain up to Nov 2nd is correct.
I'll re-post the final para of my post (No:270) about 4 posts or so above here, as it explains why end of day prices were NOT used as it wasn't 'real world' buying as the market would be closed -
"..For the NAPS I added broker's fees, stamp duty where appropriate, and the margin for the buy price and not the mid price, Additionally I also attempted to stagger/ guesstimate the buys throughout the day as end of day prices in real life would be impossible due to the market being closed, hence above it shows .... the real-life increase which was correct on 2nd November 2018...."
Jan 2nd opened @ 899p it closed lower @ 881.50p
Intraday it travelled as far up as 903.50
- and as far down as 869.5p
Take out the close as unobtainable in a real life situation, and which would you choose for the day? (See that para above)
In actual fact, It looks like I chose from quite early in the day, and including all costs as mentioned in the above para I entered Plus as being bought all-in, all costs inc, for 889p ( That's 563 shares equiv. to £5,005.07 and therefore 889p per share).
I do not calculate the percentages per share but copy the percentage gain/decrease directly as shown in the folio here on Stocko. The SP showing for PLUS on this site on Nov 2nd was 1326p - so a quick actual calc and re-check (as I never check Stocko I merely copy over) and yes it's the same as I posted - 49% (49.1%). So the % gain shown is correct.
- Even so, using your closing price as the start point, the percentage comes out pretty similar at 50% gain (50.4%).
The dividends are pooled together as in real life (unless you've instructed your broker to reinvest immediately back into purchasing more stock). The (real life calcs) dividends for the folio as reported above is now a running total of £3.0k+ (£3022.65)
- So "your" PLUS divis are in the divi-pot, so sorry that's where your PLUS divis will remain :)
PS. If you like, It would be quite easy for me to post the individual total divis obtained for each share at the year end, if it helps.
Hi Nick,
"...And the stock with the lowest original SR (VLE 83) has the second highest gain (actually I think it is 47% not the 27% as shown in Velo's table.).... "
No, it's as shown Nick ( 27% )
Think you might have inadvertently strayed on to the incorrect line when calculating.
For your purposes, if you take the mid price close as shown yesterday when you posted Friday 9th Nov of 1100p and use Yahoo Finance historical prices or any other plaform you prefer and bring up Jan2 2018 - the closing price on that day was 857.50p
So on end of day mid prices that's 28% not 47%.
For the NAPS I added broker's fees, stamp duty where appropriate, and the margin for the buy price and not the mid price, Additionally I also attempted to stagger/ guesstimate the buys throughout the day as end of day prices in real life would be impossible due to the market being closed, hence above it shows 27% real-life increase which was correct on 2nd November, but now a week later at close on Friday 9th, it's moved on and is now in fact down to 21.5%
Hope that explanation helps.
Regards.
Thanks Velo. For some reason my historical price data for Volvere (LON:VLE) was 740 for about a month around 1/Jan/2018. I've just reloaded it from Yahoo and now I have the correct data. (I don't usually look at stocks below £90M so it's a stock I only track for the sake of the NAPS portfolio.)
Ahh sorted, Nick - thanks for advising.
You know if perchance you were right - it would have rendered the folio results for all this year completely innacurate - as the folio is balanced - it couldn't have been that far out without serious consequences to the whole accuracy of the folio. So I'm relieved :)
It's a fascinating result. Starting with the highest Stockrank stocks in each sector, after ten months so far the performance seen has a huge range from -50% to +50%. And the stock with the lowest original SR (VLE 83) has the second highest gain (actually I think it is 47% not the 27% as shown in Velo's table.)
But the really interesting thing is that this a fairly good result. Every metric I have looked at performs similarly. Even when you choose from the top decile, you still only get about a 60:40 success rate (at best) in terms of beating the market, and the market is currently at about -8% or so.
Anybody has a backtest not using just UK market but all the shares of this world following the NAPS system? I'm subscribed to all the world markets and would like to know if this can work also with shares all around the world and not just UK's one.
Thank you :)
TYPO! AS AT NOV 2nd - NOT AS SHOWN AT OCT 2nd
Many thanks Velo. 5.5% drop is a good result I think. Thank you very much for all your time in posting these updates. Seeing the track of ranks and prices during the year is really useful. And adding the effect of the dividends gives that missing dimension. So many thanks. And glad your portfolio is recovering nicely. Hopefully we'll all have a better position to cheer by the time Christmas comes.
Hi dfs12,
I'm pleased you've found it useful as we draw into the final run to the year end, thanks.
RE: "And glad your portfolio is recovering nicely."
- Think I might have over-egged that bit about my portfolios. They''re still down on Oct 2nd but are improving, but it appears in fits and starts. So, yes, improving but they're still damaged from the recent worldwide correction.
Until next month.......
Regards.
Once again, apologies for the late posting of Nov 2nd results. Thought, there's only 3 more updates to go, I can manage that, but I'm pulled in all directions near month ends now, and travelling 150 miles away from home for a full week. Took print-off's of Friday's close, but only had time to finish it this past day. Don't think I'll be able to do this all next year - but only 2 more months to go - I can see it through to the full 12 months end.
Thought - great no one's posted a query, I can relax and post it by Wed evening - but got nailed by a private message, just as well, as I was already half way to letting it slide to Thursday.
Right. Onwards:
Results for NAPS 2018 up to Tuesday 2nd November -
October got caught in the worldwide correction (signs it's now abating) my own portfolios are improving no end. How have yours fared? All is mostly woe from most investors the past couple of weeks and the NAPS 2018 is no exception. On Friday it increased a full 1.1% up by close that day - but that is still an overall x8.3% fall, year to date.
Dividends:
October has proved to be another weak month for divi income but look at the total - it's now a running total of just over £3k in divi income in real world terms
- so instead of the NAPS 2018 being down x8.3% you could say, it is now just x5.2% down year to date.
So, taking account of an horrendous late October that doesn't sound 'too' bad when including divi income also.
------------------------------
First table shows increases/decreases:
Only 5 shares showing a gain now (one down on last month).
thus leaving 1 at 0.0% and like last month 14 of them, showing a red decrease since Jan 2nd start, this year.
PLUS is now a 'normal' expected top placing remaining in top place with a 49% gain.
whilst INDV just like last month remains at the bottom with a x 50% decrease.
------------------------------
Second table shows the Stock Ranks in comparison to starting out on Jan 2nd this year -
STOCK RANKS:
Overall, 12 shares show a Stock Rank above SR90 compared to the year start
* Just 3 shares have increased their rating compared to the start of the year
* 2 retain the same S/R as they started out with,
* Which means 15 have reduced Stock Rank ratings since the year start.
Highest S/R is 99 (3 of them)
Lowest SR is 54 (FORT)
Erratum:
"September has run on with its decrease, now increasing to lie at x 5.5% down since Jan 2nd 2018 representing a £5.5K capital loss on the initial investment."
Should have read x 4.5% down (£4.5k capital loss not £5.5k as reported).
The result with dividends included, remains the same at just 1.5% down.
Apologies to all.
Strange that Indivior (LON:INDV) has recouped its stockrank.
How Indivior (LON:INDV) 's Stock ranks have evolved this year:
Colour code: Quality - red Value - green Momentum - Blue Stock Rank - dotted Magenta
For Indivior (LON:INDV) this year Value and Momentum seem to cancel each other out. When one is high the other is low and they cross over at about the 60 mark.
The Stock Rank dropped a little when the Momentum fell more quickly than the Value rose but now it is being held high by the increased Value (also known as a "huge drop in stock price.")
With Indivior (LON:INDV) there is a judgement call to be made about whether they can replace their cash cow drug with something similar going forwards. V > 80 means that the market isn't entirely convinced yet. But the Stocko ranking system likes cheap stocks and of course it is working probabilistically. It doesn't need every cheap stock to work out.
NAPS got a big kick upwards from Volvere (LON:VLE) (and SCS (LON:SCS) to a lesser extent) today which is quite amusing as it was quite a strong down day for most of us.
Sorry for the late delay in posting. Was far better with my old XP computer than this one. Couldn't get JPEGS to convert or anything.
Results for NAPS 2018 up to Tuesday 2nd October -
September has run on with its decrease, now increasing to lie at x 5.5% down since Jan 2nd 2018 representing a £5.5K capital loss on the initial investment.
Dividends; well the previous month had the biggest monthly contribution to date, so unsurprisingly this month's is no where near that, with September contributing only £186 to bring the cumulative dividends running total up to £2,853 but no where near enough to really dent the overall decrease, as now including the dividends, the overall loss comes in at x 1.5% down. (Only fractions of a % last month).
------------------------------
First table shows the number of shares showing a gain, is same as last month with 6 shares showing a gain,
thus leaving the rest, 14 of them, showing a red decrease since Jan 2nd start, this year.
PLUS as ever remains top dog but now only sporting a 51% gain.
whilst INDV is in the bottom spot with a worsening position, showing of x 54% decrease.
------------------------------
Second table shows the Stock Ranks in comparison to starting out on Jan 2nd this year -
STOCK RANKS:
Overall, 13 show a Stock Rank above SR90
* 4 shares increased their rating compared to the start of the year,
* 2 retain the same S/R as they started out with,
* Which means 14 have reduced Stock Rank ratings.
Highest S/R is 99 (3 of them)
Lowest SR is 58 (STCK)
Many thanks Velo. Drop not as bad as I had expected.
Hi Dfs12,
- Was going to leave a post this afternoon advising that I will be late posting this month's NAPS update, but you've beaten me to it :)
Once again, I'm 150 miles away from my desk and travelling back on Wednesday so looking to post the update this Thursday.
Taking screenshots etc after tonight's close so making it 2nd of the month prompt & locked-in data, and ties in nicely with the start of the year's 2nd January which was also a Tuesday - so a nice, straight 9 months for a three-quarter year, snapshot.
Yes, I have kept up to date with the recent posts; and as you might imagine, currently, the month is looking to close a little more bearishly than last month's running total, so dividends will be more important than usual.
One can also use this graphic from the stockreport for a snapshop of volatility
I find this graphic a little more useful as it also gives an overview of price movement and spread
The graphic annotates
Volatility using Beta
Bid offer spread
And price change through 1 year, 6 months, 1 month and 1 week
It assists as a quick reference in finding shares coming back to support
One could then always cross reference one against the other
More on Beta
https://www.stockopedia.com/ra...
More on Risk ratings
https://help.stockopedia.com/p...
Key day reversal @resistance for Griffin Mining (LON:GFM) today?
Okay, okay .....
I understand all that and I have some sympathy with the "bypass psychological biases" bit.
What I'm trying to say is perhaps best indicated by Indivior (LON:INDV) . I was actually looking for a pharma stock in the autumn of 2017 and for the first time - via SR (98 I think) - noticed it. Quickly looking at the StockReport I saw a price crash Sept 2017 and checking the news I saw it was a one drug company where others were trying to introduce generics and there were legal battles going on. Not for me. Very high risk. 5 minutes.
Phil
Indivior was marked accurately as speculative by our RiskRatings system at the time of the portfolio formation. See below a report from around that time.
Plus 500 was another of marked as speculative in the RiskRatings. It's no surprise that the two most speculative stocks in the NAPS at the start of the year have had the two most extreme binary outcomes towards the end of the year. One negative, one positive. This is to be expected as they were historically the most volatile, and historic volatility tends to persist.
If one desires a less speculative portfolio, there's a lot of tooling on the site to help one do it. The number of speculative companies in the NAPS is limited to 25%... but others often stick to even lower volatility shares.
With the RiskRatings you can reduce the research time to find out how 'high risk' a stock is from 5 minutes to 5 seconds. These sort of tools are pretty powerful.
Since inception the performance of NAPS has been incredible. The recent underperformance of a few percent for a few months is absolutely nothing at all. If I ended a five year period of investing with that sort of record I'd be absolutely delighted (as I think most people would be). The benefits of using a factor based system is that you bypass psychological biases that may lead you to investments that are not the best. Leaving it to the numbers removes that risk. Interestingly, I also choose to use ranks as a start/middle but it's not something I'm proud of as I have underperformed the NAPS portfolio since its inception - so I would have been better off following the factors!
Indeed the NAPS is down -3.5% year to date, versus -1.65% for the FTSE All Share - a slight bit of underperformance. Though with a yield around 3% it's a fairly flat overall return.
After returning 29% annualised over 3 years (without dividends), there was always going to be a period of consolidation. You can't invest a strategy in equities with high upside potential without expecting downside volatility - especially in a concentrated 20 stock portfolio.
I've always said that I expect the NAPS portfolio to have a reversal of 30% or even 50% in a really bad bear market (e.g. 2008-9). This is to be expected. Anyone investing in equities that isn't comfortable with this kind of downside volatility needs to do one of 2 things:
1. Manage downside risk (via stop losses or hedging)
2. Get out of equities and stick to bonds or cash
Frankly the market feeds on private investor fear. So our tendency to switch strategies or get out at the slightest glimpse of volatility plays into smart investor's strategies. There are dozens of psychological studies that show that people that look at their portfolio once per year outperform those who look at it every day. There's a reason this strategy is called the NAPS... do it, take a nap, come back a year later and hope you win most of the loaded coin flips.
Here are some timeframe charts vs the FTSE All Share for some sense checking. ( Screenshots courtesy of our new app which is in Alpha testing. )
Year to Date
Since Inception (nearly 4 years):
Ed
The NAPS have performed well over the past few years but using the FTSE all share as a benchmark seems like comparing apples with pears.
Because the all share is Mcap rated approx 80% of it is the FTSE100, are 80% of the stock selections for the NAPS over the past few years from the FTSE100?
If you ignore investment trusts, ETF's and VCT's you are left with approx 1700 companies to choose from on the LSE, circa 800 of those are in the AIM all share index which is probably the best barometer of the overall market and most PI portfolios.
I know there aren't any AIM all share trackers so if an individual wanted a passive investment they would have to move up to a FTSE250 tracker which I still think would be a better benchmark than the FTSE100/FTSE all share.
Regards
The NAPS strategy for this year at least (the first year I've done it) is turning into a disaster such that I'm now under water: this morning has seen huge further falls (e.g. IGG) I don't know what circumstances have caused this but, as others have said, something turned in June and what gains were made have been eradicated such that the strategy certainly does not beat the market as a whole. Are the algorithms appropriate?
Am selling up and moving back to HYP. I have little doubt that this will cause the resumption of normal service.
Chopping and changing strategies will increase the likelihood of under performance over the long run. No strategy will outperform continuously.
Thought I'd have a look at this post again, as replies have bumped it up the discussion board...
...and I thought I would do a reply in respect of your comment snodgrasse as I do think you are being a bit harsh. However, I also disagree with Ed's subsequent 'take a nap and come back in X months' statements too... even though he is far more knowledgeable about the markets than I am, and I am sure that he has done a lot better out of them overall.
Personally, I consider the NAPS (and SNAPS) portfolios are simply providers of ideas for further investigation, in the same way as the posts from Graham are Paul are, and the SIF portfolio too. I have not benchmarked my own portfolio performance against NAPS or SNAPS and so I don't know how well I am doing in comparison... though I am sure that I doing rather better than SNAPS, which I think looks a little bit shoddy with a couple of unsuitable picks (see later).
I think a 'nap' type strategy is more suitable when one has invested in companies after thorough research, not one where one has done " less than an hour’s work at the beginning of the year, with absolutely no research into any of the individual stocks in question". I also think that it is inadvisable to invest in the stock market without keeping a regular eye on what is going on. This may not be practicable for all, and I think this is where Stocko alerts would then come into play, if there is a significant price fall then one must investigate why.
I don't wish to be condescending (which mean I probably will be, so I'm sorry in advance), but I think it is a bit naive to not know why IG Group (LON:IGG) is falling; incidentally, I don't see them in this year's NAPS. The same is true of Plus500 (LON:PLUS) (after previous good performance), and I have to wonder Ed why these were included in the SNAPS portfolio when it was quite obvious that the rules around spread betting were going to cane stocks in this sector, at least in the short term (as has proven after updates from both companies indicating more subdued performance and outlooks); at the time of the NAPS 2018 this was not known, and in that portfolio they have done well.
I think the SNAPS portfolio illustrates very well that the "invest with no research and forget about it" approach is seriously flawed. It also proves that investing purely based on the Stocko Ranks (and page) is also flawed. Griffin Mining (LON:GFM) in my mind is a prime example of both - it has been quite obvious (to me, anyway, she said, and not just with hindsight) that for some time there have been hints at coming under-performance, with the prices of the metals that they mine being under pressure for some time, the continuing lack of dividend, the Zone II license saga carrying on and on, as well as the company being frankly light on updates.
I researched all of the NAPS stocks after the NAPS 2018 portfolio was published. I didn't like the look of Indivior (LON:INDV) at the time, my notes were simply that the single-digit profit and revenue growth were uninspiring. I think there was a warning sign in Ed's commentary about the legal fights and the consequently elevated risk... but if one was holding these then surely the interim results should have rung some alarm bells, and thus today's update which has wiped a lump off the share price is of little surprise. For the same reason, I didn't like the look of Stock Spirits (LON:STCK) due to low growth. I held Vodafone (LON:VOD) at the time of the NAPS publication and still do, and have even considered buying more - mobile phone use is only going to increase, and when the company's data proposition becomes more attractive and they sort out one or two other areas then I am confident the price will recover; in the mean time I am being rewarded for my patience with stonking dividends. Taylor Wimpey (LON:TW.) are down 17%... but I think the reasons are fairly obvious here too, the whole housing sector is in the doldrums at the moment, though I don't really understand why, there is still a housing shortage but there are overblown Brexit fears too. I am a recent holder of Computacenter (LON:CCC) which is in the SNAPS portfolio (which is not why I bought them), I am a little disappointed that they are down, but although the last results looked good the picture was a bit mixed.
I have probably written far too much to really make a point here... and probably sent some of you to sleep too! In summary though, everyone has different ideas on how to approach the market (which may or may not work for them), but my own view is that one can't just blindly make share investments based on ideas and one cannot just forget about them once they are bought. Things change, for better or worse... and I think you need to be on top of this. Another thing to point out though, the NAPS/SNAPS portfolios do prove that divestment reduces risk - there are indeed some quite catastrophic fallers, but these are reigned in also by some steady looking stocks too, such as BP (LON:BP.) which is doing very well out of the oil price rise, as well as production increases.
Andrea, I think it's great that you know so much more than me about all these companies than I do. I've never pretended to know anything about these companies, and I've made it absolutely clear from the start. If you think you can add value as a stock picker, then that's brilliant. I just choose not to, as I don't believe I can.
What interests me is selecting factors not stocks. I believe fundamentally that all long term equity returns (on average) are driven by exposure to factors. History shows that on average good stocks outperform junk stocks, cheap stocks outperform expensive stocks, and strong stocks outperform weak stocks - regardless of the company names, sectors or themes. The NAPS portfolio does nothing else but try to invest in factors.
There's nothing wrong with not knowing the holdings of a portfolio before investing (as long as you trust the selection criteria). After all - what do the 90% of investors do when they invest in an ETF or a fund? They don't know anything of the stocks held within, but trust that the selection criteria (of an ETF index, or of a fund manager) can do the job.
I trust in the power of factors.
This year... factor investing hasn't done so well. In fact the 90+ StockRank set of stocks is only up 2.5%. The NAPS being down 3.5% is a 6% underperformance of the 90+ StockRank benchmark. That's not a great run of recent form, but it's just a sampling error. The NAPS is a sample of its benchmark, and it's perfectly reasonable to expect a sampling error of +-10% every year.
Ed
I choose not to be ignorant - and I'm pretty sure you're not.
This years NAPS was high risk - could have worked and may still do. The risk factors I'm talking about are not captured in the quants.
I prefer to use SR as a starting/middle point not an end point. We'll never agree.
Phil
Ed, I'm a big fan of trailing stop losses. Have you computed how well the NAPS portfolio would have performed to date with the application of, say, a 20% trailing stop loss?
Really helpful updates all, it will be fascinating to analyse the data at YE, hopefully we will have seen a marked improvement. Having just read Joel Greeblatts 'the little book that beats the market' and following Jim O'shaughnessy its clear with a systematic factor approach we should expect some potentially extreme under-performance some years but over the long term if you believe in the process and stick with it, the returns are statistically very good.
Great work thank you very much
Velo is right. NAPS is having a bad time at the moment. Usually the NAPS follows the AIM100 index reasonably well. For example, last year:
But this year something happened from the middle of June, and it also affected the SNAPS from the middle of August:
What was it? STCK VOD and INDV have under-performed all year and GFM has started to fall since June. Apart from VOD all of these have quite high volatility. So either NAPS2018 has more risky stocks than usual or perhaps it is just that more of its riskier stocks than usual have moved in the "wrong" direction. This isn't a complete explanation. Does AIM100 contain a different proportion of high volatility stocks compared with NAPS/SNAPS? More importantly, was this just "bad luck" in the stocks NAPS chose or is there more that could be done? I don't know.
Note: In the table below the Volatility/Q/V/M/SR data is from January and the list is sorted by Volatility.
Thanks dfs12 -
Dividends - I love marking up my calendar with all the dividends coming in (3 months at a time, with reviews in that time-frame as some companies fling them out with minimal notice - others eons of notice). Lovely feeling - I call it my little part-time salary (dividends just on the edges of achieving five figures per year in total). And it does feel like that, seeing the amounts ticked off on my calendar - a salary from a part-time job :)
Anyway, thing is, over the past 12 months I've had at least 3 occasions where none came into my brokers accounts, even though they were due, so waited days and waited some more, finally phone the brokers (two of them) then silence as someone checks and rather unconvincingly they say that company is late paying but it should be with you in the next few days. I explain they've never done this before, but they don't budge.
The result is always the same, within hours the next working day the errant dividend appears in my brokers accounts. It's like checking your change. Wonder how many just accept the dividend will be paid automatically and never bother to actually check up?
Hi Velo, It's that time of the month again. Totally understand if you've decided to put the monthly updates on hold. NAPS has been rather a hot topic over the last week or two - so perhaps publishing the monthly position might stir it up some more. However, I'd be very happy to see your analysis if you were thinking of doing an update! All the best.
Well a disappointing close to the month of August with an increased retrace since last month and so the 2018 NAPS is now showing a fall to date of 3% representing a £3K loss on initial investment. Let's hope the best months lie ahead.
- However the most important take-away from this exercise is the sheer importance of ..... DIVIDENDS!
This month contributes the biggest in terms of divi payments for August alone of £693+ making the cumulative running total of £2,666 in dividends alone, and as near as possible saves the folio from disaster to a much more presentable loss of just a mere 0.4% loss.
Dividends - under rated by many growth fans, I'm sure (I just won't select a share if it doesn't pay a divi, no way!) - but once again dividends beaver away in the background, and saves the bacon this month as well!
You could almost claim that it helps give adherence to following Warren Buffett's two jokey principle rules of investing:
Rule No:1) Don't lose money & Rule 2) Don't forget rule No:1
:)
------------------------------
First table shows the number of shares showing a gain/decrease, is now down to just 6 shares showing a gain,
one at a neutral 0%,
thus leaving 13 showing a red decrease since Jan 2nd start, this year.
PLUS is top dog but with a reduced lead of a still nonetheless impressive 73% gain
whilst INDV gets worse, retaining the bottom spot with a worsening position, showing of -33% decrease.
------------------------------
Second table shows the Stock Ranks in comparison to starting out on Jan 2nd this year -
STOCK RANKS:
* 4 shares currently sport an increased rating compared to the start of the year,
with 3 in the S/R90's,
& one in the S/R80's,
* 3 remain unchanged,
* Which means 13 have reduced Stock Rank ratings. (But that's an improvement on last month).
Down now to only 9 stocks still showing in the green 90's (How many 90's did Ed start out with?)
with over half a dozen in the 80's,
2 in the 70's
and Vodafone sporting a S/R of 60
and VTC down in the dumps at measly S/R55
All in all, a poorly performing month but pulled back from the brink by the valiant efforts of the divi producing shares.
ALL HAIL THE POWER OF DIVIDENDS! :)
Excellent update Velo. Many thanks. Over the last couple of months I've managed to convince a couple of old investing mates to sign up to Stocko - it'd be just typical if they join just as things get tricky. But like any system NAPS is bound to have periods of underperformance - and to be fair, the general markets aren't having the best of times so NAPS is doing OK. Like you I'm a big fan of dividends and love the fact they bail you out when the capital gains let you down.
Well, it's all done and dusted - just the infamous formatting to do - which I'll leave until tomorrow as up on other duties from 4:00am tomorrow.
But for defo, will have the latest NAPS performance up by tomorrow Sunday evening (early evening hopefully).
Nope DFS12 - add a couple of full percentage points decrease (but if you were mentally adding in the divis then you're in with a shot :)
Lets go for a -1.5%. Complete guess. Looking forward to your update and hope the gardening goes well.
It's the 2nd of the month on Sunday and time for the monthly update of the 2018 NAPS folio.
After progressing nicely since the last update, it has unfortunately, over this last week or so, been disasterous for the NAPS, if that's not too strong a word to use.
Currently the poorest performing NAPS on record since NAPS records began, but the year end is still a good way to go, in perhaps the best months yet to come? (ie., Sell in May and go away???)
Whatever, currently it's worse than last month's, by a slightly greater drop.
Got lawns to mow this weekend with bushes and trees to trim and brushland to decimate behind the garage but somewhere this weekend I should be able to update by Sunday latest.
In the meantime whether based on the general market performance or other means - try and guesstimate the % drop for the year to date as of this week's close :)
NAPS has had a hard time since about mid-June. Here it is compared with a few indices. (NB: the AIMONLY and FSMALLCAPS are not very accurate - I only track a subset of those categories.)
The top performer is AIM100, which in fact has been the top performer for quite a few years now. AIM alone can be quite a risky set to invest in, but the AIM100 (Market Caps about £170M-£4B) has been a very successful hunting ground.
Are you seeing anything (tables?)
Yes - two tables - one for the change in stock ranks and one for performance.
Thanks letap73. Only taken me over half a year to learn how to upload tables here -
(With clour this time - colour!!! :) :) :)
(Get's up and does that David Brent dance)
The second table looks ginourmous to me, as the handles disappeared and just couldn't get it resized.
I've now custom measured page sizes on my DTP instead of leaving everything on A4 size as above, so maybe no distortion next tiime.
PS. Only just realised the little converter I use was set to PDF !
- No wonder I've had trouble all this year on here. No need for the DTP next time I'll be able to get the whole of both tables to post perfectly (I think).
Might be able to fit in the whole portfolio itself, rather than my transcribing of it.
The tables are very clear in what they show - which I think is far more important than perfect formatting.
Keep up the good work.
.
Sad to report that much of the year's progress has been lost and dissipated away by the end of July (month 7) to this week ending, 3rd August 2018.
It limps in, at a big reduction to the last report at a measly gain of just 2.3%
Time to stop saying well at least it's beating FTSE - All Quant funds are taking a big hit this year - it's the worst year for Quant funds since - well see for yourself in this report in the FT last week - https://www.ft.com/content/e33...
(It's a funny pay site so paste into Google "Quant Hedge Funds Lose Their Allure" instead, if that link blocks you).
It reports that Quantitive Hedge Funds halved this year to their most sluggish pace since 2009!
Nothing much Ed can do about it. It's a much larger issue.
Anyway, dividends are now cumulatively running at £1,972.46 and come riding in to the rescue somewhat, bringing the full % gain up to just under 4.3% gain - a bit better, eh?
Only 7 shares are now showing gains this month, with 12 showing decreases and one bang on 0%
PLUS leads with 112% gain whilst INDV brings up the rear at -26% down.
STOCK RANKS:
* 4 shares currently sport an increased rating compared to Jan 2nd start,
* 1 remains unchanged
* Which means 15 have reduced Stock Rank ratings.
12 stocks are still with a nice green 90's or 100 SR rating ie., One sports a 100 Stock rank rating but there are now 5 'greys' ranging from S/R 76 down to S/R 61
Top 5 best performing shares are made up of 1 S/R 100, 3 in S/R 90's and a 5th at S/R 87
All Bottom 5 positions for poorest performance contain 2 in the S/R 90's and 3 all in the S/R 60's
Performance tables below:
% Increase/Decrease performance
Stock Rank rating changes
Tsk! Duh! I can see they're not opening, sorry about that. It's gone midnight - so I'll sort the tables tomorrow and re-post.
Running well behind schedule - haven't even started on it yet!
Don't want to waste people's time unnecessarily - so it'll be very late tonight or tomorrow when posted.
Sheesh, look at the time - gone midnight.
2nd of the month, so will try and get the monthly NAPS 2018 update posted by tomorrow. Was going to post on the full week closing on Friday, but the portfolio has blown all it's gains to smithereens, so thought well it's supposed to be the 2nd of the month so might improve by Thursday - but it's even worse now!
Only just remembered to prnt off the state of affairs just now, before it changed again tomorrow.
If you anybody sees this on Friday, please post if you prefer the Naps update to end on a full week, then this month would be run to the 3rd of August, and I'd post the results tomorrow evening.
I'm keen to see the current state - whenever suits you.
Hi Velo
A vote for a full week report please. That way I get a weekend to digest the information.
Thanks
Aug 3rd today finish, it is then.
Hopefully I can post by mid evening/
(or later evening if I'm still pushed for time).
as a caveat - my own NAPS portfolio is very slightly difference to Ed's list.
I think that is harsh: most of us measure things over either the calendar year or the tax year, and the fact that NAPS beat over 99% of funds during the former is enough. It won't always work, but surely the underlying premise of stockopedia is not that something works all the time, but that the information and the way it is presented allows us to make informed choices that, over time, will lead to outperformance.
I think this NAPS idea contains a huge element of luck. OK, in buying NAPS you weight probabilities in your favour (which is perhaps the best you can do) but the timing of your NAPS purchases is random and varies from month to month. What was a NAP in January may not be so in February.
I now have three NAP portfolios running. Needless to say, the fantasy one I set up in August 2017 is doing best, up 20%. The first real one I bought in September 2017 - with many of the same shares - is up 10%. It had too many losers and a couple of winners (e.g. GFM) so I rebased it last Friday and started afresh. Friday was a general "up" day so I bought at the worst time. I'm now down 2% but that's noise.
However, shouting that you're up 47% on the year, as though it were a general principle, is a mistake: that was good luck, not good management.
Two trading days is two trading days; days that could be improving the dire performance of this portfolio since January.
How can a lag in reporting impact the performance of the portfolio when it's only re-balanced annually?
timarr
I thought it was re-balanced every six months?
Not the standard NAPS no. That's yearly. There is a SNAPS variation that re-balances every 6 months.
I would just try to be patient, Ed never lets us down but writing the article will take some time.
Ed, when are you going to update the NAPS portfolio? My understanding was that it was supposed to be a six monthly review cycle?
The half year only ended on Friday. It’s not yet two full trading days into the second half!
@StephPeters - I will be writing up the semi-annual version of the NAPS (called SNAPS) this week. If I get it finished it will be out before the weekend, otherwise early next week.
I'm not sure why you call it 'dire' performance. The portfolio is up 5% outperforming the FTSE 100 by 6%. To be clear, it's an equity portfolio. It will go up and down. I fully expect a 30%+ correction in the NAPS as standard in bear markets. That's equity risk for you. It's a non-hedged, fully long portfolio. If +5% in 6 months is dire, I'd hate to think how people will react to actual losses !
Will hold from posting the "supporting act's" half year updates until Ed has time to update on the big one, later in the coming week, or whenever Ed has time, and post some time after (also many thanks to Ed for tidying up my tables early in June).
Incidentally, I have the full 6 months actual dividends, not estimates or approximations, but the real-deal that was actually paid out for the holdings in each share and it makes a considerable difference to the % gain performance for 6 months. Considerable! :)
As Ed said, the portfolio bloomed a few weeks back by the mid month point, near doubling of the % gain, then in the last fortnight or so, reverted to the year long lack-lustre % gain by the month's end
- but the dividends add near 50% to that overall % gain, because the cumulative, overall % gain finished back in low single digits. If you want to mentally add the dividends to Ed's figures then the actual full 6 months dividends is £1,521.96 (technically adding + 1.5% gain to Ed's figures; but then you'd really have to deduct the original portfolio buying costs too).
Thanks Velo. Interesting to see the dividend income. Do you have a feeling for the buying costs? It would be useful to see those. I'm a fan of shares with a low bid offer spread and have a tighter rule than the Naps portfolio. But I'm aware that might lead me to miss smaller cap big winners. It does appear that Naps has a one or two big winners and makes its profits on those. So avoiding the small stuff which tend to have big spreads might be leading me away from the big winners. The only way of seeing the effect of the spread would be to sell up the whole portfolio at the end of the year (or at least get a confirmed trade set up on each holding on a trading platform and then decline). That would give us a real performance. Thanks for your work as the supporting act... you are a significant positive addition to the Naps experiment.
my experience with the spread costs is around 125bps. This is roughly equal to the income from dividends.
i did a check - and removed names with a spread of +100bps, this reduced the NAPS spread to an average of 32bps. This also had the impact of increasing the overall performance - i don't think this is related in this instance - causation. The names removed were Bilby, Communisis, Griffin Mining, Jersey Electricity, Ocean Wilson Holdings, Somero Enterprises and Volvere.
It is completely reasonable to create a NAPS (or even more applicable to a SNAPS portfolio) with the condition of a spread < 100bps.
Feeling for the buying costs?
Not really as a total seperate £figure - as I commenced monitoring the NAPS a week or so after it was published I first looked up the historical closing prices to use for that day on Jan 2nd.
Then to get the buying ask price, I had to use the available spread difference from the live time I was putting it all together as a template to arrive at how far apart from the "mid" price it was and thus the 'ask' derived from the historical mid price. Obviously then added the stamp duty and HL broker fees (£11.99 per transaction) and then arrive at a gross price per share.
Finally, I returned to the historical close for Jan 2nd and tried to adjudge the final result on the basis of trying to get a feel of reasonability test, in an attempt to elimate potential errors that looked suspiciously out of line.
The end result is that my version is a little down on Ed's - Ed posts above that the Naps based on end of year mid prices for the first half year is up 5%.
I'm just a little behind that at 3.1% up,
(1.5% dividends paid out - which are bang on real amounts, can easily be applied to both, making Ed's 6.5% up for the half year - and mine 4.6% up).
Not bad really, considering the low market average performance this year to date. Sounds a whole lot better with the divis added in, as it would be the actual case.
PS. Thanks for the compliment, dfs12
Looking forward to seeing what Ed is going to come up with when he does his update end of June. I have a portfolio calculated already but I am finding that you still have to make some judgements and cannot rely on a totally mechanical picking process. So Eds input (and experience) will be invaluable to me and I am sure many others.
Griffin Mining (LON:GFM) is one of the NAPS and, as the top of the stockranking charts, probably a popular share among investors here. The share price is down 8% as I write, was down over 10% earlier, and is down 15% on the highs of a month ago. The reason for this? Appalling corporate governance.
Despite generating large sums of free cash and paying off all debt, Griffin Mining (LON:GFM) has failed to give any indication of what it plans to do with these assets. I know a large number of shareholders have written to Griffin and Roger Goodwin, the Finance Director, has replied politely, saying that the views would be taken into consideration. But then, nothing. It is a quite extraordinary scenario. It makes me wonder whether, as well as the identity of the NOMAD/house broker, the quality of the board and corporate governance is something that should be considered as well as simply the stock rank.
Whether this can be done quantatively is open to question: perhaps percentage of company owned by directors, length of tenure, whether AGMs are easily accessible. In the case of GFM, the AGM is in Bermuda and there is no opportunity for UK based investors to meet the board. As a result, the feelings of shareholders are ignored and the SP is currently low. It is perhaps a warning that just because something is high value on stockranks does not mean that value will ever be recognised. Very frustrating that a company can fire on all cylinders yet have a low share price because of board intransigence.
Donald Pond,
Has the cause that its bad governance been reported anywhere? Its seems that the price behaviour is too strong a reaction to be just because of this. In the end the company did buyback shares and has a strong balance sheet.
Hi,
The NAPS method of stock picking is the most interesting process I have yet found - and so far the most successful - although this year so far has been a little disappointing.tho still beating the FTSE,
Foes Ed have any thoughts about an interim half year selection - i have had to cash in some of my portfolio so it is a bit out of balance anyway - so I think I will do a complete re-balance.
I'll be doing an update at the end of the month. I normally give 6 monthly updates on the NAPS.
The portfolio was up almost 10% year to date until a few weeks ago, but has come off a bit on the Indivior fall and the general market lull. It's now up about 4.5% on the year. Ahead of the market, but certainly not on par with last year.
Ultimately, the NAPS is a long-only portfolio. So it's likely to slump with the rest of the market as and when the market slumps. There's no protection in equities without hedging or other downside risk management approaches.
Hi Ed, I set up an automatic Naps picker based on your rules outlined above, could you tell me if it is the same as your screen for today please.
I actually come up with a few different versions, today the highest have a 95.5 avg stockrating
Here is a plot NAPS2018 compared against the whole UK market. The median for the market is in yellow, and the mean (equivalent to an equal weighted index) is in magenta. The performance of NAPS2018 is shown in blue. The plot uses a log scale, so constant growth looks like a straight line. The deviation of the median line from a straight line is the undiversifiable "market risk".
It is interesting that the NAPS never (rarely) falls below the magenta line. So even worst case it is matching the market. (By the way, the gap between the mean and median performance is an emergent property caused by taking an arithmetic mean of a distribution which is approximately log-normal (or any distribution which is symmetric but geometric). The way that you "capture" this bonus is to regularly rebalance the portfolio.)
Just to get a feel for how much better NAPS is performing, here is the same plot but with the deciles (10% to 90% percentiles) added in red.
At present the performance matches the 70% percentile which is pretty good. (Connoisseurs of statistics will note that the decile envelopes have the characteristic "sqrt" look predicted by theory.)
Just for completeness here is the NAPS2017 performance compared against deciles using the same scale.
Last year the NAPS ended the year roughly comparable with the 80% percentile. Something that really surprises me is how much the NAPS portfolio moves between the percentiles. I expected it to settle somewhere maybe between 60-70 and coast along but that clearly does not happen. Even more interesting is that it seems to break for the upside when it moves!
That's great analysis Nick, always love your posts although I cannot profess to fully understand them. I working on that....
All the best, CID
With just £200 your costs would be extremely high.Just to deal at say £12 and then the spread, say 1%, that is another £2, totaling £14 ( 7%).
The average UK dividend is about 3%.
With £2,000 costs are much smaller as a %age.£12 dealing and spread £20 totaling £32 on £2,000 = 1.6%.
Both the dealing cost and the spread can be improved upon reducing costs still further. So if this can average out at 1% say then your total portfolio will be about 2% better off with the dividends paid.
That gives a total return on your portfolio which includes the dividends which can be re invested.,clears your costs and begins the magic of compound interest.
Nearly all these Naps pay a dividend, but there is no guarantee they will continue to do so.
NAPS 2018 by Stock Rank as at JUNE 2nd.
[Blue (in bold) = up on Jan 2nd. Red = down. Black = no change]
After 5 months the NAPS 2018 folio is now well and truly out of the gate and showing a 5.5% gain overall. (I expect next month Ed may do a half year review?)
Caveat: As per usual, Ed's results will differ (for the better) from mine as Ed's are from the year end (mid price I think) where as mine are culled from the first day available to purchase on Jan 2nd , using that day's end closing price inclusive of the buying spread premium, plus stamp duty, plus broker's fee. (P.S. Quite a variance on a few odd shares, between the 29th December close and the 2nd Jan close).
First thing to notice is that 10 shares are now showing gains this month, so 50/50 for the portfolio as regards workers v laggards. And that's been steadily increasing for the better all year to date.
STOCK RANKS:
* Only 3 shares currently sport an increased rating compared to Jan 2nd start,
* 3 remain unchanged
* Which means the rest (all 14 of them; have reduced Stock Rank ratings).
% INCREASES/DECREASES:
* Of the top five % increase positions, 3 are in the 90's Stock Rankings
* with one at 100
* and the other at 89.
Top performer to date is yet again, as it has been all year (Newton's law of What's in motion, stays in motion?) - Plus500 showing a 78% gain.
All Bottom five %-decrease positions for poorest performance are as follows:
* One is at 69 Stock ranking
* two in the 70's
* one in the 80's
* and the other is in the 90's.
- Holding the wooden spoon in bottom position, is not one, but two shares sharing the spot at -17% decrease with Vodafone fractionally, shading the worst performer from LSL by the merest of a whisker.
Top performing % increase share = S/Rank is in at 98 ( Plus 500 )
Worst performing decreasing share = S/Rank is in at 77 ( Vodafone )
At the half year period next month it might be beneficial to add a pro-rata dividend amount to the folio total clearly showing it as an additional extra (Hope I remember to do so :)
I'll be very interested to see the effect of dividends. Also great that your analysis is based on purchases with all the associated costs. Maybe next year someone should actually buy a nominal amount of each share (say a couple of hundred quid), then track that. Then we'd get an even closer reflection of real performance. In particular it would show the cost of the bid offer spreads.
The 2nd of the month - so monthly update due :)
If I don't manage to get the June 2nd results up by tonight sometime, I should be free to manage so by Sunday evening.
After a miserable first quarter, it kicked off last month and it's continued motoring along nicely now.
Up 5.5% overall by Friday close - after being over 6%+ up earlier in the week.
Fascinated and appreciative of the method and the commentary. As a new subscriber, and a bit of a math and stat player, I am about to start tracking NAPS and adding two mods: 1. Adding 10% stop loss, and 2. Ploughing stop loss cash back into the remaining 2018 NAPS top performers. We’ll see!
One trick you can use if all else fails is to save your EXCEL table as an HTML file. Then open it with Notepad (or similar simple editor) and grab just the table itself (between <table> and </table>).
Then in Stocko, put the comment into the "text editor" mode (options at top right) and click on the "<>" button which puts the text box into HTML mode. Drop the table in from the simple editor and click on "<>" again to get back into the normal text editor.
Thanks Nick Ray for the guidance and the support dfs12, but this site defeats me every time. Simple BB code I can do - but formatting on this site kills me! It's still all over the place!
(Going to try JPEG it next time).
It's basically fine. The reason that everything is so spaced out is that it has wrapped <p> </p>
around all the entries in the tables for some reason.
tags everywhere.
Brilliant info again - thanks Velo. And you're doing well if you ask me. A few months back I published a short article about 4 different companies. Nothing clever. No graphics or tables or anything else. For some bizarre reason the 4th company didn't show up. So I edited it. Showed in the editor. Didn't show on the page. Re-edited looked fine - didn't show. Finally on the nth try it showed up. Then a couple of days later looked back at the article and the 4th company had disappeared. I look at the other articles on the site and wonder how they manage to do it. Presumably there are a few tricks to learn. Sadly I don't have the spare time to learn them. Not sure I've got much of value to say though to be honest - so maybe a good thing for all!
Hi Velo.
Thanks for the regular updates. If you’re looking to insert formatted tables/text, the attached link suggest a reasonably painless solution using the Windows Snip tool. With a bit of practice you can incorporate pretty much anything into a thread.
https://www.stockopedia.com/content/small-cap-value-report-6-jun-2016-som-srt-amo-134306/?comment=10#10
Gus.
Bit late (formattring taking for ever. Excel won't format on here, nor Word tables, nore JPegs ....grrrr, but here is the NAPS 2018 by Stock Rank as at May 2nd.
.
NAME Stock Rank Stock Rank Stock Rank Stock Rank Stock Rank
2/1/18 2/2/18 2/3/18 2/4/18 2/5/18
SCS 100 99 100 99 99
TW. 99 98 97 95 96
BMY 99 98 98 100 99
GFM 99 99 98 99 100
MGNS 99 91 93 91 94
STHR 99 96 96 91 90
LSL 99 98 98 86 92
OCN 98 97 95 99 98
PLUS 98 96 99 99 98
SND 98 98 96 97 96
TATE 98 96 91 85 84
STCK 97 95 95 80 76
VTC 95 94 91 91 91
BP. 95 94 77 92 96
INDV 95 88 93 93 96
FORT 94 94 93 95 95
RPC 93 88 88 77 78
VOD 90 92 86 83 80
JEL 85 85 84 80 82
VLE 83 77 78 77 75
-------------------------------
Now gains and decreases:
The 2018 NAPS finally moves into positive territory this month with a 2% gain overall. Apart from the stockranks above I'm a bit concerned that I have only 8 stocks showing as a gain, whilst Ed has 12 and the overall gain difference. Might recalculate the starting prices on Jan 2nd.
NAME % Increase % Decrease
PLUS 70%
GFM 30%
INDV 12%
SND 10%
VLE 10%
BP. 5%
FORT 5%
VTC 3%
STCK -3%
JEL -3%
SCS -5%
RPC -8%
BMY -9%
TW. -9%
MGNS -10%
VOD -10%
OCN -10%
LSL -11%
TATE -14%
STHR -15%
Many thanks for the work to publish this info.
I have the NAPS up 4.4% year to date. Plus500 is up 64% and Griffin Mining up 36% as top performers. 12 winners, 8 losers. Worst performer being Tate & Lyle - down 17%. I'll update fully at the end of June.
I for one am very interested in how it’s doing & i’m sure i’m not the only one...........
Just in case there's the odd soul out there tonight wondering how the 2018 NAPS is progressing now the calendar has clicked over into May - I'm letting it run to May 2nd as all the reporting dates in previous posts have all fallen on the 2nd of each month - and I hope to post the update tomorrow evening (Wed) or during the day on Thursday; whatever if busy, I'll screen shot everything at close of May 2nd and post when free.
GOOD NEWS is that the NAPS actually hits pay dirt this month - it's best perfomance all year
- for the first time it's now clearly in profit. (Previously a loss every single month until right now in the past seven days). It's "getting there" The NAPS theory for that rocky start to 2018 is starting to sprout wings :)
PS. Haven't given a thought to add dividends to the results - will work on that as a sepertate add-on to the figures I post.
.
I have always used the end of year prices for performance tracking purposes. On that basis the portfolio is down 4.67% year to date (using the last price) vs the FTSE 100 down 7.3%. This does not include transaction fees, nor spread costs. The process is run before the year end, but the article published after the New Year.
I've always been categorical that the NAPS isn't a 'tip' list - it's the definition of a process - so I track the performance at the time the deal sheet is created, rather than the first opportunity a reader would have had to trade it (as that's never been the goal). As many pointed out, if you actually ran the process on the 2nd January you'd have had a different list.
I'm not sure if Ed intends to do a quarterly update, I hope so as I have been looking at a parallel project that 'circumstances' haven't allowed me the time to write up, so I decided a while ago that'll wait on Ed's next report and then earmark some time to write up the project together with the 'to date' results.
Meanwhile, just further to Velo's summary of a 7%* fall for NAPS, I note that over the same period the FTSE All share appears to be down 7.76%.
The comparative is probably slightly better as Velo uses "unflattering purchase points intraday on the first day on Jan 2nd" (not totally sure what that means) and include dealing costs of c. 0.25% whereas the FTAS figure I quote has no dealing costs.
So on this limited evidence this might suggest that NAPS only offers limited protection in a market downturn. Nevertheless an approach that can handsomely outperform the market on the way up and at least match it on the way down is still imho a valuable tool to have in the locker.
At the end of the first quarter the NAPS is down overall by 7% now showing £93k from a £100K starting point. I tracked the NAPS with initially HL's brokerage fees of £11.99 per transaction and unflattering purchase points intraday on the first day on Jan 2nd - so my figures may look a little more fiercely down than Ed's.
Here's how they lie:
Name
PLUS
28%
VLE
11%
VTC
5%
GFM
2%
INDV
0.2%
FORT
-1%
JEL
-4%
BP.
-8%
STCK
-9%
SCS
-9%
BMY
-10%
RPC
-11%
TW.
-12%
STHR
-13%
OCN
-13%
SND
-14%
VOD
-17%
MGNS
-19%
LSL
-21%
TATE
-22%
One less than last month in the gains enclosure with the top 5 looking like this:
PLUS 500 28% gain (S/R 99)
VOLVERE 11% gain (S/R 77)
VTC 5% gain (S/R 91)
GFM 2% gain (S/R 99)
INDV 0.2% gain (S/R 91)
And at the very bottom worst performer is -
TATE 22% Loss (S/R85)
PS. I find the formatting on these boards next to impossible when trying to copy/paste spreadsheet tables. General word posts okay, copying spreadsheets over - as you can see, nightmare - spaced out, unecessarily.
Velo,
Save the table you want to post from your spreadsheet as a picture (e.g. JPEG format). Click on 'show text editor' at the top right of the reply box on Stockopedia. Click on the image of a mountain and browse to select and paste in the table you saved as a picture.
Easy-peasy (Although I had to set up a new thread to find out hoe to do this).
Thanks for that tip E/Cool.
PS.
NAPS 2018 looking a lot healithier, going into Monday - now only 2.5% down overall. (Still beating FTSE Index though). Been a good week for my personal portfolios too.
April 2nd on Easter Monday and the first quarter of the 2018 Naps is now in and completed. As the markets closed on Thursday (before the Easter Holiday of the market commenced) and the holiday extends to April 2nd, I've used that date as it ties in nicely with the actual commencement date of the month the 2018 NAPS initiated from, back on Jan 2nd.
For the first 2 months I listed the S/Rankings for each share as they were written up in Ed's initial blog above. But the description of each company was neither alphabetical nor Stock Rank listed in order - so slight change this month - I've listed Ed's NAPS selections in stock rank order from the highest descending, as they were on Jan 2nd - then it's much easier to see over the months how each individual share increases/decreases its S/Rank rating.
In a couple of instances where I've been stalking a share or two expecting a pull back to a pre-determined point for personal buying, where a share SP has retraced - so has the Stock rank rating.
For instance, STHR was S/R 99 on Jan 2nd and now it's down to S/R 91 - in line with the SP decrease from circa 373p (inc costs) on Jan 2nd, down to circa 323p by close, currently.
In fact, I don't even list up the stock ranks movements for my own portfolios, but after doing this exercise, think I will add that job to my list of monthly actions, as currently I'm a bit ad hoc in monitoring my shares individual S/Rankings, and tend only to look when 'I get into trouble' :)
Here are the latest Stock Rank ratings for the first quarter of 2018 ending on April 2nd:
Name
S/Rank
S/Rank
S/Rank
S/Rank
2/1/18
2/2/18
2/3/18
2/4/18
SCS
100
99
100
99
TW.
99
98
97
95
BMY
99
98
98
100
GFM
99
99
98
99
MGNS
99
91
93
91
STHR
99
96
96
91
LSL
99
98
98
86
OCN
98
97
95
99
PLUS
98
96
99
99
SND
98
98
96
97
TATE
98
96
91
85
STCK
97
95
95
80
VTC
95
94
91
91
BP.
95
94
77
92
INDV
95
88
93
93
FORT
94
94
93
95
RPC
93
88
88
77
VOD
90
92
86
83
JEL
85
85
84
80
VLE
83
77
78
77
Bold = those shares that have increased their S/Rankings.
Italics = (one share only) = no change.
All the rest are down from their Jan 2nd initial S/Rankings.
- At the start back in January, there were only 2 shares selected that were below S/R90 but now there are 7 shares below S/R90. (Both the initial selections below SR/R90 were contained within the 8o's but now of the 7 below 90 there are two of them that have descended into the 70's).
(Will post the NAPS list of SP increases/decreases shortly).
Great work to all that have contributed here, It’s jest a thought that really this should be viewed against an overall market comparison if the market was up 10% over the same time frame that’s not a great start to the year , if however the market has fallen by 10% it’s not as bad as first it would seem.
Maybe a comparison could be added to provide perspective.
Thanks for this thread iv found it most useful.
Thanks Velo. I am sure that you or Ed will update us at the end of what is bound to be a rocky month.
I'm sure many of us are tracking the NAPS in a folio. It might be a good idea for Stocko to create a Fantasy Fund to track the NAPS as it does for the Guru screens.
Totally agree. I'm amazed that they haven't done so.
It is a good idea
I am hoping to update more fully if I get time... but the 2018 NAPS is down 5.2% since the start of the year - less than the indices at the moment. Last year's NAPS (if not rebalanced on Jan 1st) are down around 12% since the start of the year. This kind of stresses the point of rebalancing - it helps manage risk & lowers volatility.
More speculative stocks like IQE which had grown to such a big portion of the portfolio in 2017 are now rebalanced out, and the weightings realigned - so big reversals in positions such as this have a much lower impact. Some call this 'volatility pumping'.
It's the speculative and highly speculative stocks that are taking the biggest beatings in the market at the moment. They all got over-extended last year. The greater weighting to lower volatility Conservative & Balanced Risk Ratings in the 2018 NAPS should offer a little more downside protection.
I’ve been running a (demo) NAPS portfolio chosen as a snap shot this weekend and it’s down 2.9% in 2 days—I guess this proves the point that jumping on a sinking ship is never usually the correct play.
"Hostage to fortune" time, but here goes...
I tend to believe that a Value Rank above 75 hints at underlying problems for the stock in question, and a Value Rank in the range 25-75 is preferable.
So before too much more of the 2018 year goes by, here is a table of NAPS 2018 stocks sorted by Value Rank. My hypothesis is that the first eleven stocks (with Value Rank <= 75) will outperform the 20-stock portfolio.
The metrics above are based on the earliest date in 2018 that the stock report has a print page for. Usually this is 6-Jan but occasionally it is later.
Something I had not realised before is that although the Quality Rank is fairly stable, the Value Rank jumps about quite a lot as the price moves. So it is possible that the exact set with Value Rank <= 75 might change depending on the exact date used, because there are quite a lot of stocks hovering around the 75 mark.
As an aside I would probably tend to choose stocks with Q>50 too, but in this case the only stock with Q<50 is also eliminated by V>75.
Way back on 30th January last year I conjectured that choosing stocks with a Value Rank in the range 25 to 75 would eliminate stocks which were under or over priced and hence give a more stable portfolio.
I called it a "hostage to fortune" at the time, and here are the results of the portfolios.
In the first half of the year it looked as if the "MIDV" (only Value Rank in range 25-75) portfolio would indeed out-perform the original NAPS. However curiously enough, once the downturn started the choice of mid-valued stocks did nothing to help the MIDV portfolio's performance compared with the original NAPS. They ended the year extremely close.
Perhaps the most interesting thing in retrospect is that a portfolio with only 11 stocks has performed almost exactly the same as a portfolio with 20 stocks.
Obviously this is only one experiment, but it looks as if this particular tinkering with the system has not yielded any obvious benefit.
My (non-UK) tax year is the calendar year. I spend a fair amount of time each December computing whatever capital gains I want to realise, then harvesting capital losses to offset as much of the CGT liability as I can. The point is that this distorts the rebalancing procedures described above, and shares get sold that might not otherwise get sold in the absence of CGT. Gus makes a good point that you can sell personally-owned shares and buy them back simultaneously in a tax wrapper such as ISA (unless anti-bed and breakfasting rules in your country prevent this).
CGT damps the effect of both profits and losses. In a recent episode I noticed a (unmarketable private equity) share I owned in a company that was in difficulty would be worth more to me if the company went bust, due to the tax loss, than if it survived and limped along with my equity value less than the potential tax loss. This extreme example illustrates how important this tax factor is in investment decision making processes.
pd - there is a saying something along the lines of "don't let the tax tail wag the investment dog" (I'm sure when someone fired it at me some years ago it was worded more elegantly than that).
It's never, imho, 100% true as some consideration does need to be given to tax efficiency, but I do think it is worth bearing in mind.
Just thinking about the situation I think you are describing, I think the issue is : that an unrealised CGT liability (because you haven't yet sold) does not deplete the capital invested, a realised liability does deplete your capital as you need to pay the tax / have the capital on hand to pay the tax by the due date.
I can see that , but I think it is quite marginal.
To run some numbers (for the purposes of these examples I'm going to assume CGT of 50%, because the higher the number the more extreme the difference should be - I'm guessing though your CGT rate is 33%)
Scenario 1 :
By your rebalancing point Stock A has achieve a 30% gain.
You now have to chose whether to :
a. stick with A which (with the benefit of Tardis) will return another 30% gain. Or
b. sell and buy stock B which will return 30% (plus the transaction costs).
Case a. will give a net gain of 34.5% and case b 32.225% (because of the lower capital reinvested)
or conversely if we know that Stock B will return 30% (plus frictional costs) the stock A would only have to return 26.5% to match the net result. (You'd be a genius if you could differentiate the likely returns so accurately)
Scenario 2 (more extreme) :
Stock A has returned a gain of 100% and both stocks will return another 100% over the next "cycle"
Net gains are : stick with A 150% , trade into B 125% - that looks more material!
However, turn it on it's head and if stock B will definitely return 100%, stock A would still need to generate 75% to match it (and again that is a genius differentiation of prospects.)
In scenario 1, I would say that frictional costs (trading costs & spread on each of the buy and sell) are probably more significant than CGT, the balance switches in scenario 2 but even so frictional costs are not insignificant.
Overall though this reinforces the message that it you are to sell stock A to buy Stock B (whether for 'rebalancing' or other reasons) you need to be satisfied that the prospects of B are materially (can't define that) better than those for stock A.
In the context of NAPS & SNAPS - some stocks re-qualify anyway - perhaps one could set a rule that stocks already held have their SR upgraded by 'X' points before selecting the portfolio. I think this would be trial and error, but possibly interesting anyway as the 12 month holding period is entirely arbitrary.
I can certainly see a clear case for x= 0.5 (in the case of a tie, hold the existing stock), beyond that I suspect that in any case x would have to be pretty small.
To be honest though If I could guarantee a 30% pa return (with some of it tax shielded) I wouldn't be too fussed about marginal benefits.
Gromley
You make some interesting points. To address this I modelled an investment of 100 which gives a r% return every year for say 10 years.
Scenario A: You invest 100 for 10 years at r = 15% pa (Stockopedia client!), sell at the end and pay your (suggested) 50% CGT on the gain. Your net after tax capital is 252.
Scenario B: You invest 100 for year 1 for a gain of 15%. At the end of year 1 you realise, pay CGT at the same rate and reinvest for year 2 at 15% and so on similarly until the end of year 10 when your net after tax capital is 206.
That is an overall after-tax cash difference of 18% of the ending capital, equal to 46% of the starting capital, this is not an immaterial difference between Scenarios A and B. It represents a 2.2% compound after-tax return difference every year for 10 years (9.7% pa versus 7.5% pa after tax).
As you correctly surmise my CGT rate is 33% and at that rate the foregoing exercise gives a 14% better result in Scenario A, or 43% of the starting capital, and equivalent to a 1.7% pa compound after tax return differential.
For lower rates of return the differentials are reduced, of course.
I don't think the metaphor of the dog's tail adds to one's understanding of the CGT effects, or contains any wisdom at all. Capital gains tax management is an important feature of managing one's overall portfolio over time, tax cash flow is just one factor in the buy/sell decision making processes. The tax authorities are sharing approx 1/3rd of the investment risks I take, it's like having an investment partner, but I've had to provide his share of our capital ......
"The tax authorities are sharing approx 1/3rd of the investment risks I take, it's like having an investment partner, but I've had to provide his share of our capital ......"
That's heads the tax authorities win and tails they don't lose!
pka
Once you have used up your annual CGT allowance, it has no effect at all at the margin. Zero. So it is not a matter of apportioning the allowance across your disposals.
In the case of tax-advantaged accounts like ISA/SIPP usually there is a limit to how much capital you can have in such accounts. So my observations apply to the marginal trade in excess of tax-advantaged situations.
Tax effects: Regarding comments above on rebalancing and other steps that result in disposal of a share, I have been considering the impact of capital gains tax (CGT) on my activities, and the extent to which this should deter or defer rebalancing etc decisions. This does not seem to be much of a consideration for others in the above discussion. However it can readily be shown that if you have a share with an unrealised capital gain, and you sell this share and reinvest the net proceeds, until some later date, then if the percent return on the new share is the same as it would have been if you had kept the old share, you will end up with less after-tax proceeds upon eventual disposal of the new share. In other words, if you sell the first share and invest the net proceeds in a new share for a certain period, you need a higher rate of return from the new share up to its disposal at the end of that period, in order to achieve the same net outcome as if you had kept the first share for that same period. Perhaps it is intuitively obvious that crystallising a CGT liability reduces the capital base upon which you can earn returns.
A little algebra shows that the difference D between (i) holding an investment comprising original capital C plus unrealised gain P over t periods at periodic return r percent then selling and paying CGT at T percent and (ii) selling the investment for C+P and reinvesting the net proceeds at the same rate of return for t periods at the end of which the new investment is sold and CGT paid at T percent, is:
D = TP*(1-T)*[((1+r)^t)-1]
This assumes for simplicity that the rate of return on the new investment is the same as on the original one. There is a much longer formula if the rates of return are different, or to calculate the difference in rates of return that will result in D = 0.
The bottom line here is a perhaps intuitively obvious observation: rebalancing involves a tax cost, and too-frequent optimising of your portfolio will reduce your ultimate after-tax returns.
Hi gormanpd,
Thanks for your interesting post about the impact of Capital Gains Tax on one's activities. Your algebraic formula does not allow for the effect of the annual CGT allowance in the UK, which is £11,300 for individuals, although if one has a very large portfolio, then that effect becomes very small in percentage terms.
Of course, there is no CGT to pay if one's portfolio is in an ISA or a SIPP.
Hi gormanpd.
Thanks for raising the subject. Tax housekeeping is an often overlooked aspect of investing (well it is by me anyway) that can have quite an impact on returns. Presumably if you have already crystallised a substantial capital gain (for example via a takeover of a company you own shares in), the effect will be positive if you subsequently create an offsetting loss thereby increasing your net capital after a lower payment of CGT.
For example, I made quite a substantial gain this year when Ithaca Energy Inc (LON:IAE) was taken over that would have given me a big CGT liability. To offset this I’ve sold a couple of shares with big embedded losses ( Lloyds Banking (LON:LLOY) and Vodafone (LON:VOD) ) reducing the CGT liability and increasing my net investable capital. (In fact these have been bed and breakfasted into an ISA since I wanted to keep the underlying holdings, but that’s a different topic for discussion).
Gus.
Hi
Can I ask a ranking question. A stock can be the highest of it's industry group on the overall Stockranks, but then when you go into the individual industry group list, it isn't the highest, there can be the odd one or two above it.
Why?
EDIT: SOLVED - but possibly a feature improvement needs to be made for clarity.
Bug found?
Setting up the screen as follows:
All UK Exchanges
Market Cap (£) >= 25
Spread <= 500
Risk Rating excludes Highly Speculative
StockRank in Market > 90
=107 Qualifying
Top StockRank (100) = Globaltrans Investment (LON:GLTR)
However, remove the last rule and you get
=200 Qualifying
Top StockRank (98) = Persimmon (LON:PSN)
GLTR is not on the list at all. I caught this trying to find a Utility to complete the diversification. In Screen 2 you get 6 of them, highest is SSE (LON:SSE) (78). However, use Screen 1 with an SR cutoff of 80 and you get a completely different one, Jersey Electricity (LON:JEL) (85)! If you click "see screen as a checklist" at the bottom and search for GLTR, it says it should be on the list.
Am I missing something? It must have something to do with the "in Market" category in the SR rule. I don't quite understand how SR works with regards to this and "in Sector", "in Industry", vs not using the rule at all.
Furthermore, no Small Caps appear if you have a StockRank in Market > 90. Is that to be expected?
I think it is because when you get more than 200 matches to a screen it only reports 200. So when you remove the bottom rule you get the first 200 results it comes across and then it stops looking.
Plausible, would sound like a bug to me in that case.
Just wondering what you have this box, next to the get qualifying shares button, set to
As mentioned, only 200 stocks report even when there are more than 200 but perhaps you have to 'force' it to extract the top 200 by Stockrank by using this box.
By Jove, I think you've got it!
That would explain not seeing any Small Caps come through either. It was taking the top 200 results by Market Cap. I would say more clarity needs to be given on that. No asterisk next to the "200 qualifying" result nor anything on the checklist feature.
I'll edit my original message so no one else falls down the rabbit hole. Thanks for bailing me out.
No problem Mark. I hadn't realised that it could have this effect either. It is obvious once you know but not so much if you don't.
I've invested in European countries for close to 5 years now.
There are many solid countries in Europe to invest in, e.g. France, Germany, Switzerland, Norway, Sweden, Netherlands. I've also occasionally dipped my toe in Spain and Italy.
I've avoided Greece, Turkey, and more eastern european countries due to combination of broker practicalities (i.e. can I actually buy them?) and concerns (rightly or wrongly) over the governance of companies in that region.
The european stockranks include the UK, so a stock from france scoring a stockrank of 97 is being compared to the UK stock universe too.
Re; currency concerns ... by trading in just UK stocks aren't you exposed to the weakness/strength of the £.
At least by trading in companies using multiple currencies you hedging exposure to one currency.
Interestingly when I switched approach in 2013 to a screen based high QM strategy there were few UK candidates appearing on my screens which drove me into Europe and the US. Of late more UK stocks are appearing in my screens.
Best of luck
Phil
Hi PhilH
As a newbie investor and obviously new to Stockopedia, I have started dabbling in a CANSLIM portfolio and my own QM screen. I have access to USA, Canada, Europe incl UK and Australia and New Zealand. I would be interested in you screen's rules and your experience so far. I have found the portfolio to be quite volatile and initially had stop losses way too close (beginner mistake?) and got stopped out, but generally I find it too much effort for too little reward, but that is only after 2 months (as opposed to day trading)....so patience required. I now have 15%-20%-25% depending on share volatility with 20% the norm. My criteria are as in the image.
Alan
Hi Alan,
What are you trying to do with your high QM screen?
Is it based on a Guru Strategy that has performed well? For example a growth strategy has been the best approach in the US
How do you time your buys and sells?
Some observations ...
1) I would call that a high QVM screen rather than high QM due to thee inclusion of "ValueRank > 70"
2) For me, when selecting high QM stocks I want know what is driving the price higher. Robbie Burns (The naked Trader) & Minvervini are looking for EPS & sales growth. I'm personally not selecting stocks based purely on price momentum.
3) I look to buy on breakouts or new highs but the danger is that I'm buying in an over bought position. If one of my stock selections is to fail in the early days of holding it is most commonly as a result of this issue. I much prefer to buy a stock that has had a period of consolidating then breaks out, ideally with strong volume.
4) Personally, I also sift out stocks with poor balance sheets (current ratio, ptb), poor debt profiles (net debt vs op profit) and bankruptcy risk as this means that if a stock releases some bad news it is not going to be hammered as much as a weak stock
I don't hold stop losses with my broker. Rather I maintain a Google spreadsheet of holdings which allows me to monitor my stocks relative to my notional stop loss levels. Every night I can have a quick look at the spreadsheet to assess if the stock has bust the stop loss or preferably if I need to raise my stop loss due to price appreciation. If the stock has bust the stop loss I re-evaluate it and decide whether to sell the next day.
** WARNING **
Clearly I'm running a risk by not using automatic stop losses with my broker, however ...
a) I'm not using leverage
b) I select high quality stocks (typically High Flyers or Superstocks) that are somewhat defended against big drops. That said a market black swan event will decimate all portfolios and non-guaranteed stop losses will not be filled anyway.
My preferred approach is to say what will be will be in the event of a big market crash but that might not be the best attitude for others. Be careful! In the shock drops (not crashes) there have been over the last 5 years I have found that sitting still and seeing which stocks recover over a period of weeks allows me to limit losses from a sudden drop.
Only you can decide if the returns are worth the effort but as highlighted earlier I'm encouraging you to think about what you are trying to do. If I was after a particular level of return I'd be asking myself which Guru screens have demonstrated that return.
Not sure if that helps
Best of luck
Phil
The biggest challenge I have is how/when to trade horses!
Do i dump a stock that has performed well historically and still has price momentum in favour of a stock that meets my origianl screening criteria?
Ben highlighted the risk of style drift as a result of holding too long.
I've had this issue with Washtec which I've held for 2 and half years for a gain of 339%
I guess it's a nice problem to have!
Gromley
The European Stockranks are ranked across Europe as a whole, this includes for example Turkey. By way of illustration of my point, there are some Turkish companies with high Stockranks. Now, should I overlay a cautious attitude to Turkish accounting and corporate governance standards so as to subjectively filter out such companies for no good reason other than my own prejudice? This is a slippery slope towards stockpicking based on subjective judgements, the very opposite of the facility Stockopedia provides.
By the way I am just using Turkey as an example, no offence to any Turkish investors here. Maybe there are some great investment opportunities in Turkish markets. There are high-Stockrank companies from other eastern countries such as Romania too.
As my base currency is euros, I too would be very keen to hear about a Euro-Naps selection.
Concerns about the currency risks influence me to limit my exposure to UK shares.
However screening via the Stockranks of European (non-GBP) shares leads immediately to confronting one's biasses about Eastern European shares or shares from specific countries (say Turkey, for example). Many such companies with impressive financial statistics at first sight turn out, after digging into corporate documents, to be indirectly state-controlled or have other offputting features. But if for example I screen out all companies from country X, I am introducing a personal prejudice which is the opposite of objective factor-based investing.
Comments welcome.
gormanpd,
Just my inexpert thoughts on this. If I understand the general concept of the stockrank and other ranks, they are precisely that rankings.
So if a stock has a stock rank of 100 it tells you it is in the top centile of all stocks based on the factors used. It doesn't mean it is 1% 'better' thank something with SR 99.
I do not subscribe to the European data so I don't know how the SRs are compiled, whether they are ranked across Europe in its entirety or ranked individually within country - that would be material to understand and I'm not sure if the help features you have with you subscription would tell you that?
If they are ranked across the entirety of Europe, then I personally think you could safely exclude given countries - you are merely narrowing down your investment universe, which implicitly Ed as done with his NAPS portfolio (selecting only the UK). You would still be investing in the "best" x% of shares from your chosen pool
Even if the stocks are ranked individually by country, I still don't see the barrier to excluding specific countries, but I don't know how you would use the ranks across countries - it could be that (no offence intended to any nations just picking countries at random) a stock in the top centile in Sweden would only be mid-table in Germany.
So if you are going for multiple countries I think it would be important to understand how the rankings are constructed.
Also just to bear in mind I **THINK** most of the knowledge base behind the stock ranks originates from study of the UK market, so you may need to think about how fully transferable it is - If you read back for example there are suggestions that NAPS don't beat "the market" in the US and conjecture that this is because it is a "more efficient" market.
Intended as food for further thought only.
Regards,
Gromley
Decided to set up the 2018 NAPS in their own portfolio (plus a watchlist elsewhere, that also stores the 'startimg price' and compares to the current price) so I can compare inbetween Ed's updates on progress. I'll be more interested in how the stockank ratings for each stock and the progress of the SP, perform in relation to each other, than how much the portfolio makes, or doesn't make, over all.
Used £5k per stock as a default amount so just ever so slightly over £100k the lot. (£100,037)
Used the date in Ed's NAPS post above as the buyng date so trawled back to use prices from 2nd January for the lot. Already from then to Friday's close 19th Jan, there are 6 shares showing gains but 14 showing retraces.
Quite a few dropping 1 point in ther stockranks with one dropping 3 points. Think only one, showed a 1 point increase in S/Ranks. Overall the portfolio is showing a tiny fractionally increae of just over a quarter of a percent with 6 stocks making a gain - all the rest retracing.
One share is well out of kilter to the others by showing a 20% increase already! (Pluss500).
And without that four figure increase the portfolio would most probably have been down fractionally as a portfolio total, as the gain currenty is hovering inbetween £200 and £300 gain.
So the 6 gainers have, as a team, outperformed the 14 retracers to show a net fractionally small gain. The worst retracer being down over -6%
But trying to monitor the progress of the Stockranks ratings. (ie., is it best to buy whilst a stock has room to grow say 90, or does a 99 stockrank leave only one direction left to travel?) I intend to monitor that aspect more closely.
First complete month is in for NAPS 2018, and from just a gentle meandering since commencing on Jan 2nd - until that is one day, last Friday February 2nd, had quite a dramatic effect, pushing the NAPS folio markedly into loss at over 2% down with over half that loss occuring on Friday itself.
During January, several stocks increased their rankings, and several slipped down in the rankings. Friday changed all that and not one stock reamains up on the Jan 2nd rankings. With just 4 remaining the same as was on 2nd Jan.
5 stocks showed a capital gain, one was 0% nuetral - all the others were down. Approx £2k down in total on a £100k folio.
But more interested in the progress of the rankings. Here they are:
Name S/Rank S/Rank
2/Jan/18 2/Feb/18
SCS 100 99
TW. 99 98
BMY 99 98
GFM 99 99
RPC 93 88
FORT 94 94
MGNS 99 91
OCN 98 97
STHRE 99 96
LSL 99 98
PLUS 98 96
VLE 83 77
SND 98 98
VTC 95 94
TATE 98 96
STCK 97 95
BP. 95 94
INDV 95 88
VOD 90 92
JEL 85 85
And the % capital gains/losses -
% down % gain
PLUS 26%
VLE 10%
STCK 7%
JEL 6%
GFM 3%
LSL 0%
SCS -1%
INDV -2%
RPC -3%
STHRE -3%
SND -4%
VTC -5%
FORT -6%
BP. -6%
VOD -7%
TATE -7%
BMY -7%
OCN -9%
TW. -10%
MGNS -19%
Observations:
Surprisingly of the 5 stocks showing a gain, two of them are ranked below the S/R 90's. Second highest is Volvere @ S/R 77 and fourth highest is Jersey Electricity @ S/R 85
- In pole position is star performer Plus 500 which went into the lead from the off and has maintained that position throughout January, currently showing an impressive 26% gain!
Slightly surprisingly (for me) all the big losers at the bottom are all above the S/R 90's+
In fact of all those stocks down, two stocks in 2nd and 3rd position of least down are both rated at S/R 88 (INDV & RPC)
Only one month in; but intersting so far.
Interesting Velo
Is it possible to show how the portfolio has handled the sell off, as at today for example?
Thanks
Tiswas - saw your request earlier but busy then and at the mo'.
As Ed says, today's retrace has had a further dramatic impact on the 2018 NAPS. Currently I'm seeing worse at virtually 7% down (3% down occuring today! [intraday] ) with the £100k folio now approx averaging just over £93k in total.
Will post a full day's impact effect after close tonight.
Noticed when Ed said 5% down I had near 7% down at approx the same time. Wonder if Ed was forced to use mid prices when setting up the NAPS folio? I took the End of Day prices on Jan 2nd as the starting point and added all broker's fees, but beforehand also made an allowance for the ask/bid spread (set the prices up later in January, and could only find historic high's, low's open/close etc., so took the day I complied the starting point as indicative of spreads and apllied those spreads to each end of day price) which of course is higher than historic mid prices plus added full boker's fees, in this case HL's £11.95 per transaction fee and the stamp duty. That's why I have no decimal fractions in the percentages; only round figures, to ameliorate any differences (one share I posted as 1% down when in fact I had it showing as 1.8% down in the folio).
Not expecting Ed to have the time for detailed updates other than the quarterly or half yearly significant rebalance updates.
tiswas - apologies, I said I would return with an update but got tied up elsewhere. Can post a mini, quick-summary though, right now of the 2018 NAPS as it stands tonight on a £100K starting investment from Jan 2nd to tonight Wed 7th Feb.
The NAPS has closed at x3.3% down @ £96.7k - So it too has benefitted somewhat today.
However, only 4 stocks in profit now - all the rest in red. Not too bad considering world market events over past few days, I suppose. Those 4 stocks are:
PLUS 500 25.0% gain (S/R96)
VOLVERE 6.8% gain (S/R77)
STOCK SPIRITS 5.8% gain (S/R96)
JERESEY ELEC 2.8% gain (S/R85)
Holding the wooden spoon at the very bottom of the folio is tail-end Charlie, MORGAN SINDALL (S/R93) showing x17.4% down.
Dunno if your still tracking this years NAPS - but another month has passed us by... just wondering if you could give us an update?
Many thanks!
Yes I am dfs, should be able to post an update over this weekend as the 2nd of each month is the data point - so tonight's close is the same as the 2nd.
Racing to get just the barest details down before the weekend closes. The overall portfolio of the NAPS as at Friday, 2nd March 2018 close, stands at x5.2% down (ie., down x £5.2k) based on a £100k starting point.
(Can't get formatting to work)
Stock Rankings are:
Name S/Rank S/Rank S/Rank
2/Jan/18 2/Feb/18 2/Mar/18
SCS 100 99 100
TW. 99 98 97
BMY 99 98 98
GFM 99 99 98
RPC 93 88 88
FORT 94 94 93
MGNS 99 91 93
OCN 98 97 95
STHR 99 96 96
LSL 99 98 98
PLUS 98 96 99
VLE 83 77 78
SND 98 98 96
VTC 95 94 91
TATE 98 96 91
STCK 97 95 95
BP. 95 94 77
INDV 95 88 93
VOD 90 92 86
JEL 85 85 84
And the % capital gains/losses -
% down % gain
PLUS 20
GFM 13
VLE 1
STCK 1
SCS 0.4
JEL 0.2
VTC -0.7
FORT -5
INDV -5
SND -5
STHR -5
LSL -6
RPC -10
BP. -11
TW. -11
BMY -11
OCN -15
VOD -15
MGNS -17
TATE -20
HI velo
Great data many thanks for taking the time to do this.
By way of contrast FTSE All share 02/01/18 4202.53, now 3899,70 down -7.21%. Thus SNAPS 2% better than an index.
For those experimenting with international portfolios.
S&P 500 2695.81 (02/01), now 2691.25, -0.17% S&P 500 beats SNAPS by 2.3%.
NASDAQ 7006.90 (02/01), now 7257.87, +3.58. Beats SNAPS by 6.08%.
Suggests it is useful to look towards a mixed US/UK portfolio for a while if you are so inclined. Which luckily I began to do Q4 last year, but I have found I needed to adjust my investing style for that market.
Regards
Howard
Great stuff. Thanks. Interesting to see both the ranks and the price changes. My portfolio is factor driven but I reserve judgement on the final decision on whether a stock is selected. Hence I avoid stocks that I don't like. The net result of my added judgement? I have managed to exclude several in the top half of the table and include several of the losers. For example happily ploughed into Tate & Lyle (LON:TATE) where results and dividends look good and sustainable but excluded SCS (LON:SCS) where I am nervous of the impact of a slowing property and retail market. Demonstrates how we tend to overrate our own ability to add value.
As far as I am concerned Ed has published more than enough data for me to be able to judge the value of his method. I have benefitted greatly from following his work.
And, including the forthcoming price increase, it costs me just 61p per day! Incredible value!
Is it possible for you to point me in the direction of this data please?
Specifically with regard to the NAPS method, I would be interested in more information on:
- Performance adjusted for the chance of when it is ran e.g. by using rolling monthly periods.
- Long term performance / through different market conditions. Going back to 2013 is not very long, and doesn't cover a difficult bear market.
This would help objective comparison to other methods e.g. magic formula, other factor models. As I remember for the "magic formula" approach Joel Greenblatt used a database which allowed them to test against what data was available at the past points in time, did rolling monthly periods for testing, and even did percentile performance ranking e.g. did the second best ranked group perform better than the third and worse than first.
As you think there is enough data to judge the value of this method, could you explain whether it's better or worse than the "magic formula" method, and why? Appreciate you may not have done this comparison, but my point is that I don't see how you could compare it properly from the data I have seen so far (may be I haven't seen all the available information).
Hi Ed,
Have you shared already, or if not, could you please share historical analysis for the NAPS past performance? Appreciate there is an element of personal selection when you choose the shares, so the analysis would need to only focus on the top ranked shares, or some such methodology.
Essentially the NAPS / stockrank approach is a multi factor model. It would be interesting to see the historical performance figures for this approach, in a rigorous backtest. Joel Greenblatt compared his "magic formula" to various other factor models, and often as I remember his simple approach beat more involved multi-factor models.
I agree the recent NAPS performance has been great, but it is hard to draw much of a conclusion from a few years of results, especially given the market environment over that time, and element of personal selection which could introduce variance from the average outcome people would have experienced.
Thanks in advance if you can point me to some analysis.
@clouds - there's zero personal selection in the shares. Only in the rules. It's entirely systematic. It's the system I tweak, not the output.
I've only got data back to 2013 at the moment - but I rank this analysis about 12 months ago - https://www.stockopedia.com/content/some-stockrank-portfolio-strategy-returns-2013-to-2017-167857/
Thanks for the reply Ed.
I interpreted the rules as allowing some selection e.g.:
"Sector Diversification
•At least 1 from each sector, no more than 3.
•No more than 1 from each industry group. "
Although appreciate the above could be used as a rule, and then the computer tries to find the highest ranked within the criteria, including the above.
While not "personal selection", there is still an element of chance as to when you happened to run the selection process. If you had run a month later, you would have a different selection. This is fine, but to better understand the consistency of results you could run rolling years, from specific intervals e.g. each month.
Given you appear to be staking real money on this strategy, I'd have thought you would have done substantial analysis of past performance. Although I appreciate this may not be ready for sharing, or perhaps you rely on specific factor analysis you have done previously?
I'm not knocking the strategy, I just don't think enough data has been presented to allow an "outsider" to have confidence in whether or not it's a good method.
Hi RJG, I hear what you are saying, Thanks
Nbeeny said that he thought that Ed will be able to give me a more intelligent answer than him - and I am sure he will. I would certainly appreciate that, Ed
Nbeeny also pointed out the need to set a strategy or rules and abide by those rules. As a recreational PPG pilot, I fully appreciate the need for a set of rules.
Since I am new to Stockopedia I am still in the process of formulating the rules for selling. O'Neill or Ed??
It seems to me that there are three things; 1. What to buy? Stockopedia answers this question. 2. When to buy and 3. WHEN TO SELL ??
you'll find some words from Ed about selling in the NAPS webinar:
https://www.youtube.com/watch?v=iHelypnOZiA
A general comment here for those monitoring and considering this approach... And yes, it's one person's experience in isolation and not advice, caveat caveat caveat but -
I too was interested at the start of 2017, off the back of an email-shot about NAPS, so bought a year subscription to read the full article, sold about 20% of my portfolio (that I was prepared to) and trialled the approach by handpicking I think 6 or 8 stocks using the NAPS approach (some were already in my portfolio). I picked stocks that had best yield and div cover I think. At the end of the year, there were more up than down and those that were up, increased more than the losers decreased. Very happy.
I've now subscribed for 3 years and have increased the % of my portfolio that reflects NAPS approach. I'm probably still at only 40% of my portfolio operating this way and, as with all of these things, I'm sure some years will be worse than others.
I'm no expert compared with some but giving it a go with a % as a trial has been excellent for me.
Furthermore your article is useful and should assist in using Stockopedia more gainfully.At tbe moment i am using another stock picking program but i plan to have another trial of Stockopedia if available.
I have done very well on the NAPS strategy as well. I chose to exclude utilities, financials, telecoms and and energy from my strategy when I set it up. I failed to rebalance last year and still did very well on the previous years companies.
The reason is that 3 of those industries are huge companies that are steady performers rather than outstanding stars, some of the stars are potentially boom and bust so I wanted to avoid. Telecoms is in long term decline as everything moves online (I figure the stars are in technology rather than telecoms).
I guess that may bite me one year, but so far it has worked out very well.
Maybe I need to do a more serious rebalance this year,
Hi Ed,
I am very. impressed with the site and I now have two NAPS portfolios. One is UK shares, similar to yours and the other one is World shares. The 2018 World shares portfolio is obviously more diverse than the 2018 UK one and is doing about 3 times better 2.73% for World NAPS vs. 0.87% for UK NAPS. I did cheat with the World NAPS by including Google which has a StockRank of 84 ie. < the 90 cut off.
My question relates to balancing. The article on your site, "When to sell" by O'Neill recommends selling assiduously when %Gain drops below 7 to 8%, also when %Gain rises above 20%. Yet you recommend balancing only once a year or at best quarterly. Plus 500, my worst share, has a %Gain of -8.96% which conforms to O'Neill's selling criterion. but should be kept if conforming to your balancing criterion. As a matter of principle, what should one do? I am not asking for advice but rather clarification of principle. Confused. Many thanks. John
I have been pondering something similar myself.
I think that Ed will be able to give you a more intelligent answer than me - and I am sure he will.
But, my thinking from the reading I have done, is that you need to set yourself a strategy or rules and abide by those rules.
So you need to decide if you are going to sell when the stock drops by a certain percentage or hold and rebalance periodically, or whatever other strategy you have formulated.
You decide and you stick by it. Unless, perhaps, if something really catastrophic happens - but of course you should have already decided what you will do if that ever happens.
Hi John
I believe that the original intention with the NAPS method was to buy and hold for a year (or six months in the case of SNAPS) and not sell anything until that time, regardless of price movement up or down. That said, each individual will have their own opinions on what is best to do and can vary their own NAPS rules accordingly.
Some food for thought...
I started a NAPS portfolio last August and decided to allow myself the option to sell stocks in the portfolio in the event of bad news or a drop in price of 15%-20%. I also decided to top slice shares if they rose by 30% or so in order to lock in profit. In other words, I gave myself permission to fiddle (which, of course, is the complete opposite of what NAPS is all about). Anyway, in the last five months, my 'fiddled with' portfolio is up 10%, which I am more than happy with however, if I had just left everything alone as it was on day one, the portfolio would be up by 13%.
Of course, five months is an incredibly short period of time over which to measure anything but the difference in performance to date is significant and illustrates the whole point of the NAPS, which is to set and forget.
As I said, everyone will have their own ideas about what works best but I am now keeping my fingers away from the buy/sell buttons and will review things in August (like I should have done in the first place!)
Hi belazela,
I have to strongly disagree with you. The stocks I select are picked as a result of screening fundamentals and timing purchases/sales based on technical analysis. I no next to nothing about the companies I invest in over and above the preview given by Stockopedia.
I'd argue that my risk taking is more calculated than many as I understand my limitations, i.e. I don't kid my self that i can 'understand' businesses models/markets/personalities/products from a wide variety of industries/markets. I embrace my naivety and it enables me to not be seduced by a stock, a story, the charms of CEO's, bulletin boards, 'experts', etc.. If they fail to perform I cut them and move on. No hand wringing.
But to further emphasise the power of naivety the Guru Strategies tracked at Stockopedia also have no knowledge of the the companies that they select, yet several have very excellent track records with limited drawdown.
If you're not convinced by my words then please take a look at my fantasy fund which mirrors my personal investments apart from the fact that I didn't start with £1m.
Why not look for a Guru Screen that appeals to you, create a copy of it and setup a fantasy fund that follows that strategy. No filtering of the screen results, no using your 'knowledge' to deselect some candidates. Try it out and see what happens? You might be surprised.
Best of luck
Phil
Thank you very much, will do. I like the Guru screens, excellent filter.