New Year NAPS - Top Stocks for 2017 and how to play the Joker

2016 has been a remarkable year in the markets with Brexit and Trump creating so much market volatility. In this climate, it’s been proven to be a year for the stock pickers. The wonderful Paul Scott - who writes the Small Cap Value Report daily (now with Graham Neary) on Stockopedia - has absolutely smashed it in 2016. He runs his “Beam me up Scotty Fantasy Fund” on the Stockopedia site which very much reflects his conviction personal picks. After a moderate 2015 (up about 15%) it’s more than doubled in 2016 after a string of stunning wins including Boohoo, Avesco, Lavendon, Gear4Music and MySale. Anyone who has the dedication to follow Paul’s daily blog will have been able to learn about his selections and quite possibly will have mirrored some of his success. Credit to those who have and congratulations to Paul. You can follow Paul & Graham’s daily email update here.
But there are other approaches to the market which don’t take quite so much time and effort but still provide a solid probability of beating the market. And that’s where my own interests lie. As a 41 year old with 3 kids and the Stockopedia business to run I don’t get the time I used to to do the due diligence on individual shares. But in all my research over the last 2 decades, I’ve also learned that I don’t need to. As it’s the turn of the year, it’s time for me to elaborate on this and return to what’s becoming a Stockopedia tradition - The New Year NAPS.
Two years, and tens of thousands of readers
The NAPS portfolios have generated extraordinary interest in the last 2 years. The initial 2015 article has been read more than 40,000 times, while last year’s 2016 piece has been read more than 60,000 times. | don’t know if the articles are being read tens of times per reader, or whether they are more widely shared, but the simplicity of the stock selection philosophy has clearly hit a chord with many. At its core here it is:
Select the 2 shares with the highest StockRank in each of 10 sectors (ignoring microcaps) to create a portfolio of 20 shares. Rebalance.
This disarmingly simple strategy has a couple of key principles behind it.
- The first principle is that in a diversified portfolio stock selection doesn’t matter. The more you diversify a portfolio, the more individual picks cancel each other out.... what remains is an overall portfolio exposure to ’factors’. So designing a portfolio's exposure to those factors that have tended to drive long term stock returns makes sense. We use the StockRanks to ensure a high exposure to the quality, value, and momentum factors.
- The second principle is that rules neutralise behavioural biases. By implementing a rules-based process we hope to be able to reduce the kind of self-sabotaging behaviour that so damages most individual investor returns.
For those who need to catch up on the NAPS basics a good place to start is this transcript of a webinar I did at the end of 2015. Alternatively, you can read more about the journey in the following articles:
- 2015 New Year NAPS - the initial simple rules.
- 2015 Semi Year SNAPS - on rebalancing, sloth, and diversification.
- 2016 New Year NAPS - on luck and a tweak of the rules.
- 2016 Semi Year SNAPS - on risk and large cap outperformance.
Reviewing the NAPS Performance to date
The NAPS approach has led to some stunning returns. The following chart shows the 2 year performance history of the NAPS portfolio (picked in 2015 and rebalanced in 2016) and the SNAPS portfolio (rebalanced every six months) both in shades of blue. The green line, for comparison, is the undiversified top 20 stocks by StockRank rebalanced annually, while the grey line (languishing underneath) is the performance of the FTSE All Share.
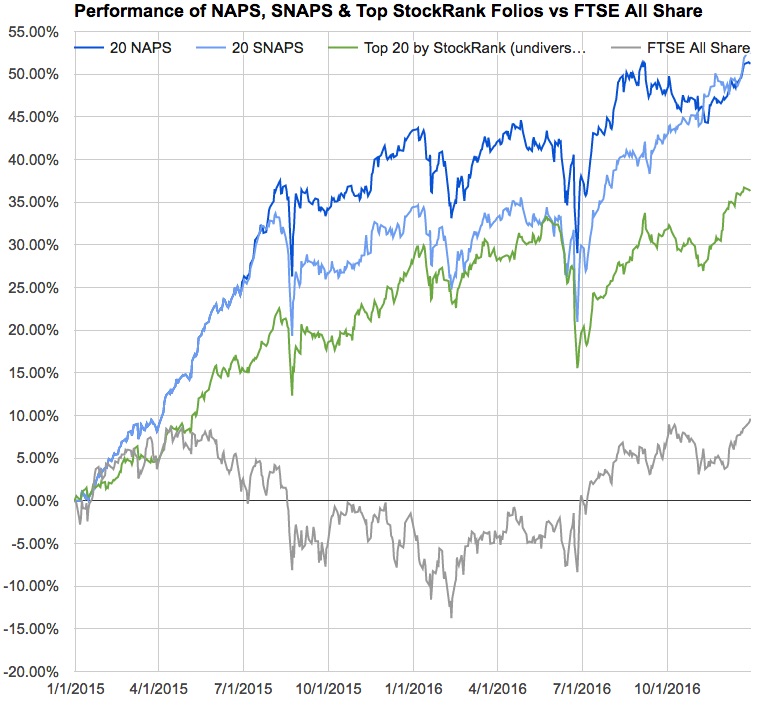
Over the last 2 years, both the NAPS and SNAPS portfolios have returned over 50% (before dividends & transaction costs) versus barely a 10% return for the FTSE All Share. This might not be at Paul Scott levels of performance, but it’s a stunning return for a strategy that has taken barely a few hours per year to execute.
It’s notable though that 2016 has seen nowhere near the outperformance of 2015. The FTSE All Share returned 12.5% versus 13.9% for the SNAPS and only 5.4% for the NAPS.
But these portfolios are UK portfolios and the UK markets have been quite quiet this year. Every month I hear stories in comments about how the NAPS process has been adapted for foreign markets or how someone has tweaked the rules to suit their own specific investment approach in dividend stocks or otherwise. I keep hearing about how others have returned 25%+ in 2016 by diversifying internationally or focusing on QM stocks.
So in the interest of harvesting the NAPS hive mind, I have a request. If you are running a NAPS style portfolio please could you answer a few questions about your own process in this survey : https://www.surveymonkey.co.uk/r/3TG85FW.
How market shocks should trigger a rebalancing
If you remember - the 2015 NAPS had a stunning hit rate. 19 out of 20 stocks selected were ‘winners’ which led to the 43% annual performance. I elaborated clearly at the start of last year that this was a lucky set, but we likely generated our own luck from a good process. This year it’s been an even split - 50% winners, 50% losers.
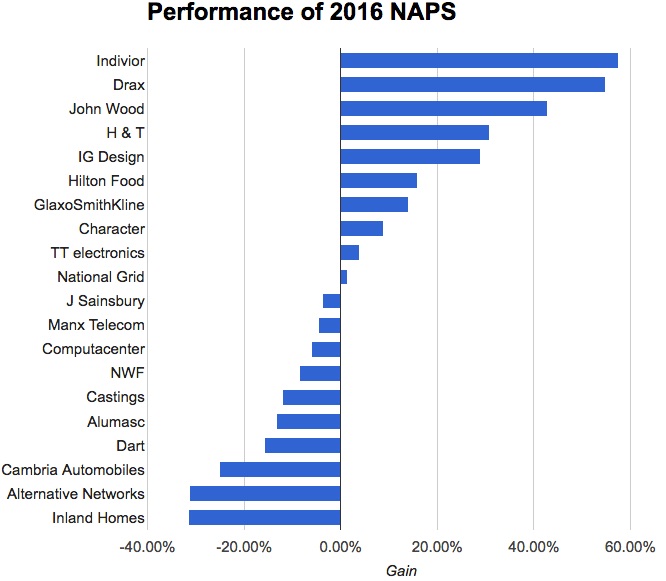
IG Design (last year’s top NAP) continued its strong momentum, but the standout winners of 2016 were some contrarian selections that most investors wouldn’t touch. Indivior, Drax, John Wood and H&T Group. The contrarian selections paid off, but there have been also been a few napping dogs in there too like Inland and Alternative Networks.
Remember Brexit? Brexit caused a massive realignment of the market. It happened towards the end of June and knocked the socks out of stocks. When a big macro event like this happens, leadership of the market rotates. We saw a big move into international large cap stocks and a rotation in favour of growth stocks. At these times valuations swing wildly as does momentum.
Value and Momentum are the most important ‘factors’ that have historically driven stock returns. They are also the two main pillars behind the Stockopedia StockRanks. If valuation and momentum change dramatically due to a big market shift it makes sense to realign any portfolios built on them. From this perspective, it is unsurprising that the July 1st “SNAPS” portfolio has dramatically outperformed in the last 6 months with an 18% average performance versus only 9.5% for the NAPS.
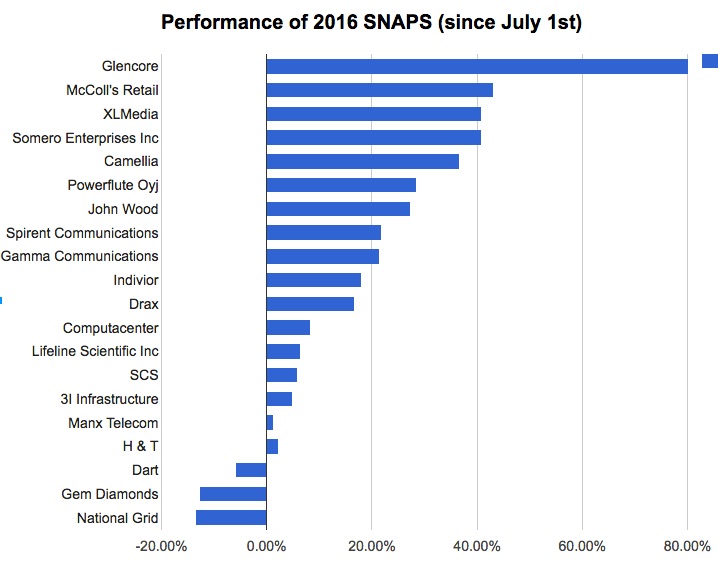
This performance has seen the half-year rebalanced SNAPS portfolio overturn the performance advantage of the annually rebalanced NAPS portfolio. We’re starting to see the performance benefit of more frequent rebalancing in the SNAPS, but it comes at the expense of greater transaction costs so the jury is still out.
Professor Andrew Ang of BlackRock is the foremost authority on factor investing (of which StockRank investing is just a subset) who states that “rebalancing is one of the simplest and yet one of the most powerful ways of buying low and selling high.” It’s the best way to profit from market volatility.
So there's a key lesson here in how to play the "Joker" of market turbulence mentioned in the title of the piece. It may be sensible to rebalance on an ad-hoc basis after big market shifts to realign with valuation and momentum. So if the joker card hits the table... deal yourself a fresh hand.
Diversification - Large Cap Defensives to the Fore
Two of the big ‘anomalies’ that academic financiers focus on are size and value. Small companies tend to outperform big companies, while cheap stocks tend to beat expensive stocks - as a result many focus on ‘small cap value’ as a perennial strategy. But just because something outperforms in the long run, doesn’t mean it will outperform every year.
Here’s an illustration of quite how much large cap defensive stocks contributed to this year’s performance in the NAPS:
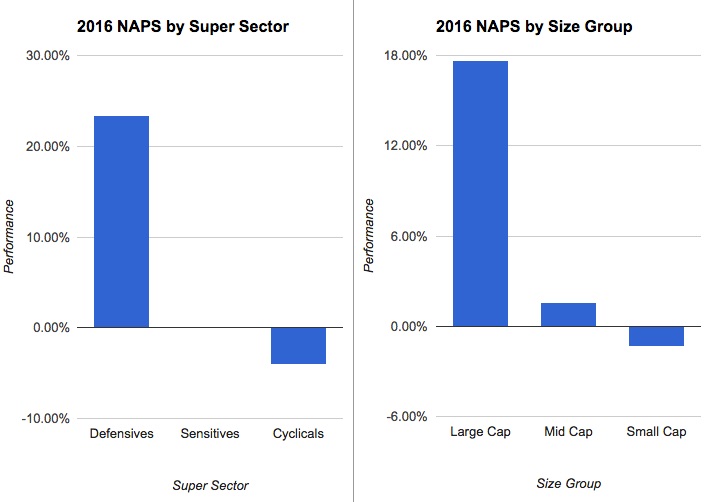
To hedge against this risk, size and sector diversification can pay off, so I will continue with it in this year’s selections. It’s not sexy, but it works far better than most give it credit for.
Random StockRank Portfolio Outcomes
Last January I explained how the 2015 portfolio was an extremely ‘lucky set’. There were 19 winners out of the 20 stocks - an extraordinary hit rate. I deemed it highly unlikely to be repeated in 2016. This year, with only 10 winners out of the initially selected 20 stocks, we’ve certainly seen a big reversion back to the mean. So I’ve been wondering all year just how unlucky has the 2015 set has been?
To answer this, I have generated 100 randomly constructed portfolios from all the shares that had a StockRank greater than 90 on January 1st 2016. I’ve then tracked the performance from the start to the end of the year and published the results in a histogram. The year’s performance is on the horizontal axis, while the height of each column is defined by the number of portfolios in that range.
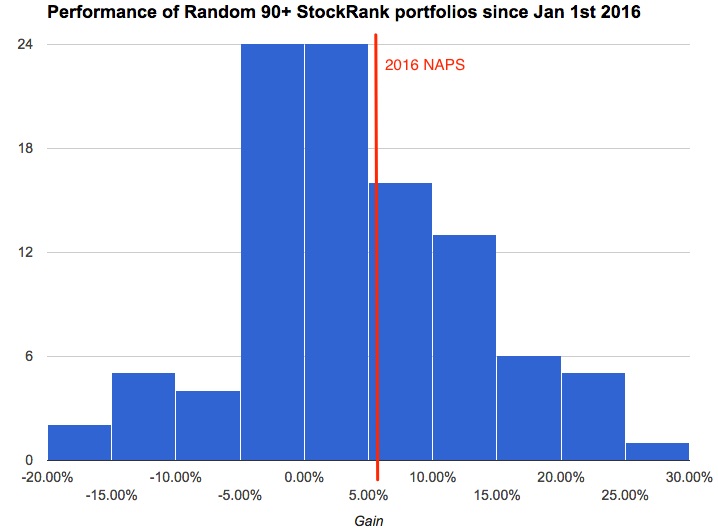
As you can see the 2016 NAPS at a 5.4% return performed better than the typical 90+ StockRank portfolio. It’s a similar story with the SNAPS - which were just above the middle of the range too. If your own portfolio constructed last January returned something like 6% you shouldn’t feel bad if you’ve lagged the indices… you’ve probably outperformed !
Unfortunately, the popularity of the benchmark indices run by FTSE, S&P, Dow & MSCI have led many investors to think they have underperformed in 2016. But these benchmarks are unrepresentative of the typical portfolio. They are market cap weighted and dominated by just a few large shares. Personally, I think it’s time to give these indices the boot. It’s better to benchmark against an equally weighted index or a benchmark based more closely on your own investment universe.
The Top Stocks for 2017
So in summary, this year may have been a moderate one for the UK NAPS, but after further analysis, I’ve grown in confidence about the approach. The extra diversification I put in place at the start of 2016 (to select one stock in each industry group and to split evenly across large caps, mid caps and small caps) appears to have reduced the likelihood of underperformance without stopping the probability of outperformance (as the SNAPS have performed strongly in the last 6 months).
So this year we’re sticking mostly to the 2016 rules laid out in detail here. (We’ve slightly adjusted our market gcap cutoff for small caps up to £225m.) Internationally diversified NAPS portfolios appear to have dramatically outperformed, but in the interests of consistency, I will be sticking to a UK portfolio. Please remember that this is not a list of 'tips', this is the output of a systematic investment process I favour. As ever, it's important to DYOR to find & understand the investing approach that suits your own risk appetite. Once again, thanks go to Ben Hobson and Alex Naamani for doing the research and write-ups on the following shares which make up the “Top Stocks for 2017”.
Basic Materials
Mondi Industry: Containers & Packaging, Market Cap: £8bn, StockRank: 93.
Mondi is a FTSE 100 paper and packaging company with a vast operation that begins with forestry and ends with just about every kind of packaging you can think of. Despite its already large size, Mondi has an impressive growth track record, supported by acquisitions. Its margins, return on capital and return on equity are well into double figures, suggesting a business that’s building a strong, defendable market position. The company reports in euros.
Company Statement: “We expect to benefit from stable to higher selling prices in a number of key product segments as we move into 2017 following the downward pressure seen over the course of 2016.”
Central Asia Metals Industry: Metals & Mining, Market Cap: £253m, StockRank: 98.
Small-cap mining stocks have been the stuff of nightmares for investors in recent years. With the exception of dabbling in diamonds in 2015 (Gem Diamonds), the NAPS rules have generally kept the portfolio well away from anything that needs a pickaxe. Not anymore. Kazakhstan copper miner Central Asia Metals makes the list for 2017. It runs what is currently a very profitable mining operation that is on course to expand further in the coming months. CAM reports in dollars and even pays a dividend. Do read Roland Head’s recent report.
Company Statement: “We are delighted to report record quarterly production from our Kounrad plant, and expect to achieve annual copper production towards the upper end of the 13,000 to 14,000 tonne guidance range.”
Energy
Exillon Energy Industry: Oil & Gas, Market Cap: £224m, StockRank: 100.
It’s undeniable that small-cap oil & gas companies have their own unique challenges, and Exillon Energy is no exception. For a start, it’s a Russian company with acreage in Russia and West Siberia - territory that tends to worry many investors. It also has a very influential major shareholder in the form of Russian billionaire and RusOil owner, Alexei Khotin. But from a performance perspective - particularly given a rising oil price - Exillon looks like a remarkably interesting bet in this sector. Risky? You bet.
Company Statement: “The first six months of 2016 were successful for Exillon. Despite the continuous volatility of oil prices, we delivered strong financial performance with significant recurring EBITDA and net profit.”
Petrofac Industry: Oil & Gas Related Equipment and Services, Market Cap: £2.95bn, StockRank: 90.
Oilfield services groups John Wood and Lamprell have both made it into previous NAPS portfolios, but it’s Petrofac that takes top spot this year. Oil prices strengthened in 2016 and the sector enjoyed more appeal because of its perceived immunity to the UK economy, dollar revenues and international exposure. Petrofac has had to deal with industry pressures but it appears upbeat about the outlook. A sustained recovery and return to profitability could win more investors over. Read the Roland Head report here.
Company Statement: “We remain very focused on maintaining our cost competitiveness and discipline in a competitive market, and are well-positioned for a recovery in our core markets."
Healthcare
Indivior Industry: Pharmaceuticals, Market Cap: £2.1bn, StockRank: 99.
Indivior has been a presence in the NAPS for a long time. It’s a consistently high ranking pharma spin-off from Reckitt Benckiser that saw a big price gain in 2016, but there are still concerns. While new products are on the horizon, Indivior remains a one-product business (its Suboxone medicine is used to treat opioid addiction). And while Indivior is seeing faster than expected growth in the US, the cost of litigation to protect its position is now running into hundreds of millions of dollars. Read the Roland Head report.
Company Statement: "Our performance this year to date continues to be strong. This is the third consecutive quarter of net revenue growth, with our development reflecting the growth in the market.”
Caretech Holdings Industry: Healthcare Providers & Services, Market Cap: £196m, StockRank: 96.
Caretech provides support for young people and children with complex needs, which is an under-supplied market that is growing quickly. The company’s 2016 results impressed our resident analyst, Graham Neary, and the results point to a business that intends to grow much further. Price and earnings momentum picked up well in the latter half of 2016, but the value appeal remains intact and quality is improving. Read the Graham Neary report.
Company Statement: "With the money raised from shareholders last year, from the ground rent transaction this year and our own free cash flow generated from the business, we have major investment plans for 2017 and beyond with key new organic developments and bolt-on acquisitions.”
Utilities
Drax Industry: Electric Utilities & IPPs, Market Cap: £1.53bn, StockRank: 96.
It was with a heavy heart that we put Drax in the 2016 NAPS portfolio. It was a business facing regulatory pressures and earnings forecasts were being slashed. There wasn’t anything good to say about it and no-one seemed to like it (apart from Neil Woodford !). The shares went on to rise by 45% through the year, making it a star performer. Everything now looks brighter - biomass conversion subsidies have been approved and a new strategy is taking shape. Earnings are still uncertain, but it looks a very different proposition from last year.
Company Statement: “Drax has been exploring options to further improve earnings quality and deliver targeted long-term growth, evaluating opportunities to diversify across the markets in which it operates - pellet supply, generation and retail.”
Fulcrum Utility Services Industry: Natural Gas Utilities, Market Cap: £80m, StockRank: 87.
Fulcrum qualifies as a utility because it plays a role in hooking up developments to the gas and electricity infrastructure. It also operates gas pipelines. Shares in the company doubled in price to more than 50p in 2016, and brokers have been notching up their earnings forecasts. Like all small companies, the risk with Fulcrum concerns its ability pull off fast, well managed growth without any nasty disappointments. Read the Graham Neary report.
Company Statement: “The company has continued to improve its performance and strengthen its balance sheet. Trading performance this year to date is strong and prospects for the rest of the year look positive.”
Industrials
Wizz Air Holdings Industry: Passenger Transportation Services, Market Cap: £1.03bn, StockRank: 99.
Wizz Air narrowly missed out to Dart Group in the 2016 NAPS, but takes one of the two industrials slots this year. On the downside, airlines are notoriously difficult for investors to assess. With this one, there has been a sharp pullback in price caused by the EU referendum and there has been some director selling in recent months. But the stock scores very well against the StockRanks, and the recent price recovery is encouraging.
Company Statement: “We remain highly committed to the UK market and continue to deliver double-digit growth on our UK network. Nevertheless our highly diversified network enabled us to quickly absorb capacity we reallocated in reaction to the weak sterling following the Brexit vote.”
Morgan Sindall Industry: Construction & Engineering, Market Cap: £333m, StockRank: 98.
Shares in Morgan Sindall slumped after the EU referendum, and it’s clear that the outlook has become less certain on the result. However, its share price has since recovered and the company appears to be trading well. It’s a low margin business but there are signs of quality. Moreover, the company looks attractively valued against the StockRanks and momentum is particularly strong.
Company Statement: “For the current year, however, based upon current trading patterns, our high quality secured order book and the visible pipeline of opportunities, the group is on track to deliver a full year result slightly above its previous expectations.”
Technology
Computacenter Industry: Software & IT Services, Market Cap: £981m, StockRank: 96.
Computacenter first entered the portfolio when it was brought into the 2015 SNAPS, and it’s been a holding ever since. The company specialises in IT infrastructure and has operations in the UK, France and Germany. It’s a consistently high quality, highly cash generative company with reasonable valuation and momentum scores and an upbeat outlook. . Read the Roland Head report.
Company Statement: “Prospects for 2017 and beyond, particularly driven by the increased adoption of the digital workplace, are encouraging across all our geographies.”
IQE Industry: Semiconductors, Market Cap: £256m, StockRank: 93.
IQE makes semiconductor wafers and in September released a very bullish trading update with profits up 61%. This has helped drive the share price in recent months and the brokers have started increasing profit forecasts. The stock looks attractive across a range of metrics and has begun qualifying for several key Stockopedia screens favoured by GARP investors. Read the Graham Neary report.
Company Statement: “IQE's trading has continued to be strong across multiple markets, particularly in the photonics business. As a consequence, the Group announces that it is on track to deliver FY 2016 revenue and adjusted1 operating profit ahead of expectations.”
Consumer Defensives
McColl’s Retail Industry: Food & Drug Retailing, Market Cap: £209.6m, StockRank: 98.
With 1,001 stores across the group, McColl’s has been growing fast in the convenience shop market in recent years. It’s a low margin business but there are signs of big ambitions here. The stock has a good (and improving) quality profile and it looks cheap despite decent price strength since the EU referendum. Read the Roland Head report.
Company Statement: “The business has traded robustly in the final quarter with total sales for the full year up 1.9% and we expect our overall financial performance for the year to be in line with the Board's expectations.”
Finsbury Food Group Industry: Beverages, Market Cap: 94, StockRank: £154.5m.
The original contender for this position in the portfolio was Stock Spirits, but that was sacrificed for a smaller company for diversification reasons. Finsbury Food is an acquisitive food manufacturer that’s seen strong momentum in recent years. It has some good quality characteristics and isn’t particularly expensive despite decent momentum. Paul Scott has given it the thumbs-up in the past. Read the Paul Scott report.
Company Statement: “Looking ahead our strongly performing businesses and a robust balance sheet positions us well to both take advantage of growth opportunities and mitigate challenges ahead.”
Consumer Cyclicals
Quarto Inc Industry: Media & Publishing, Market Cap: £61.0m, StockRank: 99.
Quarto is a book publisher with core operations in the UK and the US (it reports in US dollars). Earnings have been growing consistently in recent years and that’s forecast to continue. Its shares performed very strongly in 2016, and this is a stock that scores very well for all three quality, value and momentum factors. Paul Scott says he’s wary of the company’s debt, but he’s warming to it. Read the Paul Scott report.
Company Statement: “On the basis of current levels of trading and order book visibility, the group remains confident that it will meet management expectations for the full year and deliver both debt reduction and earnings growth.”
Games Workshop Industry: Leisure Products, Market Cap: £215.2m, StockRank: 99.
Shares in Games Workshop looked to be in serious decline through much of 2016 but the price rebounded after the EU referendum and it’s now hitting new highs. This is a stock that continues to confound onlookers. It’s looking more expensive than it was just a few months ago, but the exceptionally strong quality and momentum mean we can’t ignore it. Read the Paul Scott report.
Company Statement: “Over the first half we have seen strong sales and profit growth in constant currency terms. Sales and profits have further benefitted from the favourable impact of a weaker pound. Royalty income is also expected to be ahead of the prior year.”
Financials
3i Group Industry: Investment Banking & Investment Services, Market Cap: £6.63bn, StockRank: 96.
Shares in the private equity giant 3i, finally got back to pre-crisis levels during 2016, and the price has continued forge ahead. It’s that surging momentum, backed up by strong earnings upgrades throughout the year, that are a real eye-catcher. It’s fair to say that there are a lot of moving parts in the financials of a private equity group like this, but against the StockRanks, 3i looks reasonably priced and reasonable quality, too.
Company Statement: “Our robust balance sheet and diverse portfolio, together with the rigorous approach of our investment processes, underpins our confidence about the future success of the group.”
Record Industry: Investment Services, Market Cap: £74.2m, StockRank: 98.
Record is a specialist currency manager, which means it manages currency exposure (with hedging products) for its largely institutional client base. It would be churlish to say that the devaluation of sterling in 2016 was welcome news for Record. But there is no doubt that currency exposure shot up the agenda this year, and Record benefitted as a result. High quality and momentum are the standout features.
Company Statement: “We are actively anticipating the impact of Brexit on our clients and all aspects of our business, and regard the maintenance of our ability to serve EU clients following departure as essential.”
NB - JPEL Private Equity is the highest ranking Financial, but was removed due to it being a collective investment vehicle.
Telecoms
Manx Telecom Industry: Telecommunications Services, Market Cap: £226.5m, StockRank: 88.
High ranking telecoms stocks that fit the NAPS rules are thin on the ground. But with Manx Telecom there are some promising signs. This Isle of Man based communications group is strong on quality and has a reasonable growth profile. The share price action has been unexciting and brokers are cool on it, but the overall picture seems encouraging.
Company Statement: “We are confident in the long term outlook for the business which continues to trade in line with the Board's expectations for the full year.”
Telecom Plus Industry: Telecommunications Services, Market Cap: £947.7m, StockRank: 85.
Telecom Plus trades under the Utility Warehouse brand, and it offers discount deals to consumers on things like mobile, broadband and energy bills. There has been consistent strength in the shares in 2016 and the stock ranks well for its quality - but less so for its valuation, which looks a little pricey. Part of the reason for that is a decent growth track record that’s forecast to continue.
Company Statement: “The business continues to perform in line with our expectations and I am pleased that the number of members and services we supply both reached record levels during the period.”
If you are running a NAPS style portfolio please could you answer a few questions about your own process in this survey : https://www.surveymonkey.co.uk/r/3TG85FW. We’ll write up any answers given in a future article and quite possibly an ebook on the topic - so please do send in your comments.
The recent strong momentum in the performance of the higher StockRank stocks in general suggests that 2017 may get off to a continued good start. Best of luck in 2017 and Safe Investing !
Disclaimer
This is not financial advice. Our content is intended to be used and must be used for information and education purposes only. Please read our disclaimer and terms and conditions to understand our obligations.
52 comments
Hi Ed ,
I'm jest wondering if this is still something you'll be updating over the next few weeks. Iv found this to be a most excellent way of reviewing my own SR portfolio every 6 months of so ( April to April) for me as I then use my ISA allowance to top up,it's always good to review it along the way & your updates as well as falling halfway have provided great thought & good "how goes it" along the way.
Hi Ed, Can you answer a few questions for me re NAPS.
1. You refer above to a re-balancing on 1st July 2016 (called SNAPS if I read it correctly) and I am wondering if this was a rebalancing you did only as a result of the EU vote shortly before or if it was co-incidental and it would have been done anyway,
2. I note now you are saying that the Joker is to rebalance when a major occurrence takes place that affects the market. Will you be doing this as and when it happens an publish the new picks?
3. I the Jan 2017 NAPS, one company IQE has performed very well but is now showing almost as a junk stock because of its high value. With this system will you just leave a stock like this in place in the portfolio, until a complete rebalancing is done, or would you ever in isolation knock out certain stocks and replace them?
Sorry so many questions!!
George
Hi there, I really should create a single portal page for all the NAPS articles and the portfolios.
I've been running the semi-year "SNAPS" portfolio at the 6 month mark (July 1st). It's a comparison to see how well a 6 monthly rebalanced portfolio performs vs the annually rebalanced version. There's not been much in it to date, but it was notable that a portfolio refresh after Brexit worked out very well for the SNAPS version.
Most people who are using a similar system to this have created their own iterations on the NAPS ideas. I use a varied version myself with more investment in international stocks and some shorting as a hedge at times. I aim for these articles to be primarily educational, to trigger conversation and be illustrative of some sound thought processes.
So I won't be updating the portfolios ad-hoc or when I think a market friction has happened. I'll be sticking to my Jan 1st and Jul 1st updates.
Re. IQE - yes I've noticed it flirting with Momentum Trap status in recent weeks. It likely won't make it into the SNAPS but would continue to be held in the NAPS till next January.
The NAPS are now up 70% since inception (2015) versus 72% for the SNAPS before costs. So both are running at about 25% annualised. I certainly don't expect that level of performance to continue... I'd be amazed if it did. I was hoping for 14%+ annually for such a well diversified, long-only portfolio.
Markets have been kind for the last few years, and at some point they will undoubtedly turn against us. I've tried to be cautious in the NAPS portfolio construction, and ensure a good diversified spread. In the SNAPS this year I may go for a Risk Diversified approach, rather than a straight sector diversified approach just to mix it up a bit .... I've got a couple of months to think about it.
The NAPS are up about 12% year to date, so it's been a good start to the year.
Hello Ed
Have you looked at taking actions or setting stop loss on NAPs eg when a stock drops below an overall 80 ranking?
Ciarán
Hi Ed,
Thanks for your reply. Actually it wasn't me that suggested a £250m cutoff.
You made some good points. But a point you didn't make is that although small companies tend to perform better than big companies in bull markets, they tend to perform worse in bear markets. The StockRanks performance history extends only over the last four years, which was over a prolonged bull phase in the UK stock market. The last major bear market was over the Credit Crunch years of 2007-9, so we might be due for another in the next few years.
Haha - good point !!!
Ed,
Is there a link to the actual Screen for the 2017 NAPS? The link from the 2016 NAPS article just takes you to the 2015 article.
Hi Ed,
You wrote:
"The StockRanks have worked best amongst small cap or penny stocks... here's the top decile of returns for stocks of market cap between £1m->£100m - a near 150% return in under 4 years. Obviously there's far higher trading costs in the small cap area of the market, so the below would not be fully achievable, but it serves to illustrate the size of outperformance."
I'm not sure of the actual figures, but let's assume for the sake of discussion that £1m to £100m stocks have bid-offer spreads that are 2% on average, whereas companies larger than £100m have spreads of 0.5% on average, which means the difference between the spreads of small and large stocks is 1.5% on average. StockRanks were introduced about three and three quarter years ago, so there have been 15 portfolio rebalances at three-month periods since then to create the StockRank performance records. If all stocks in the portfolio are sold at each rebalance, the performance record of small (£1m to £100m) stocks should therefore be multiplied by a factor of 0.985 (=1.000 - 0.015) multiplied by itself 15 times for a fair comparison with the performance record of big stocks (over £100m). 0.985 to the power of 15 is 0.797. Therefore there should be a significant reduction (of about 20% if my assumptions about average bid-offer spreads are correct) in the overall performance of small stocks in the StockRank records for a fair comparison with the performance of big stocks.
In the above, I have assumed that dividends from small and big stocks are about the same on average. That is probably incorrect, as bigger stocks tend to have higher dividend yields, so if we took dividends into account then that would also enhance the performance records of big stocks relative to small stocks.
pka - you are very right to bring in the trading costs... let's break it down a bit further with your £250m cutoff... we'll stick to quarterly rebalancing in the analysis (even though I'd never recommend it for most private investor portfolios - but the maths works out pretty similarly on the annually rebalanced performance).
On those assumptions the performance is just about equal...
But of course the above assumes a 100% rebalance on each quarter - which wouldn't be the case as the portfolios don't churn nearly as much as this. The last time I looked there was about a 55% churn in the deciles each six months (it would be less quarterly). But let's call it 50% churn per quarter to be conservative... that would mean the spread cost was halved.
Performance...
i.e. Small Caps may add significantly to the realisable performance, but there are clearly limits to arbitrage.
I believe though that the diversification benefit of including small caps is the far, far greater win than the performance benefits. And the other thing is, small caps are just more fun / elephants don't gallop... a lot of Stockopedia subscriber portfolios have benefited enormously from stocks like International Greetings (IG Design) in the last few years ! (up about 250%).
Would it not be more prudent to restrict a NAPS portfolio to stocks with a minimum market capital of, say, £250 million? This should significantly improve the liquidity of the portfolio and reduce rebalancing costs. Is the potential extra gain from including smaller companies really worth the risk?
If you track back to the 2015 cohort, the answer was a definitive yes - the small/micro-caps had a very strong impact. In 2016 they haven't so much, but in the SNAPs portfolio (rebalanced in July) they contributed very strongly again... in fact much more strongly than mid-caps.
One of the most well known anomalies in finance is the small-cap effect. Small caps tend to outperform large caps. I personally think private investors are at a huge advantage over institutional investors when it comes to owning small caps... as we can buy in smaller size. Institutions can't trade them so often neglect them.
The StockRanks have worked best amongst small cap or penny stocks... here's the top decile of returns for stocks of market cap between £1m->£100m - a near 150% return in under 4 years. Obviously there's far higher trading costs in the small cap area of the market, so the below would not be fully achievable, but it serves to illustrate the size of outperformance.
The key point of the NAPS from the start is that it's easy to iterate on the ideas to create a version that suits your own investment philosophy and/or goals. Changing the size groups, regions, sectors, StockRank styles or otherwise can all be effective alternative diversification approaches.
Hi Ed,
Thanks for the graph illustrating the performance of returns of shares within a certain market cap range. It would be very useful to be able to have the capability of choosing a market cap range in the Performance section of the site rather than being limited to specifying above a market cap. Are there any plans to introduce something like that?
Regards,
Brian
Brian - you can actually hack it by editing the url. After you've clicked the submit button you will see a URL in the browser. One of the query string parameters is 'cap' - which has a lower bound of capitalisation in millions. You can change this to a hyphen delimited range. e.g. ?cap=10-100 would select all stocks between £10m and £100m. Look at the url below:
http://www.stockopedia.com/stockranks/performance/?exchanges=LSE%2CISD&field=_QVMScore_lo?=10-100&period=1&buckets=deciles
Ed
You are allowed to take Sunday off you know
:~)
T
Is it possible to hack the url for developed Asia, Australasia & Canada?
Hi Ed, that does not work for me. All I get is a line for the FTSE all share.
Hi Ed
Wonderful article - hope this is a new question as I haven't read all the other posts
You have convincingly demonstrated the outperformance of the top decile stockcharts - however, the other potentially amazing thing you alluded to in your article was the relative outperformance of a diversified portfolio.
However, I wasn't sure how much to read into your graph as we know that individual portfolios are going to vary enourmously by chance
My question is therefore : have you been able to do an analysis comparing the median results of n portfolios of top stockranks without diversification vs n portfolios top stockranks with diversification
I'm sure you have or could...
Chris
Hello,
Just to add, I would love if you could manage a Swiss NAPs
Congratulation, Ed on another excellent article. The support for UK stocks is amazing, and cheap at £200.
However, I think you should do other market NAPs and perhaps focus more on these regions as everything written is UK bias at the moment. In the present climate we all need to diversify as much as possible but need more support,
I would certainly upgrade from just UK if there was more support for other regions than just the Stockopedia report ( which does not include all info eg Dividends etc) as UK Stockopedia Report
Hope this is helpful
Aloha Ed,
Good ideas and being in the US, would like to see how that would translate to our macro issues (ala the Fed and the election and the Thrump bump). I see your service someday having a Geocentric approach/editor/GM, or the major economic regions, and while I trade equities, a portion of my trading centers on options and cash futures. None the less, I have subscribed and think your system has a lot of merit. Now all I have to do is figure out how to make it pay for the $ and the time. I think I can. Best Regards,
Great article Ed.
All the statistics are I presume in GBP, so flattered - in terms of any other currency - by its post-referendum drop. I judge my personal investment results in a subjective personal index of USD/EUR/GBP reflecting the currencies in which I might in theory consume the fruits of my efforts. Investors' choices in respect of currency positioning have a huge impact on overall returns, measured in any currency.
Any chance of naming Euro-NAPS as previously? Or even global NAPS within Stockopedia's coverage?
Regarding setting stop-loss levels, I look for chart signals, breakout levels etc. based on the characteristics of the share price, I don't know how you could automate this with a simple metric. I'd like to see the Sharpe Ratio though, on the stock sheets.
Is there a Euro Naps?
I don't remember seeing one.
I think PhilH produced one.
I keep thinking about doing European and US NAPS - but there's too much work involved for us at the moment. I am thinking of writing an ebook on the topic and if I do I'll run some backtests on other markets. At this stage though it's UK only.
We're getting some fascinating results from the NAPS survey - quite a few people have been doing NAPS strategies internationally... I'll update on that in due course.
Thanks Ed, I think European would be worthwhile, looking at the guru screens most European based ones seem to outperform the UK ones but maybe that is partly due to currency movements.
Only problem with European shares is being able to buy them online through my broker.
For context on rebalancing as I have just done this on a portfolio this week. Not a NAPS but does tend to include a mix of market caps, sectors and high stockranks.
Cost to rebalance was almost 2% of my entire portfolio value. Admittedly that is partly a function of its small size, but then many subscribers will have small portfolios that are rule-based.
Fulcrum Utility Stock Rank 78??
Ed,
Have revisited your NAPs and there seems to be a mismatch between ranking in the overall QVM ranks and the individual sector rankings. Using the latter gives your selection (apart from Record due to spread) but using overall ranking led to my question on selection. Apologies for any confusion!
Andrew - Record only hit a 6.8% spread on the 31st December when the final list was decided. But given its average spread over the last month has been 3.8% with a standard deviation of 1.5%, and only 3 trading days above 5% out of 20 we felt it ok to include. 31st December, after all, is a low liquidity day and we'd already run the screens on previous days. You could argue this is bending the rules, but we'd already done most of the work before New Year, and time is a limiting factor.
Due to the additional requirements of a minimum market cap of £50m, only allowing 1 stock in each industry group and ensuring a third each in small caps, mid caps and large caps there can appear to be some lower ranked selections. In a stratification technique like this many higher ranked shares are unselected as they disqualify due to other diversification requirements. I have to admit I do raise an eyebrow now and then over the results too. But I've written a script to create this portfolio and I try to stick to the results.
Thanks, Ed. Appreciate the explanation - any comment on my second question or is that top secret!
Hi Ed,
Two questions about your excellent and interesting NAPs article and associated commments:
1. Am I missing something in the methodology of your selections but in the industrials sector don't Globaltrans investments, Go-Ahead, and Air Partner meet your criteria and rank higher than Wizz Air and Morgan Sindall and wouldn't break the 666 (!) rule for size diversification. Similarly doesn't SCS come in ahead of Games Workshop?, Finally Record has a 822 bps bid offer spread so should this have been exluded for the next company consistent with the selection criteria?
2. What do you mean by a 'leveraged long short version' of NAPS?
It may not be an original thought, but have you looked at the difference in performance if you'd had a fixed percentage stoploss in place? I would imagine that if you buy a basket of shares using a Stockopedia screen, it's not a big leap to, for example, sell any shares that hit -10% and then have a rule that reinvests the proceeds.
I did look at that on the 2016 NAPS, what I found with a 10% trailing stop loss, 75% of the shares would have been sold. As you can see the selection ended in profit, if you had sold 75% I believe you would have lost about 5%, interestingly all the best performers would have all been sold. Then what would you do with the cash?
With a fixed stop loss of 10% 4 of the top 5 would have been sold. Reinvest in what? But if the market falls should you have a stop loss? Or should the stop loss be more than the market fall?
As my Brexit NAPS shows which is up 28% that is the time to be buying not selling.
Regarding stop losses.... there's a lot of misunderstanding over them.
Personally I think a 10% stop loss is way too tight for most shares. 20% is just about manageable, but every share has its own individual volatility. I haven't run the numbers but I think the average share in the market has a 6 monthly standard deviation of price movements of over 30%. This will stop out a huge number of positions if using a 10% stop loss.
It's better to use a volatility based stop loss adjusted for the individual stock (if used at all). Watch this space as I hope to introduce new features based on these ideas in the next year.
Spread is a difficult one, some shares it does vary considerably, I was looking at Revolution Bars (LON:RBG) the other day and that was nearly 10% but on Stockopedia it's only showing as 286bps. The problem is if you want to sell if things go wrong it can be difficult to sell and the spread will probably be even wider. So I would be a bit cautious with such shares, i generally avoid them now. They can be value traps had that with Aukett Swanke (LON:AUK) and Elektron Technology (LON:EKT) fortunately I got out of those without losing much money..
Two shares I bought recently, late last year, Revolution Bars (LON:RBG). and Gattaca (LON:GATC). had very large off putting spreads. I was, however, able to buy via kill or fill order at a much reduced spread than being offered. So I'm not sure if it is buyers/sellers or brokers setting the spread?
I think it's the market makers that set the spread, yes often you can buy well within the spread price depending on the size of the deal, I understand that the spread is the maximum, if you buy or sell. You may need to look at EMS (Exchange Market Size), it not usually a concern for me as I only buy small amounts in small caps, for Paul it can be a problem buying and selling some shares. But some shares are very difficult to buy and sell. I think it was James Latham (LON:LTHM) I had a lot of trouble buying, I had to leave a buy order in the end. Bioventix (LON:BVXP) is one with a wide spread but at times you can get very narrow spread, I bought at 962.5p when the mid price was 950p. It pays to watch some of these shares before buying. A lot depends on trading volumes. The problem can be getting out, if there is a profit warning or if no one is buying.
Just looked at Gattaca (LON:GATC) and the spread is only 1p.
Early morning the spreads tend to be wider.
Thanks Ed, yes I agree that's why I have stop using auto stop losses, some did not work anyway if there was a profit warning or Brexit. With shares such as IG Design (LON:IGR) you would need a pretty wide stop loss not to get stopped out. There is nothing worse than getting stopped out and then seeing the shares bounce up, I'm sure market makers do this to buy cheap stock.
I will look out for these new features, sounds interesting.
Hi,
I agree, 10% even 20% stops i.e. fixed percentages don't work - are you not just throwing money down the drain by applying this fixed methodology as a generalisation to your portfolio? If your position has moved 20% against you then you have got something seriously wrong in your analysis!
Trade management needs just as much thought as trade entry and a lot of investors and traders don't give this part of the process the time it deserves. Most of the money you'll make will be by the proactive management of your position, especially in the world of trading.
As you point out every stock is different and should be treated as such.Some can be boring and flat others like a bull in a china shop. Stocks are one of the most volatile markets and individual stock volatility needs to be factored in - it will save you a lot more money and improve your results significantly. (FX btw is the least volatile although it has the perception of being the most - a big move in this world is 2%/3% a day).
How can you apply a systematic approach to your investing / trading? Simple: Technical Analysis.There are countless methodologies that can be used: moving averages, Fibonacci, support and resistance, volatility based approaches such as ATR (by a multiplier) or using price standard deviations / bands. I coached an Investment Club to adopt these approaches rather than use their fixed 20% drawdown approach and their results have significantly improved.
Regards
Stephen
There are small cap benchmarks but I agree why not pick a fund that you would invest in. I would use the Marlborough UK Micro Cap Growth , thats about the closest to my investments and I did have until about 1 year ago, or you could pick a Guru screen but some have too many "foreign" companies for my taste.
Paul did link to a small cap index about 2 weeks ago that I thought was good.
"Unfortunately, the popularity of the benchmark indices run by FTSE, S&P, Dow & MSCI have led many investors to think they have underperformed in 2016. But these benchmarks are unrepresentative of the typical portfolio. They are market cap weighted and dominated by just a few large shares. Personally, I think it’s time to give these indices the boot. It’s better to benchmark against an equally weighted index or a benchmark based more closely on your own investment universe."
The popularity of these benchmark indices is probably due to the fact they have done well over time.
Am I right in saying such market-weighted indices effectively use the Stockopedia mantra of 'running your winners and cutting your losers?
I mean, they simply hold more of the shares that have outperformed and less of the shares that have underperformed.
Really interesting piece of analysis. I particularly like the chart headed "Performance of random 90+ stock ranks since Jan 2016" ...this seems a very good argument in favour of stock ranks. IE you can still be unlucky, but probability is on your side.
Secondly, I also agree with point about less time intensive strategies. I imagine that most people on stockopedia enjoy the process, enjoy reading about companies, reading Paul and Graham's pieces. I know I do.
But it's not for everyone, it looks like NAPS is a good process for people who have a life!
To be clear Ed, you invest your own money in NAPS?
As Taleb would ask "Skin in the game?"
@Bruce - yes I do use the NAPS - but I use a leveraged long short version for my own funds.
It's been grating me that I've not been running a strictly long only NAPS strategy myself, but I'm going to be rectifying this within weeks - watch this space as I'm hoping to run a £100k portfolio publicly - warts and all.
For the record though - the StockRanks are the only valuation metric I use in my own investing. That said, we always emphasise the need to DYOR and understand whatever system is being followed.
Jolly good to see that you are "eating your own cooking." I will follow with interest.
NAPS seems like a simple commonsense process.
"Maybe we should create one"
Ed, I think that would be a great idea. Justin U-Stewart was musing on Twitter over the holidays that our current UK benchmarks are inadequate. Maybe there is scope for some collaboration between you.
For the record, I benchmark externally with the FTSE All Share as that seems more appropriate to my own holdings. Internally, I benchmark against a couple of funds that I favour (i.e. the funds I would give my money to if I decided to become a passive investor).
Should be Lavendon in your opening para. The best approach here has been masterful inactivity-indeed the bidding war is still running...........
I don't benchmark but if I did I'd use Berkshire.
This is 'almost' off topic but I thought I'd mention it as it's a twist on the normal comparative index selection.
Over the new year I was in conversation with someone regarding the question of measuring yourself against an appropriately selected index. He had a portfolio of smallcap shares and was comparing it with the FTSE100, which I suggested was not an appropriate comparison.
The counter argument was that he used the FTSE 100 as a comparison as it is the main UK index benchmark and probably the index he would invest through a tracker or a fund. In other words comparing his DIY investment style with a practical alternative of getting a 'professional' to do it on his behalf. This was, I thought, quite a compelling view. Compare your own performance against a practical alternative rather than the universe of similarly comparable companies reflecting your own portfolio style.
Carcosa
Carcosa
There are plenty of FTSE250 trackers in the form of a fund or ETF, I would have thought that it would be a more appropriate comparison than the FTSE100 to a small cap portfolio.
That's how I measure my performance. I asked myself what I would do if I was to invest passively. I would have split my money equally between ETFs tracking the Nasdaq, the S&P, the FTSE 100, and MSCI World.
I'm not saying that's a perfect benchmark in any way, but it's what I would have done in my alternative universe.
Happily I have been outperforming by a sufficient margin not to need to worry too much about the fine details of the benchmark construction or tracking the effects of currency movements.
Hi Ed
Excellent article, as usual. I have a question on your comment:
Personally, I think it’s time to give these indices the boot. It’s better to benchmark against an equally weighted index or a benchmark based more closely on your own investment universe.
This is something I've been looking at recently and I'm struggling to find any appropriate equal weight index; do you, or anyone else, know of such things? The only vaguely useful one I can find is the FTSE 100 Equally Weighted Index, but the FTSE 100 is the one index I've no interest in at all.
A Happy New Year to one and all,
timarr
I was looking for a good benchmark while writing this article up, but all I could find for the UK was the same index as @timarr - the FTSE 100 Equally Weighted Index.
The private client industry uses APCIMS or ARC for benchmarking - but those aren't equity only indices. I do think there's a space for a good broad basedequally-weighted index for UK & European stocks (like the Russell 3000 in the US). Maybe we should create one.
There are a number of equally weighted S&P indices. The link goes to the S&P 500 one but it has links to related indices also.
http://us.spindices.com/indices/equity/sp-500-equal-weighted